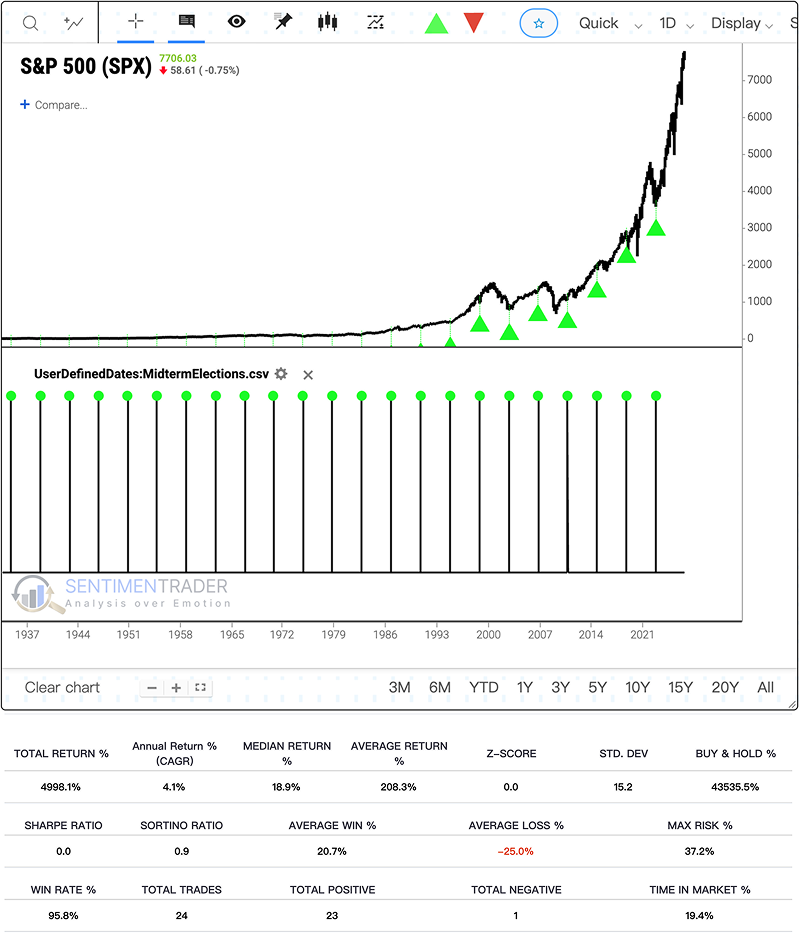
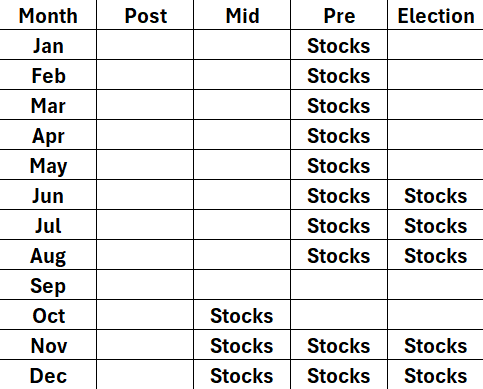
Midterm years have historically outperformed other presidential-cycle years after a late-September S&P 500 entry. The advantage appeared before election day and survived nearby entry dates, but 1930 and the deep 2018 drawdown show why a high win rate does not mean low risk.
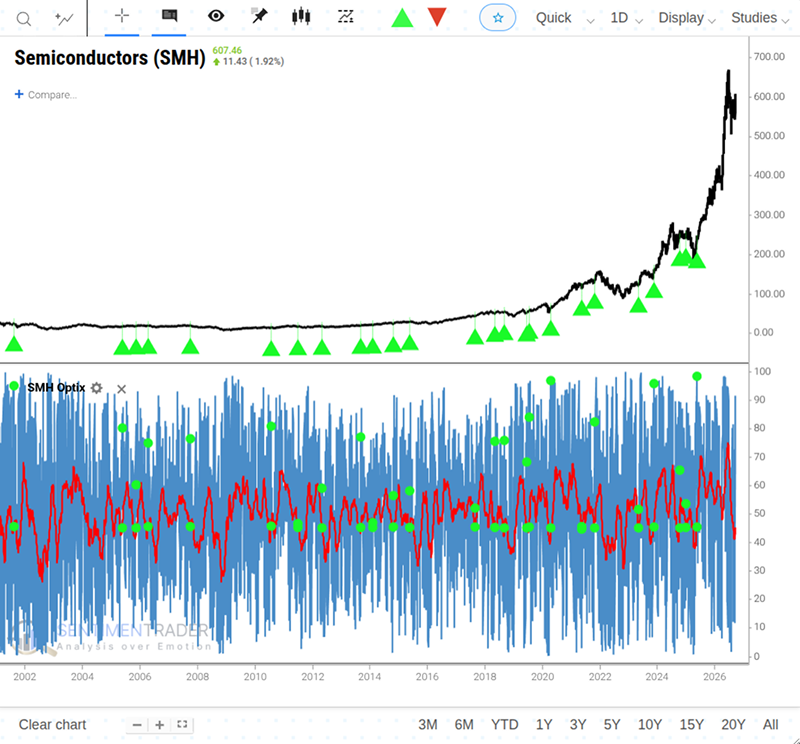
The VanEck Semiconductor ETF ($SMH) has rebounded strongly, with a bullish Optix signal boasting a 76% 1-week win rate. However, history shows waiting one month for price confirmation pushes the subsequent 1-month win rate to a massive 93%.
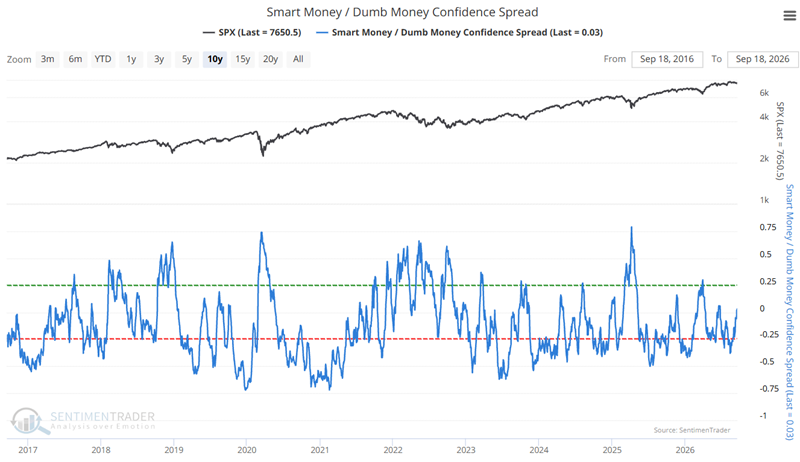
The Smart Money/Dumb Money Confidence Spread is an important sentiment indicator. In this note, we test a systematic approach in Backtest Engine 2.0 using a recently triggered entry signal with exit criteria added.
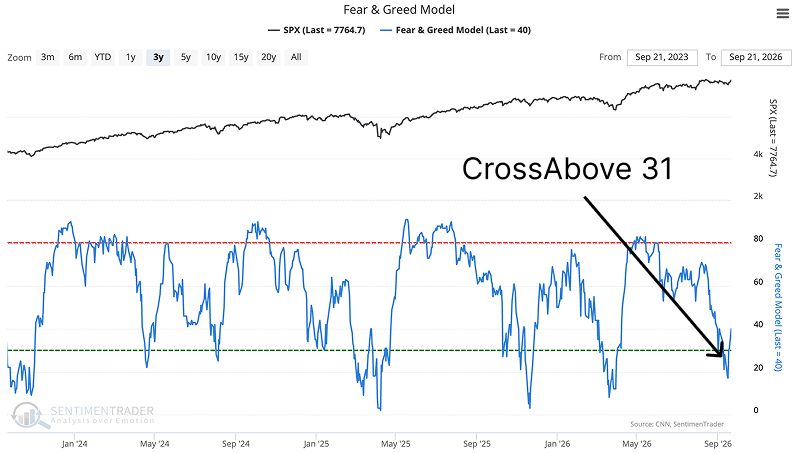
SentimenTrader's Fear & Greed Model recovered above 30 while the S&P 500's long-term trend stayed intact. Similar signals usually preceded gains but did not beat era-matched random dates; within the 20–30 band, direction mattered more than level.
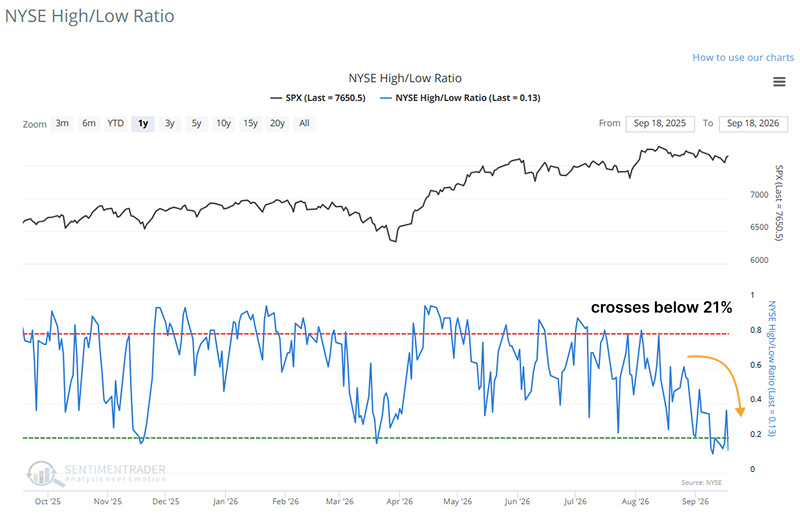
The NYSE Percentage of New Lows and 200-Day Average model has triggered a risk-off signal. With deteriorating internal breadth masked by the S&P 500 hovering near its highs, historical data warns of a high probability of a near-term correction.
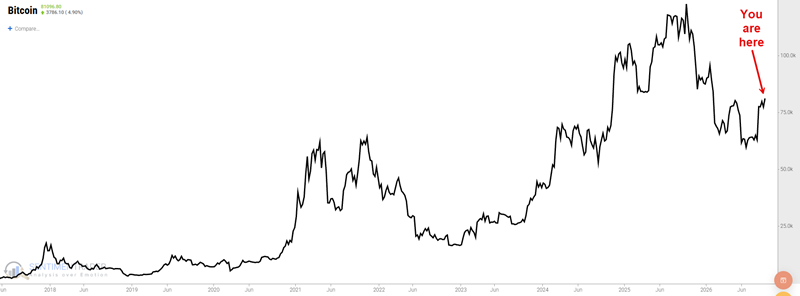
After another major drawdown, Bitcoin has rallied sharply. Does this rally have legs? A variety of indicators suggest a specific answer. Details herein.
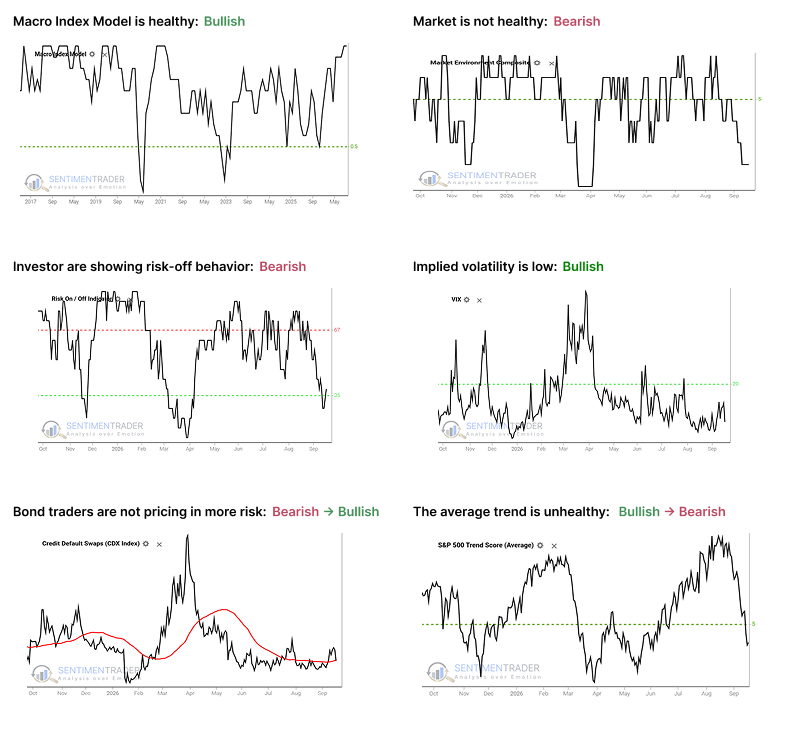
The Fed's first rate hike and an MEC reading in the "Danger Zone" warn of short-term equity drawdowns. Yet, powerful long-term models like the AAII Bull Ratio and Real M2 money supply are flashing historically bullish 12-month signals.
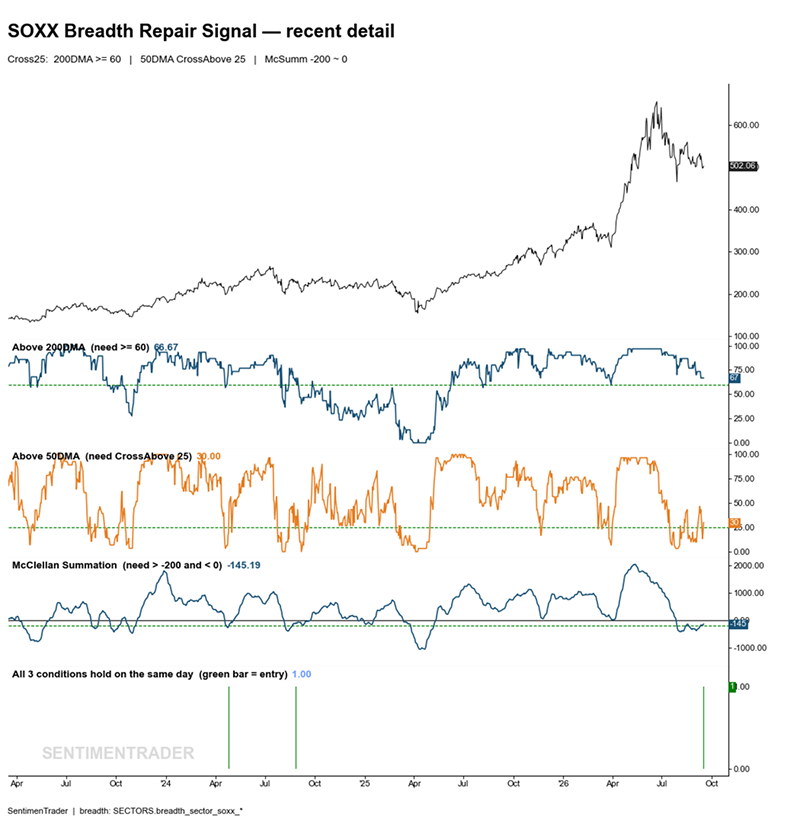
SOXX breadth is attempting to repair while long-term participation remains intact. Historical returns leaned positive but were uneven, as AI leadership stayed dispersed, cyclical chipmakers remained weak, and industry volatility normalized.