Products
SentimenTrader Trading Tools
‍
Backtest Engine
My Trading Toolkit
Correlation Analysis
Seasonality
Market Prediction
Indicators & Data API
‍
Proprietary Indicators & Charts
Market Data API
Strategies & Scanner
‍
50+ Trading Strategies
Smart Stock Scanner
Smart Option Scanner
Research Reports
‍
Research Solutions
Reports Library
Free Resources
Simple Backtest Calculator
Simple Seasonality Calculator
The Kelly Criterion Calculator
Sentiment Geo Map
Public Research Reports
Education
Sentiment Indicators
Technical Indicators
Pricing
Company
About
In the News
Testimonials
Client Success Stories
Contact
Log inLoginSign up
< BACK TO ALL REPORTS

TradingEdge Weekly for Sep 18 - M2 model at +2 bullish signal, Market enters danger zone, Gold model turns favorable

by Sentimentrader
2026-09-18
The Fed's first rate hike and an MEC reading in the "Danger Zone" warn of short-term equity drawdowns. Yet, powerful long-term models like the AAII Bull Ratio and Real M2 money supply are flashing historically bullish 12-month signals.

Key points:

  • The M2 Stock Market Model currently reads +2 (both indicators favorable); since 1960, $1 invested only during +2 months grew to $21.65, versus $6.59 during +1 months and $142.69 when the model is greater than 0.
  • The High Beta/High Quality ratio crossed above 85 and the OEX put/call open interest ratio fell below 0.775; historical 6-12 month SPX win rates were 87% for both signals.
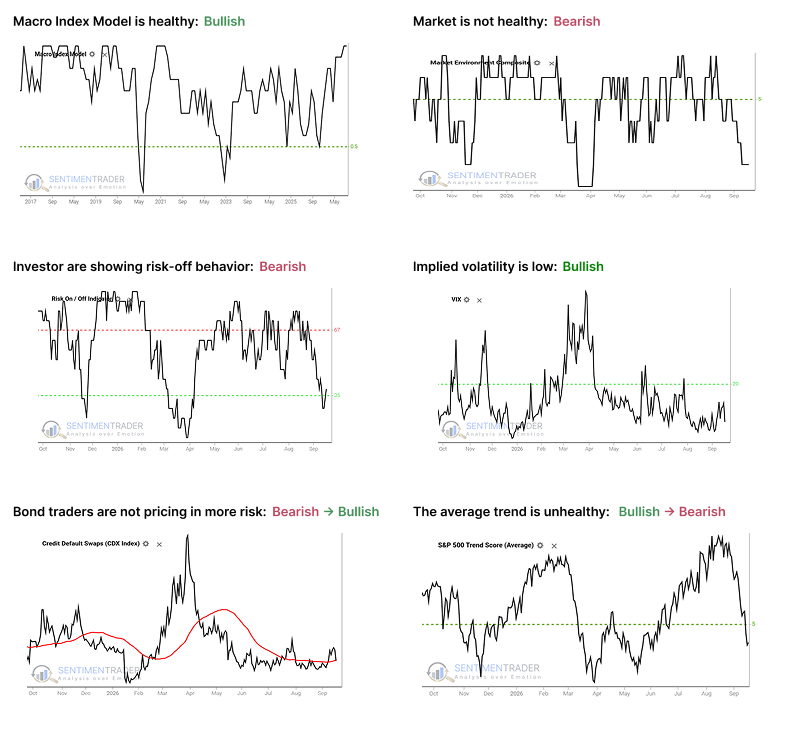
  • MEC reading fell to 2, entering the "danger zone"; historically, healthy environments saw $10,000 grow to $48,057 versus $16,341 in unhealthy environments, with maximum drawdowns of -63.6% vs -20.3%.
  • Slowing Real M2 growth (declining 12-month rate of change) is favorable for gold; since 1974, $1 grew to $10.69 during slowing months versus $2.27 during accelerating months, and $32.21 when Gold/Real M2 ratio exceeded its 26-month EMA versus $0.75 when below.
  • Risk On/Off indicator fell quickly from above 67 to below 35; historically, SPX was still 88% higher 1 month after the signal, but weakness emerges around 1 month out with 2-week positive rate falling to 25%, and avoiding that window improves historical returns.
  • Soybean futures rallied 13% in just over a month but are entering a seasonal weak period (TDY #176-191, Sept 15-Oct 6); since 1937, beans declined roughly 2 of every 3 years during this window, with losing years much larger than winning years.
  • CME FedWatch shows >90% probability of a rate hike; historically, stocks almost universall

Sorry, you don't have access to this report

Upgrade your subscription plan to get access
Go to Dasboard
PRODUCTS
SentimenTrader
Trading Tools
Indicators & Data API
‍
Strategies & Scanner
‍
Research Reports
FREE
RESOUrCES
Simple Backtest
Calculator
Simple Seasonality
Calculator
The Kelly Criterion
Calculator
Sentiment Geo Map
‍
Public Research Reports
‍
Education
Sentiment Indicators
‍
Technical Indicators
‍
Pricing
Bundle pricing
‍
FAQ
‍
Announcements
‍
COMPANY
‍
About
‍
In the News
‍
Testimonials
‍
Client Success Stories
CONTACT
‍
General Inquiries
‍
Media Inquiries
‍
Financial Professionals Inquiries
‍
© 2026 Sundial Capital Research Inc. All rights reserved.
Setsail Marketing
TermsPrivacyAffiliate Program
Risk Disclosure: The information and tools provided are for research and analytical purposes only and are not intended as investment advice. Market analysis involves uncertainty, and outcomes may differ from expectations. Users should conduct their own due diligence and consider their individual circumstances before making any financial decisions. Past performance is not necessarily indicative of future results.

Hypothetical Performance Disclosure: Hypothetical performance results have many inherent limitations, some of which are described below. No representation is being made that any account will or is likely to achieve profits or losses similar to those shown; in fact, there are frequently sharp differences between hypothetical performance results and the actual results subsequently achieved by any particular trading program. One of the limitations of hypothetical performance results is that they are generally prepared with the benefit of hindsight. In addition, hypothetical trading does not involve financial risk, and no hypothetical trading record can completely account for the impact of financial risk of actual trading. for example, the ability to withstand losses or to adhere to a particular trading program in spite of trading losses are material points which can also adversely affect actual trading results. There are numerous other factors related to the markets in general or to the implementation of any specific trading program which cannot be fully accounted for in the preparation of hypothetical performance results and all which can adversely affect trading results.

Testimonial Disclosure: Testimonials appearing on this website may not be representative of other clients or customers and is not a guarantee of future performance or success.