
Weekly wrap - Breadth blast, Asia-Pacific participation, oil vs. gold vs. stocks

NOTE: THE WEEKLY WRAP WILL NOT BE PUBLISHED THE WEEK ENDING AUGUST 29
House view:
- Stocks:
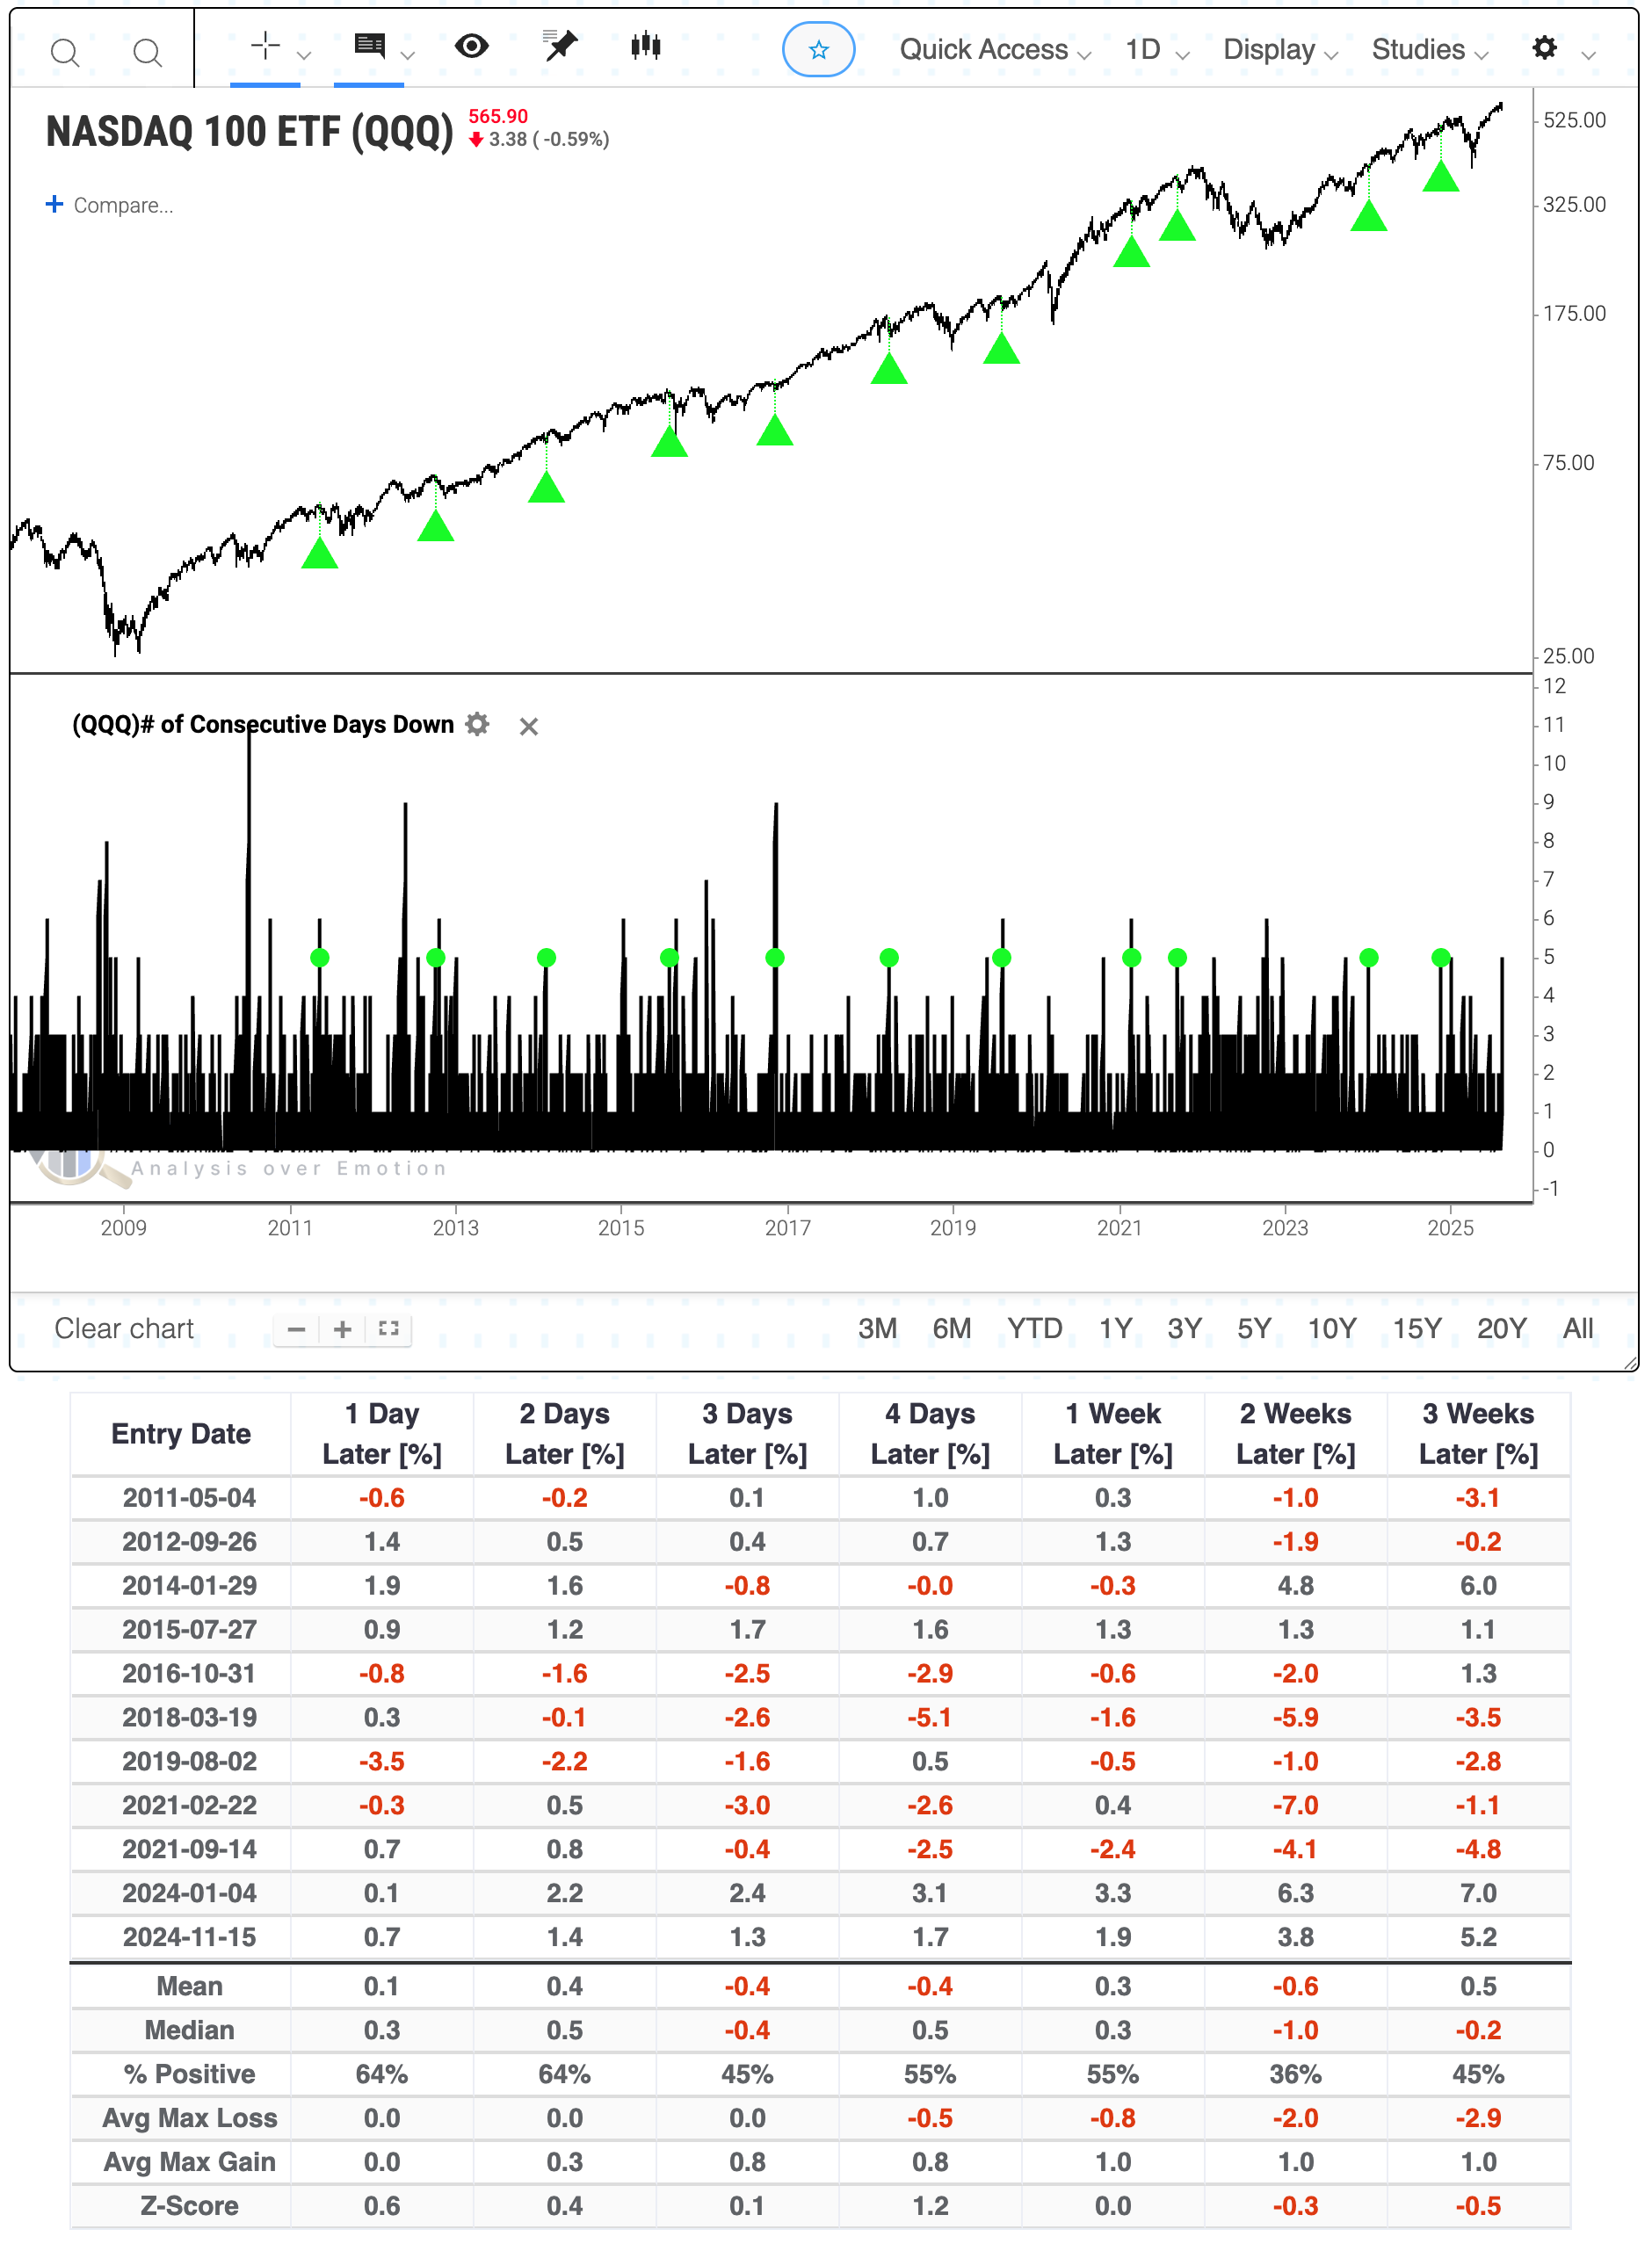
- Short-term: Modestly bearish. Compressed VIX during this time of year consistently preceded weak returns, as did Julys with numerous new highs in the S&P 500 and Nasdaq Composite. Robust earnings have been met with a churning market, with multiple fades from emotional gaps up. Consecutive down days from a high on QQQ tends to be negative, as does big breadth surges on a push to new high as we saw (or close to) on Friday...but in the very short-term only. This time frame covers 1 - 4 weeks.
- Intermediate-term: No view. Positive earnings haven't led to much sustained upside, and speculative trading activity is bumping against historical extremes. Valuations by nearly any metric are at or near multi-decade ceilings. But huge surges in breadth at/near new highs like we saw on Friday have an excellent record at preceding gains over the next few months. This is a tug-of-war that shows no clear edge. This time frame covers 1-5 months.
- Long-term: Bullish. The recovery from the April panic has been historic, and signs since then have supported a long-term bullish move, with primarily economically sensitive sectors leading. Long-term breadth measures have improved across sectors and world markets, which have consistently preceded positive 6-12 month returns in most equity indices. This time frame covers 6-12 months.
- Cyclical momentum tends to favor those sectors for average returns
- Defensive sectors also doing well, with momentum favoring high win rate but lower average return
- Very long-term (one year+) favors mean reversion to equal-weight, small-caps, and health care
- Bonds: Long-term cycles remain bearish. Historically, August has been one of the strongest seasonal months for TLT, but since the 2020 peak, it's been one of the weakest. That leads into September and October, which are traditionally weak. We haven't seen much among analysts' studies to suggest a change in trend.
- Commodities: Signs point to a probable secular bull market following multiple new highs. An effective commodity trend model is currently bullish. Gold (especially gold miners) and silver are extended and have a bad history of sustaining gains but gold continues to shake that off as it churns near its highs. Oil seasonality is weak for the next three months, and other factors like term structure suggest headwinds, but speculators are now pushing short bets to multi-year extremes, which have preceded rallies in recent years.
- Crypto: We follow several simple systems for bitcoin, which we consider the equivalent of the S&P 500 for crypto. Due to bitcoin's explosive growth over long periods, it's dangerous to equate neutral conditions with being bearish for some of these. However, if a system is "out," we consider it bearish for this summary.
- Triple 40: Bullish (barely)
- RSI Momentum: Bullish
- Trend and Relative Trend: Bullish
- PMI: Bearish
- M2 ROC: Bullish
Where we're at
Most investors have the most riding on equities. We feel that the most significant determinants of success for investors are whether to adjust their allocation to that asset class based on factors that have historically had a good record of preceding above- or below-random returns in the months ahead.
Those factors include the probability of a looming recession, sentiment, price action, volatility, breadth, and the bond market. The chart below summarizes the main indicators and composite models we watch for those factors, and they're mostly in bullish regimes. Valuations are not part of these factors since the relationship has been too inconsistent on time frames under one year.
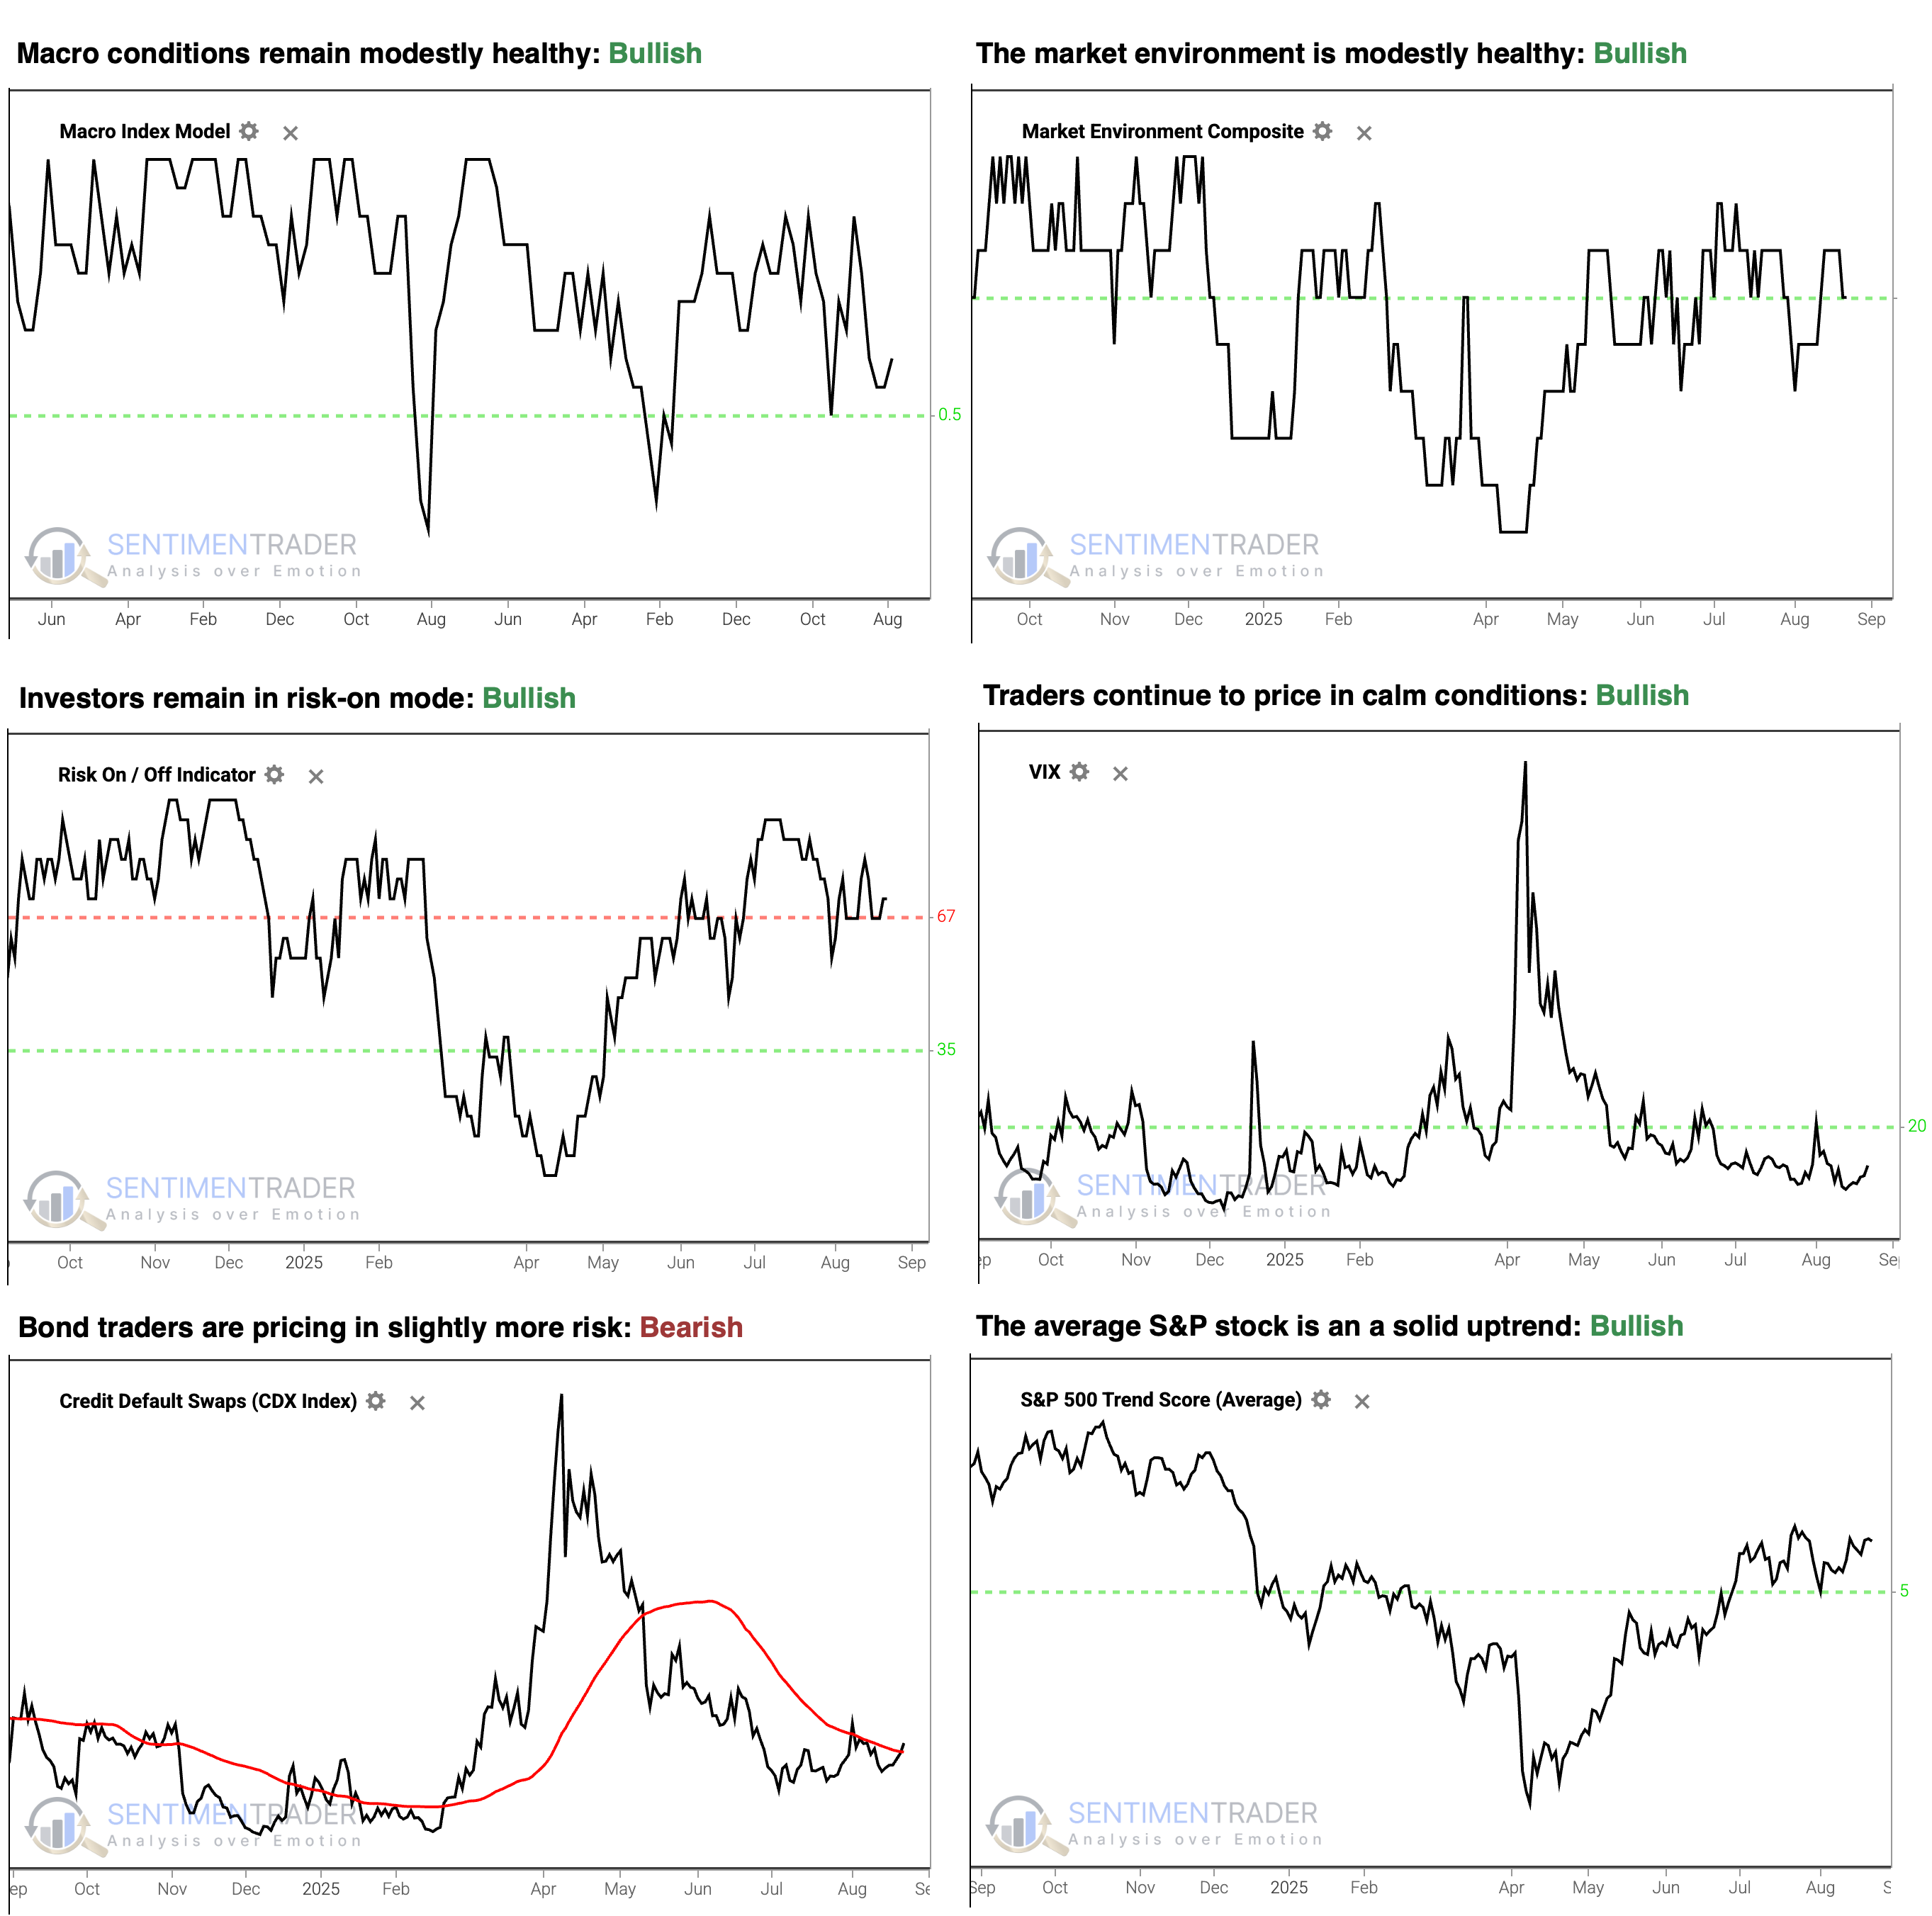
- The Macro Index Model is above the 50% threshold, which has been a vital level as outlined here.
- The Market Environment has been skittish since April, but is currently healthy. Future returns, especially for higher-beta indices, has been markedly better, with less risk, when the environment is healthy as outlined here.
- The Risk On / Off Indicator shows that investors are still in risk-on mode. This has been a good sign for future returns as outlined here.
- Implied volatility remains below 20, showing a calm environment. The S&P 500 has perfomed well when this is the case as outlined here.
- Credit default swap spreads are above their 50-day moving average, which is modestly concerning as outlined here.
- A composite of trend measures in SPY and the average S&P 500 stock remain above 5, which show healthy trend conditions.
Since April, the most compelling studies have had a strongly bullish bias on longer time frames. You can follow these through the Active Studies page. From time to time, when the analysts' studies provide an overwhelming message, it will override the charts above, but there has been no consensus in the studies to suggest overriding the bullish environment.
Other major markets have been mostly rangebound for four months, and there is little among what we follow to suggest a compelling edge either way.
What we covered this week
Big breadth back-to-back
After a rocky start to last week, buyers came back in a big way, and across the market.
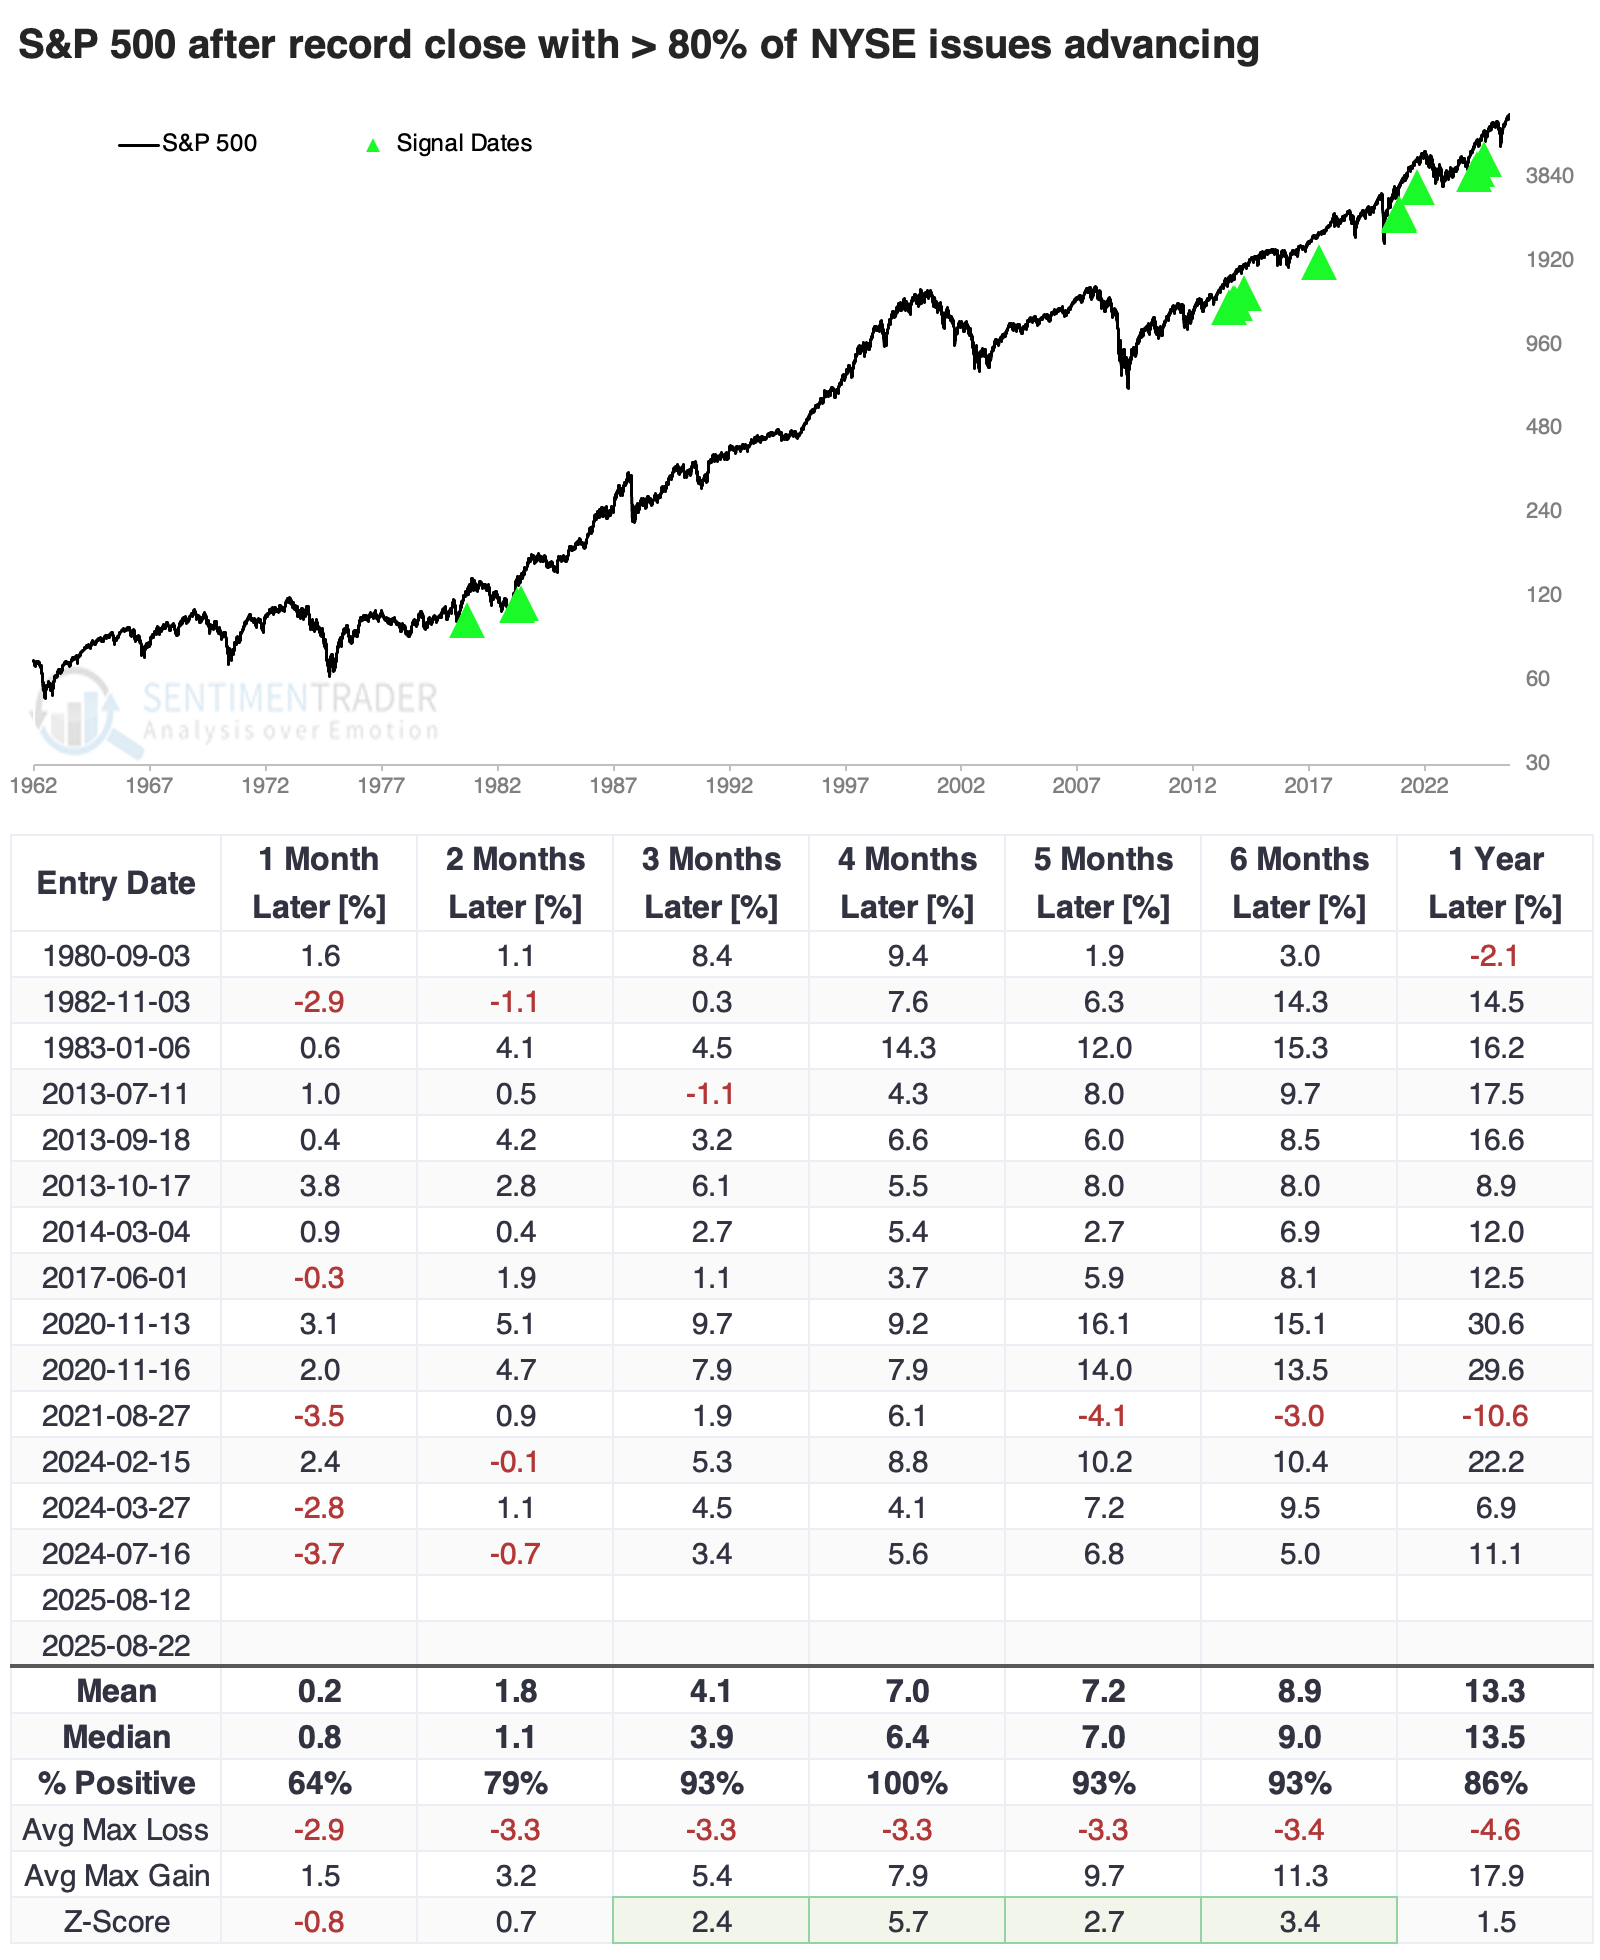
The Russell 2000 had a couple of very good days, driven by a broad rally among smaller stocks. That directly translated into back-to-back days with more than 75% of advancing issues on the NYSE.
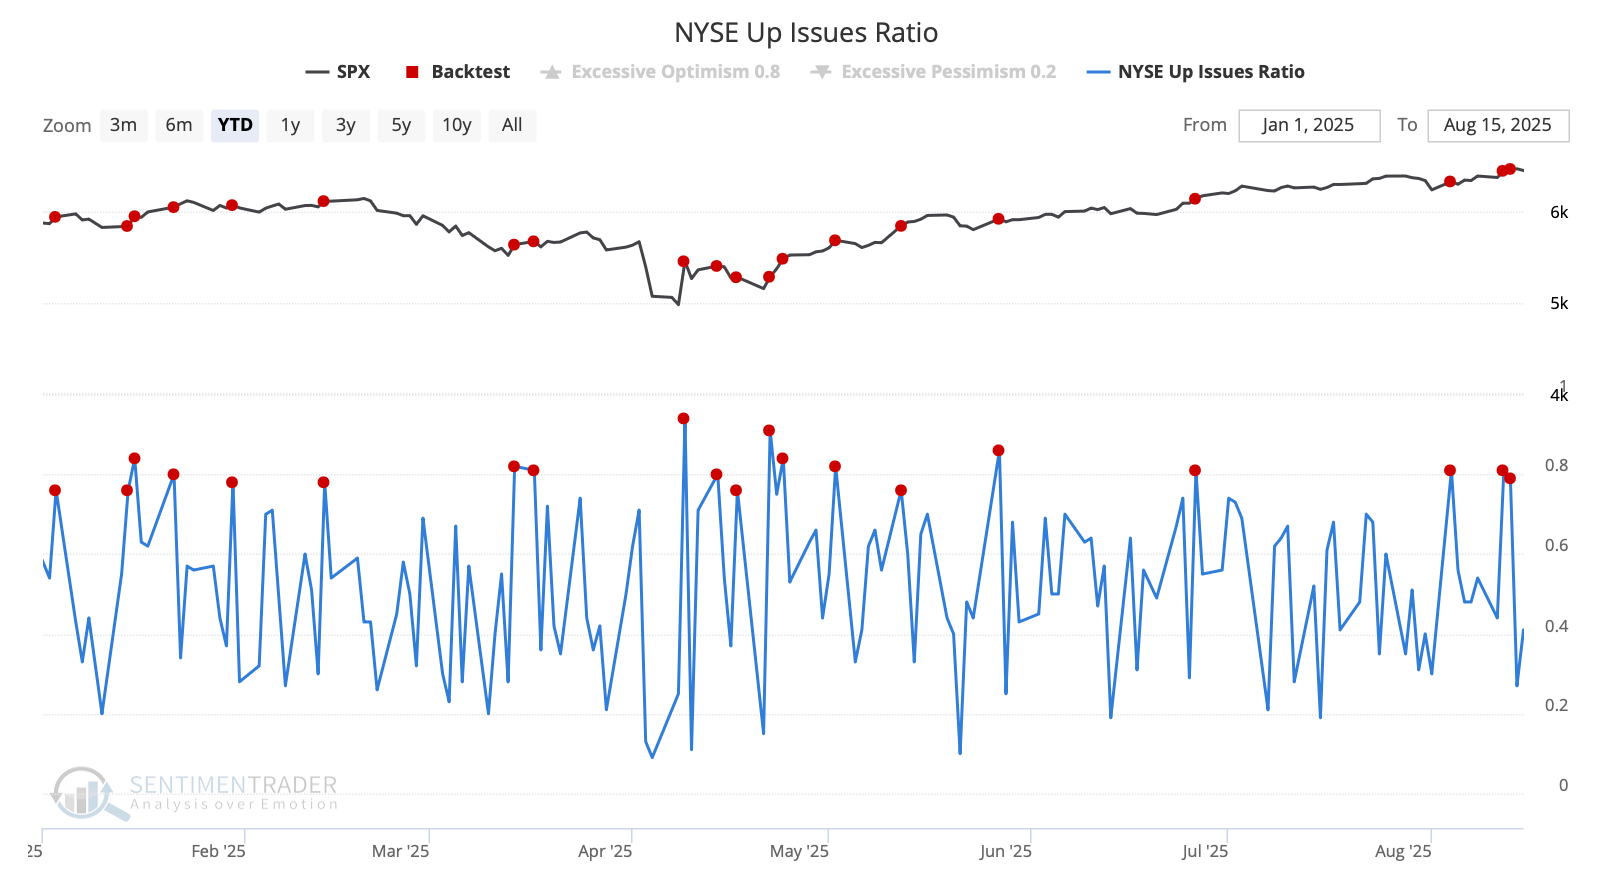
When the S&P was at a multi-year high at the same time there were consecutive sessions with at least 75% of issues advancing on the NYSE, they were all bullish. For the following six months, so were instances of even 70% up days.
One exception has been Berkshire Hathaway. For one of the few times in more than 45 years, the ratio of that stock to the S&P 500 has plunged more than 20% over the past 90 sessions.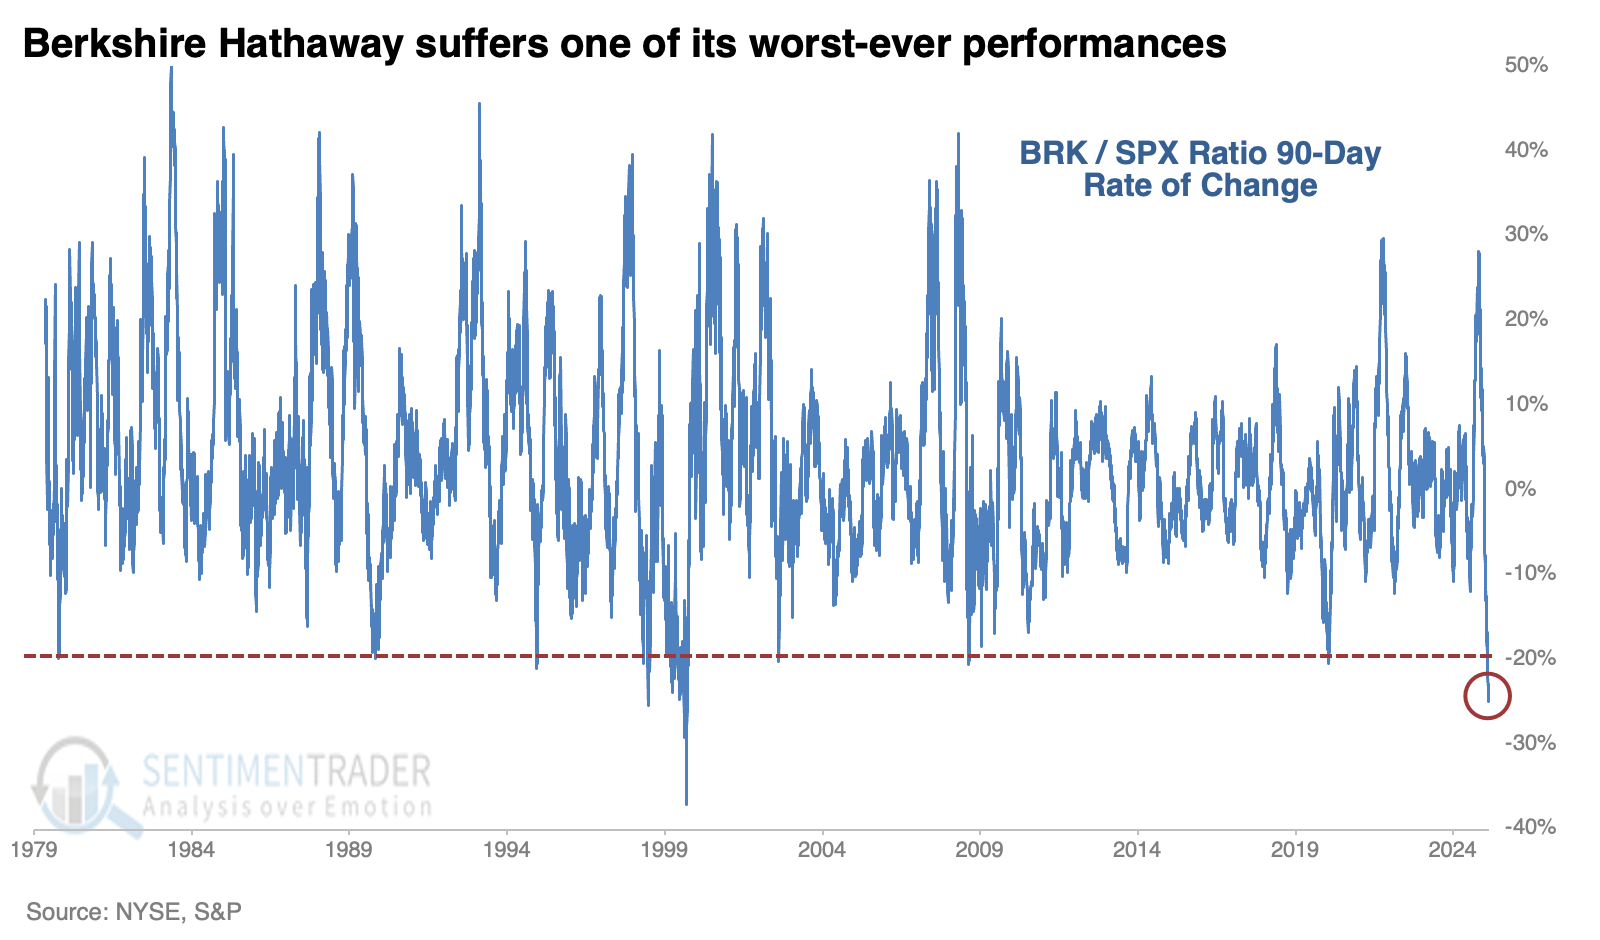
Even after Berkshire's extreme underperformance in 1999, the S&P continued to rally for months on end. That was the case after each of the other instances, as well.
Asia-Pacific has been doing great
From Seoul to Sydney, Asia Pacific stocks are staging a remarkable comeback.
For the first time since 2021, every single MSCI Asia-Pacific country index is now trading above its 200-day average. When over 95% of Asia-Pacific countries exceeded their 200-day averages, the MSCI Asia-Pacific index has historically delivered an impressive 29% annualized return.
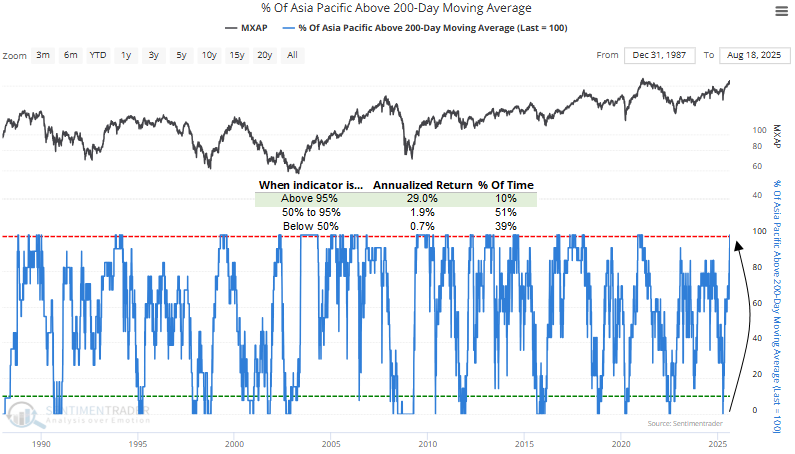
Similar shifts in long-term participation trends across Asia-Pacific markets have historically set the stage for a regional benchmark index to advance, with positive returns observed roughly 80% of the time over the subsequent six and twelve months.
Speculative excess...kind of
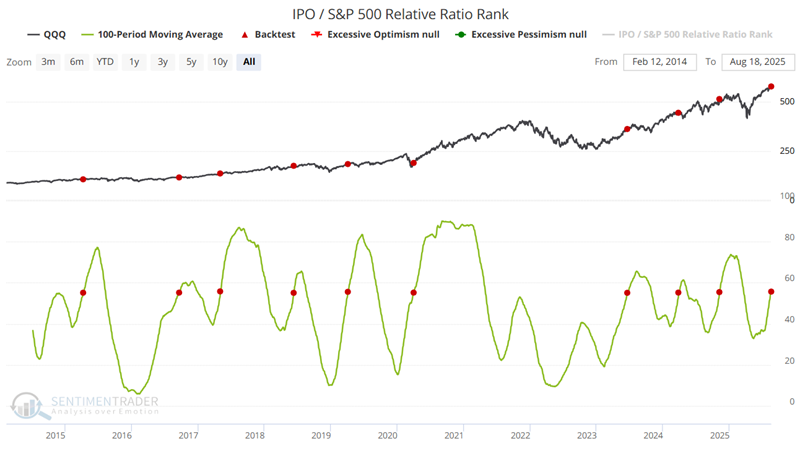
Soaring stock prices of money-losing companies. Massive first-day jumps of IPO shares. Heavy flows into leveraged ETFs. Record margin debt. The signs of speculative excess are percolating.
The best source we've found helpful over the years is monitoring the activity of the smallest options traders. We usually start by looking at one of the purest measures, which is how much of their volume the smallest options traders concentrate on buying call options as an opening transaction. Over the past 20 years, there have been few weeks when it has been higher, though in 2021 it was significantly so, and for a long time.
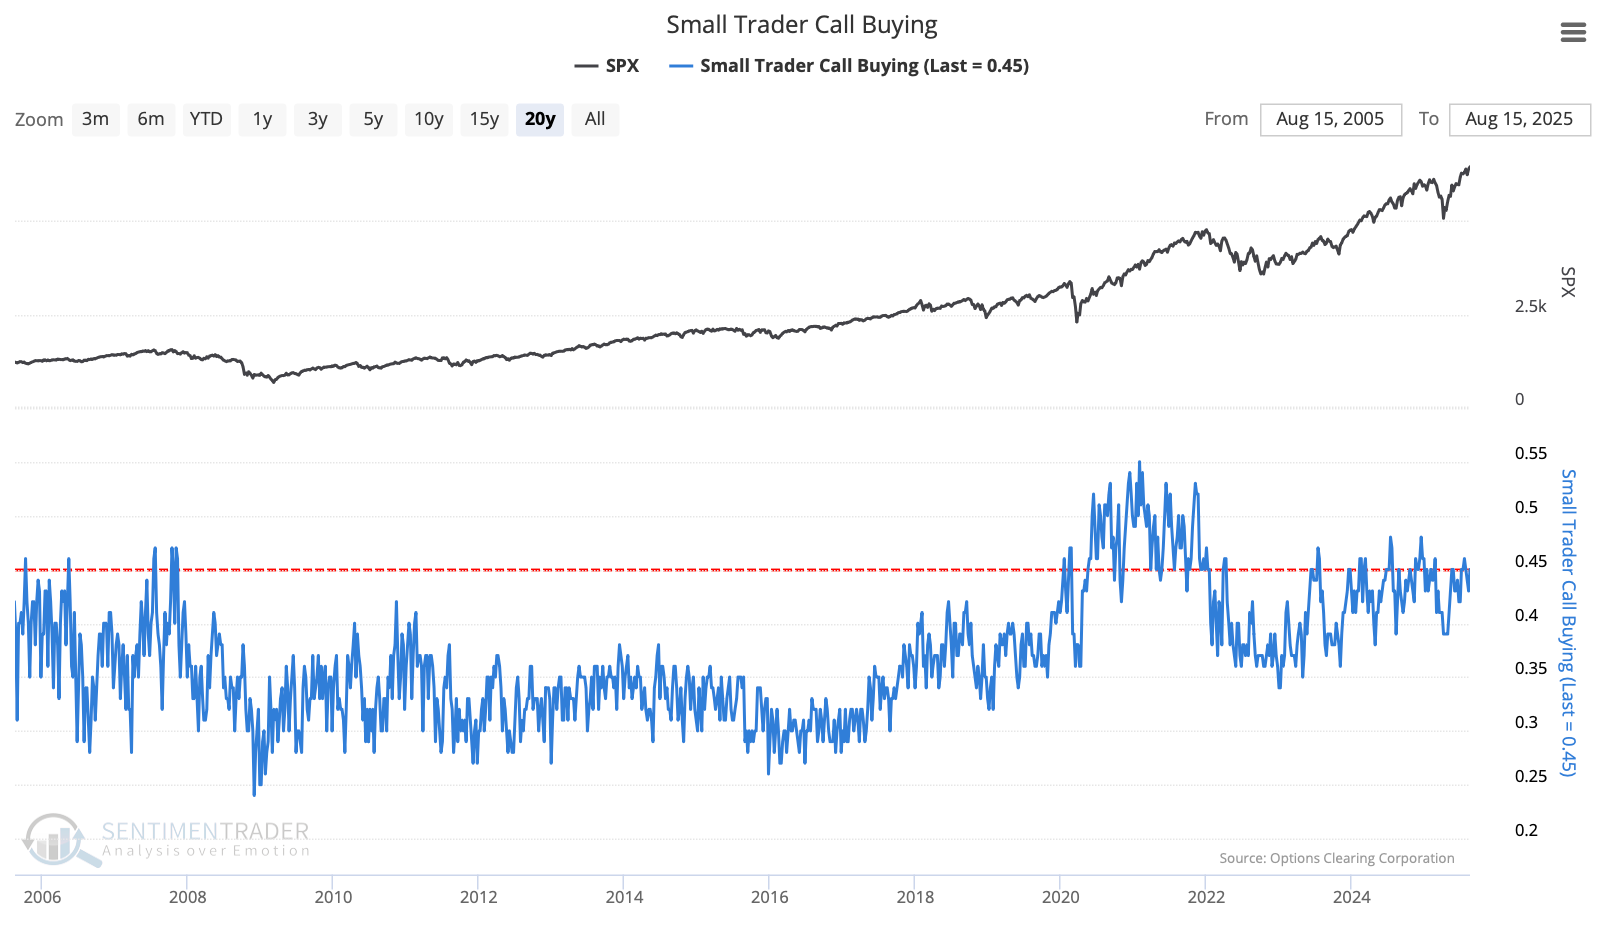
The other side of call option buying is put option buying by this same cohort of traders. These are direct bets on a declining market. Lo and behold, this activity is also high, meaning that many of these traders are also, or alternatively, betting on a market drop.
Overall, the message from this group of traders is that speculative activity is high, but well below that of 2021.
Staples vs. the S&P 500
The S&P 500 index is far outpacing one of its most defensive sectors, consumer staples. Conventional wisdom suggests this is a good sign of risk-on behavior. The truth has been, well, a little more complicated.
For testing purposes, we use the S&P 500 Index (SPXT) to track the broader stock market and the S&P 500s (SPCS) to track the consumer staples sector. Subtracting the ratio from its 200-day average can give us a sense of the long-term trend. The standard theory is that readings above zero are considered favorable, and readings below zero are deemed unfavorable.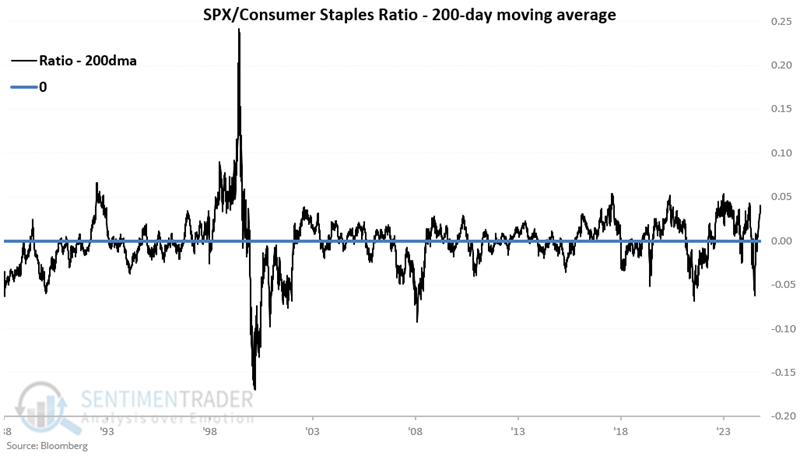
First, let's look at S&P 500 performance when the SPXT/SPCS ratio was above its 200-day average. From October 1988 through July 2025, the S&P 500 gained 777%, but showed a gain during only 46% of those years. The saving grace was that the average gain of 5.2% was four times greater than the average loss of 1.3%.
The most significant bear markets during the test period (2000-2002, 2007-2009, and 2022) occurred when the SPXT/SPCS ratio was below its 200-day average. However, the stock market did just fine the rest of the time, sporting a sizeable 464% gain overall.
Oil vs. gold vs. stocks
Gold is the most followed commodity in the world, with some referring to it as the ultimate store of value. Meanwhile, others refer to crude oil as the most essential commodity in the world. Whatever the assertions, the two have an interesting relationship.
The WTI/Gold Ratio measures the ratio between West Texas Intermediate crude oil and gold prices. The stock market appears to like cheap energy. When the WTI/Gold Ratio was 0.037 or lower, the S&P 500 witnessed solid win rates and median returns across the board, with a median return greater than 20% a year later.
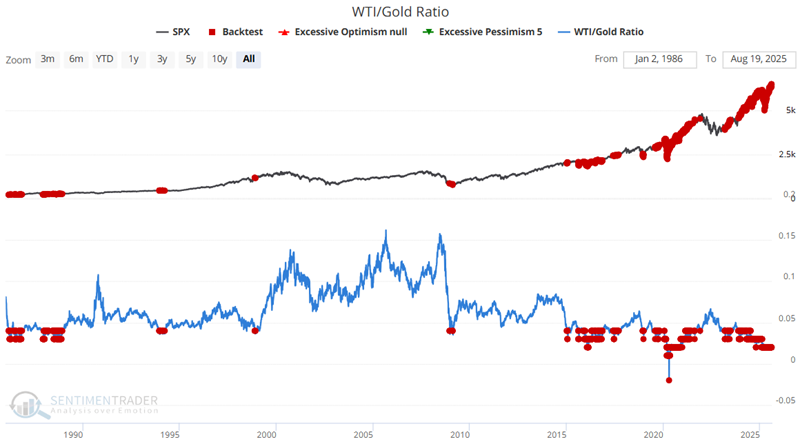
Conversely, the WTI/Gold Ratio has been above 0.137 only a handful of times, including in 2000, 2005, and 2008. The signals were clustered during those periods, and the S&P's returns were poor.
Intraday Minutes
In the "unofficial" stream of intraday minutes, we looked at how breadth surged with more than 80% advancing issues on the NYSE with a record S&P 500 close.
That completely reversed the day earlier when QQQ suffered 5 straight down days from a multi-year high.
The prices of recent IPOs have been outpacing the gains in the broader market.
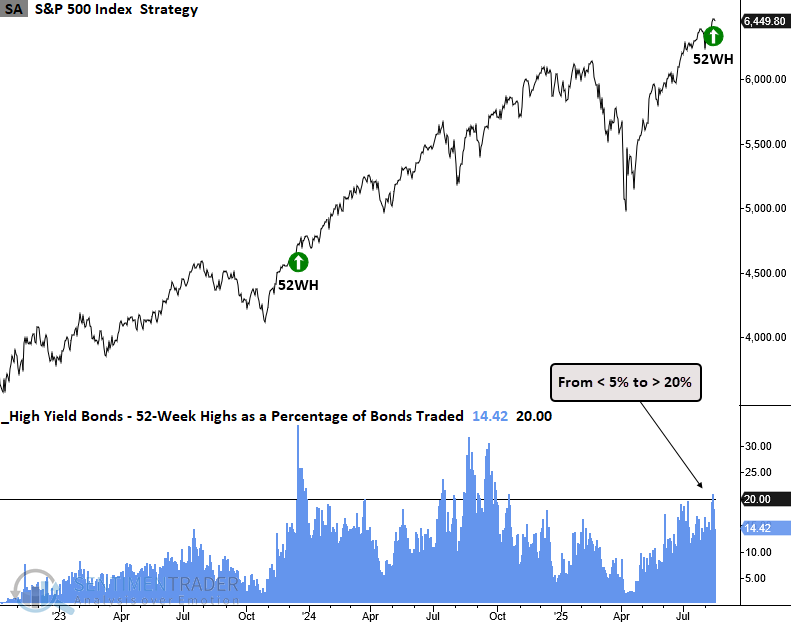
There have been many new highs among high-yield bonds.
We also looked at rising risk appetite.
About TradingEdge Weekly...
The goal of TradingEdge Weekly is to summarize some of the research published to SentimenTrader over the past week. Sometimes there is a lot to digest, and this summary highlights the highest conviction or most compelling ideas we discussed. This is NOT the published research; rather, it pulls out some of the most relevant parts. It includes links to the published research for convenience, and if you don't subscribe to those products, it will present the options for access.