
A trend-following system triggered a buy signal for Bitcoin

Key points:
- An overwhelming number of trend-following indicators for Bitcoin have shifted to a favorable condition
- A system that uses the new trend and relative trend indicators triggered a buy signal for the cryptocurrency
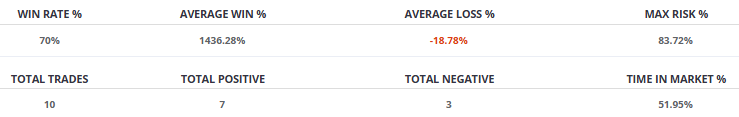
- Similar trend signals led to an average Bitcoin gain of 1,436%, whereas losses averaged -18.78%
Trend-following indicators for Bitcoin shift to a bullish profile
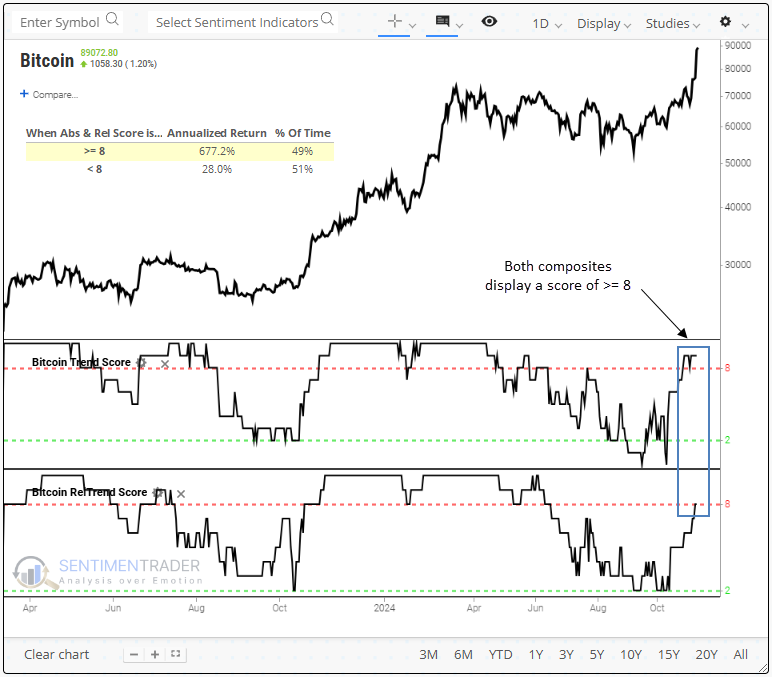
In a recent report, I highlighted a bull regime shift in Bitcoin's Relative Strength Index (RSI), suggesting additional upside price action. Bitcoin surged decisively after the election, lifting its relative trend score to 8, while its absolute trend score held firm at 9, solidifying a favorable trend backdrop for the digital currency.
When the trend and relative trend composite scores hold at eight or above, Bitcoin has generated a remarkable 677% annualized return, significantly outpacing the 28% annualized gain when both indicators reside below that level.
Although indicator thresholds hint at an asset's direction, formulating entry and exit signals is essential for assessing risk versus reward-a task we can accomplish effectively using our backtest engine.
With the new trend and relative trend score indicators added to the website and the multi-condition criteria functionality in Backtest Engine v2.0, users can now build sophisticated trend-following systems like the one I'll showcase in this report.
Entry and exit criteria for the Bitcoin trend system
The Bitcoin trend system can be easily created in the Backtest Engine using the multi-condition function. Here's the entry and exit criteria.
Entry Conditions:
- Bitcoin Trend Score > 7
- Bitcoin Relative Trend Score > 7
- Bitcoin closed at a 10-day high
Exit Conditions:
- Bitcoin Trend Score falls below 5
- Bitcoin Relative Trend Score falls below 5
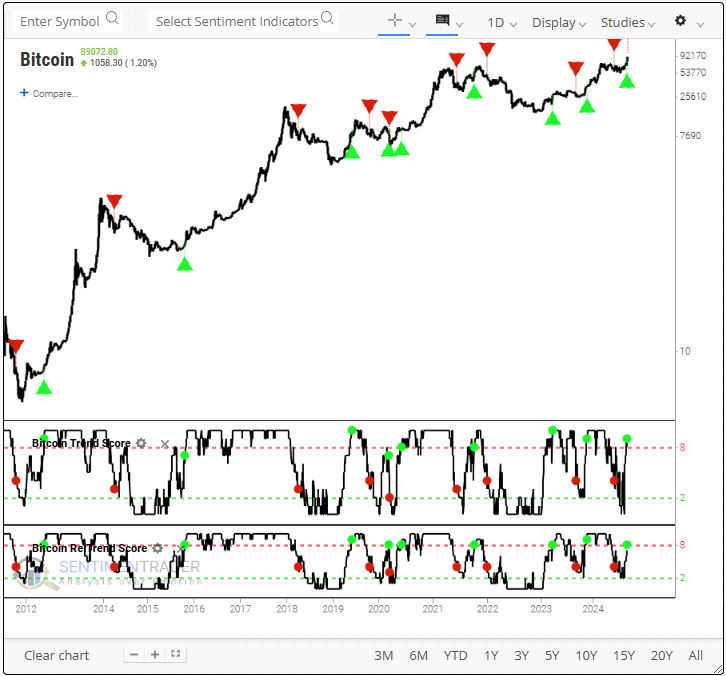
The following chart illustrates the buy and sell signals. Entry conditions require simultaneous triggers, whereas exit conditions act independently. If you want to add the Bitcoin system to your favorites folder in the Backtest Engine, click here.
Similar composite trend score signals produced a bullish outlook for Bitcoin
Since 2011, the trend score system has generated ten buy signals with a 70% success rate, achieving an average gain of 1436.28% per win, while losses averaged -18.78%.
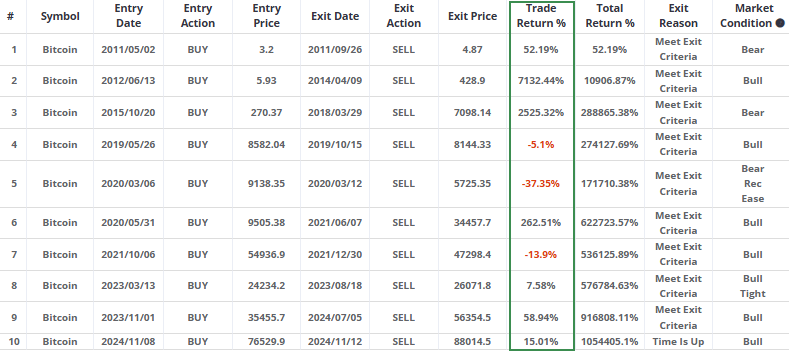
The following table provides each signal's entry and exit dates and the resulting profit or loss. A -37.35% loss in 2020 exemplifies how trend-following systems with long-term indicators are susceptible to significant drawdowns, given their tendency to respond more slowly to price fluctuations. That's especially the case with a risky asset like Bitcoin.
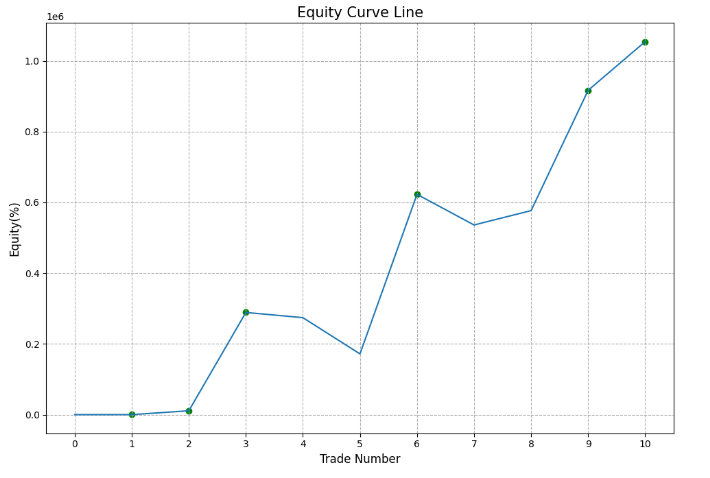
The equity curve visually represents a system's performance over time, offering insight into its effectiveness. Ideally, the curve should rise steadily from the lower left to the upper right, a standard the Bitcoin trend system has generally achieved.
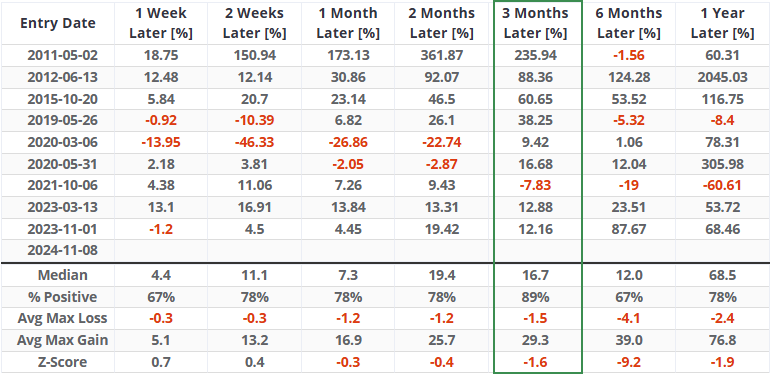
Although the system utilizes the trend scores for its exit criteria, an analysis of time intervals reveals that the entry signals have consistently led to a highly favorable outlook over the following three months, with Bitcoin posting gains in all but one instance.
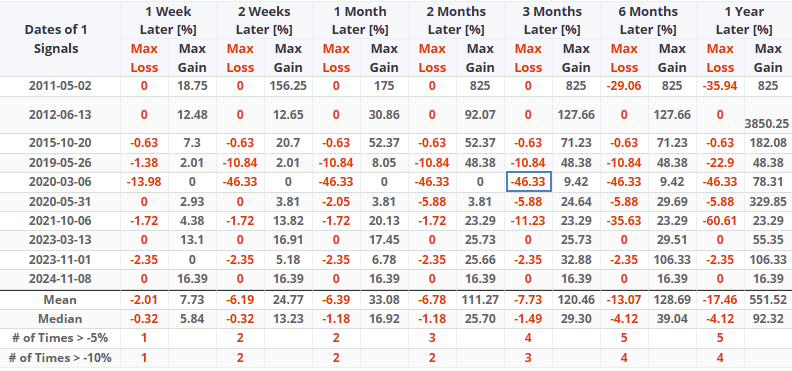
In the advantageous three-month time frame, Bitcoin recorded three maximum losses of more than 10%, the largest of which coincided with the extraordinary Covid crash. Remarkably, several precedents never experienced a loss.
What the research tells us...
A trend-following system utilizing our new trend and relative trend score composites triggered a buy signal for Bitcoin. Similar signals have yielded exceptionally favorable returns for the digital currency, capturing a significant portion of cyclical rallies while managing downside risk with strict exit criteria. The integration of these advanced trend indicators into our website, combined with our backtest engine's multi-entry and exit criteria capabilities, enables users to easily design systems like the one featured in today's note.