
Calm conditions make a comeback

Key points:
- For the 1st time in 30 days, the VIX "fear gauge" is below 20
- Stocks have performed significantly better when the VIX is below 20 than when it is above, with much less risk
- The ends of long streaks above 20 have been a relatively good sign, especially when the S&P 500 is above its 200-day average
The return of calm conditions
Investors don't like uncertainty. Uncertainty means volatility, and volatility increases the probability of seeing big negative numbers on account statements. When markets are calm, they're more likely to buy.
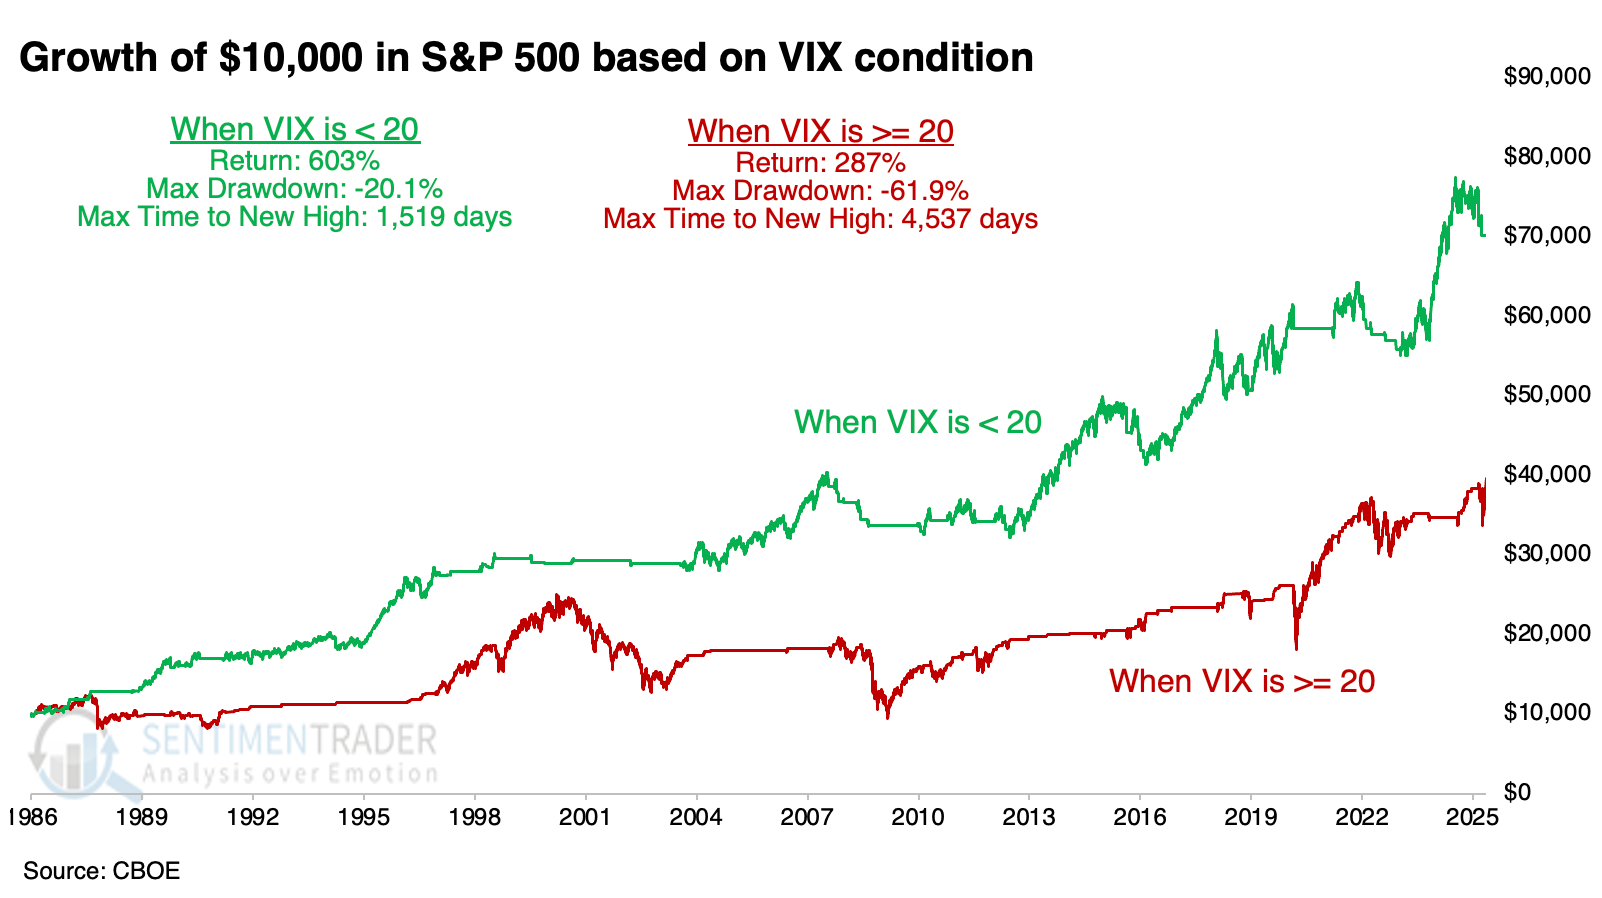
The chart below shows evidence of this. When the VIX "fear gauge" is below 20, the S&P 500 has fared much better using next-day returns than when the VIX is above that threshold. Its total return was more than twice as large, and most importantly, its drawdown (maximum loss from a peak) was less than a third as much.
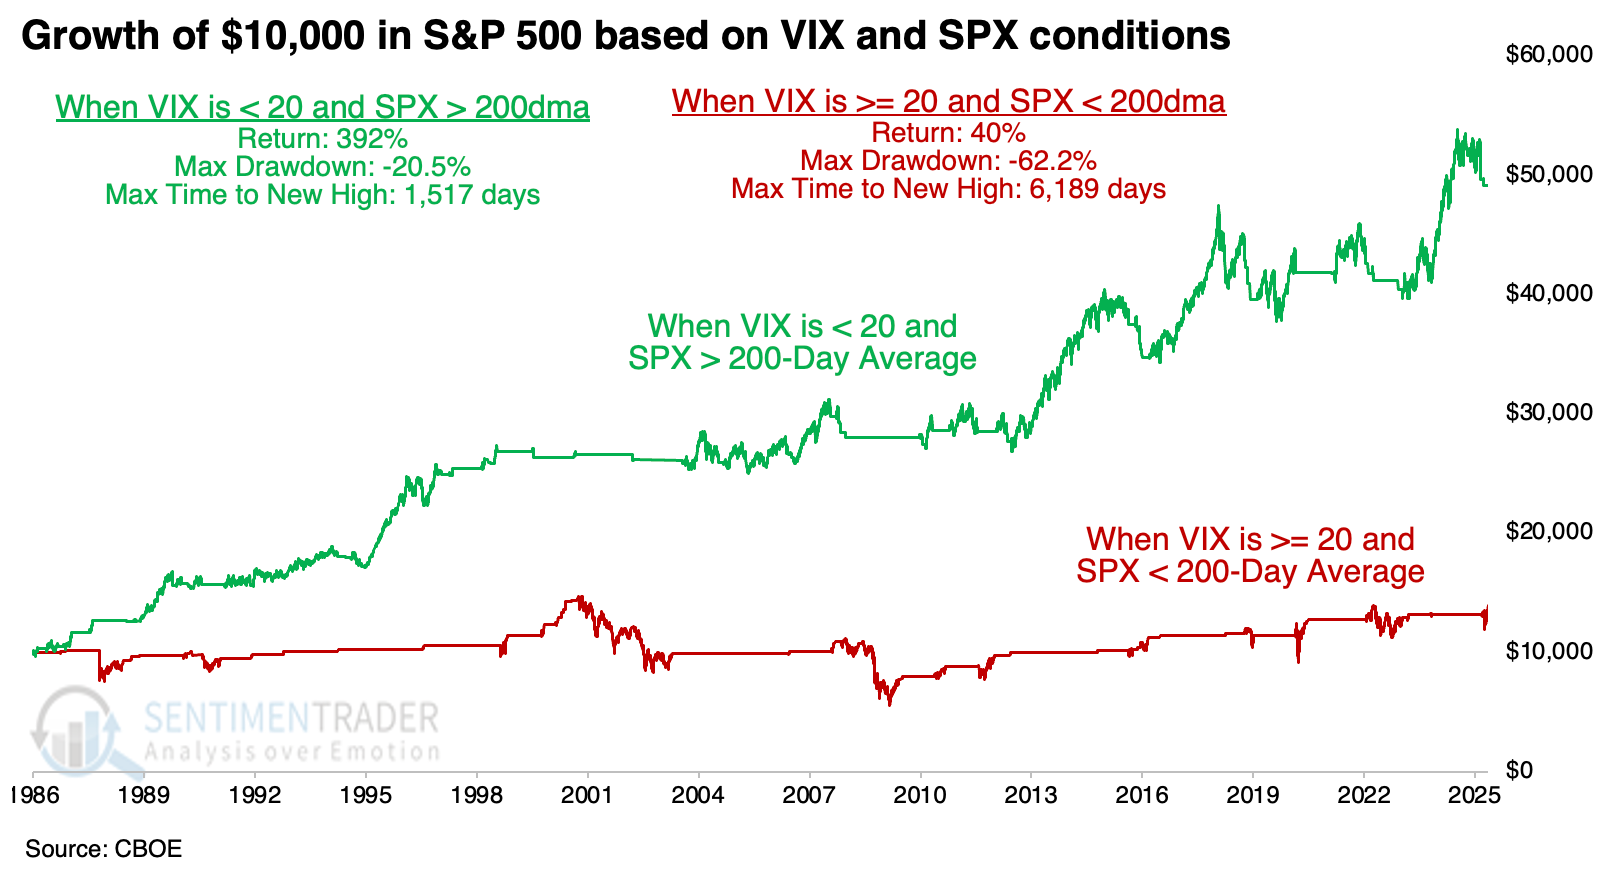
This should relieve investors because the VIX finally closed below 20 after Monday's rally. Not only that, but the S&P 500 climbed above its 200-day average. While waiting for both conditions reduced overall returns, if neither condition was in force - meaning the VIX was above 20 and the S&P was below its 200-day average - it proved a disastrous time to be an investor. The S&P's total return over 40 years was only 40%, and its drawdown exceeded -62%. Blech.
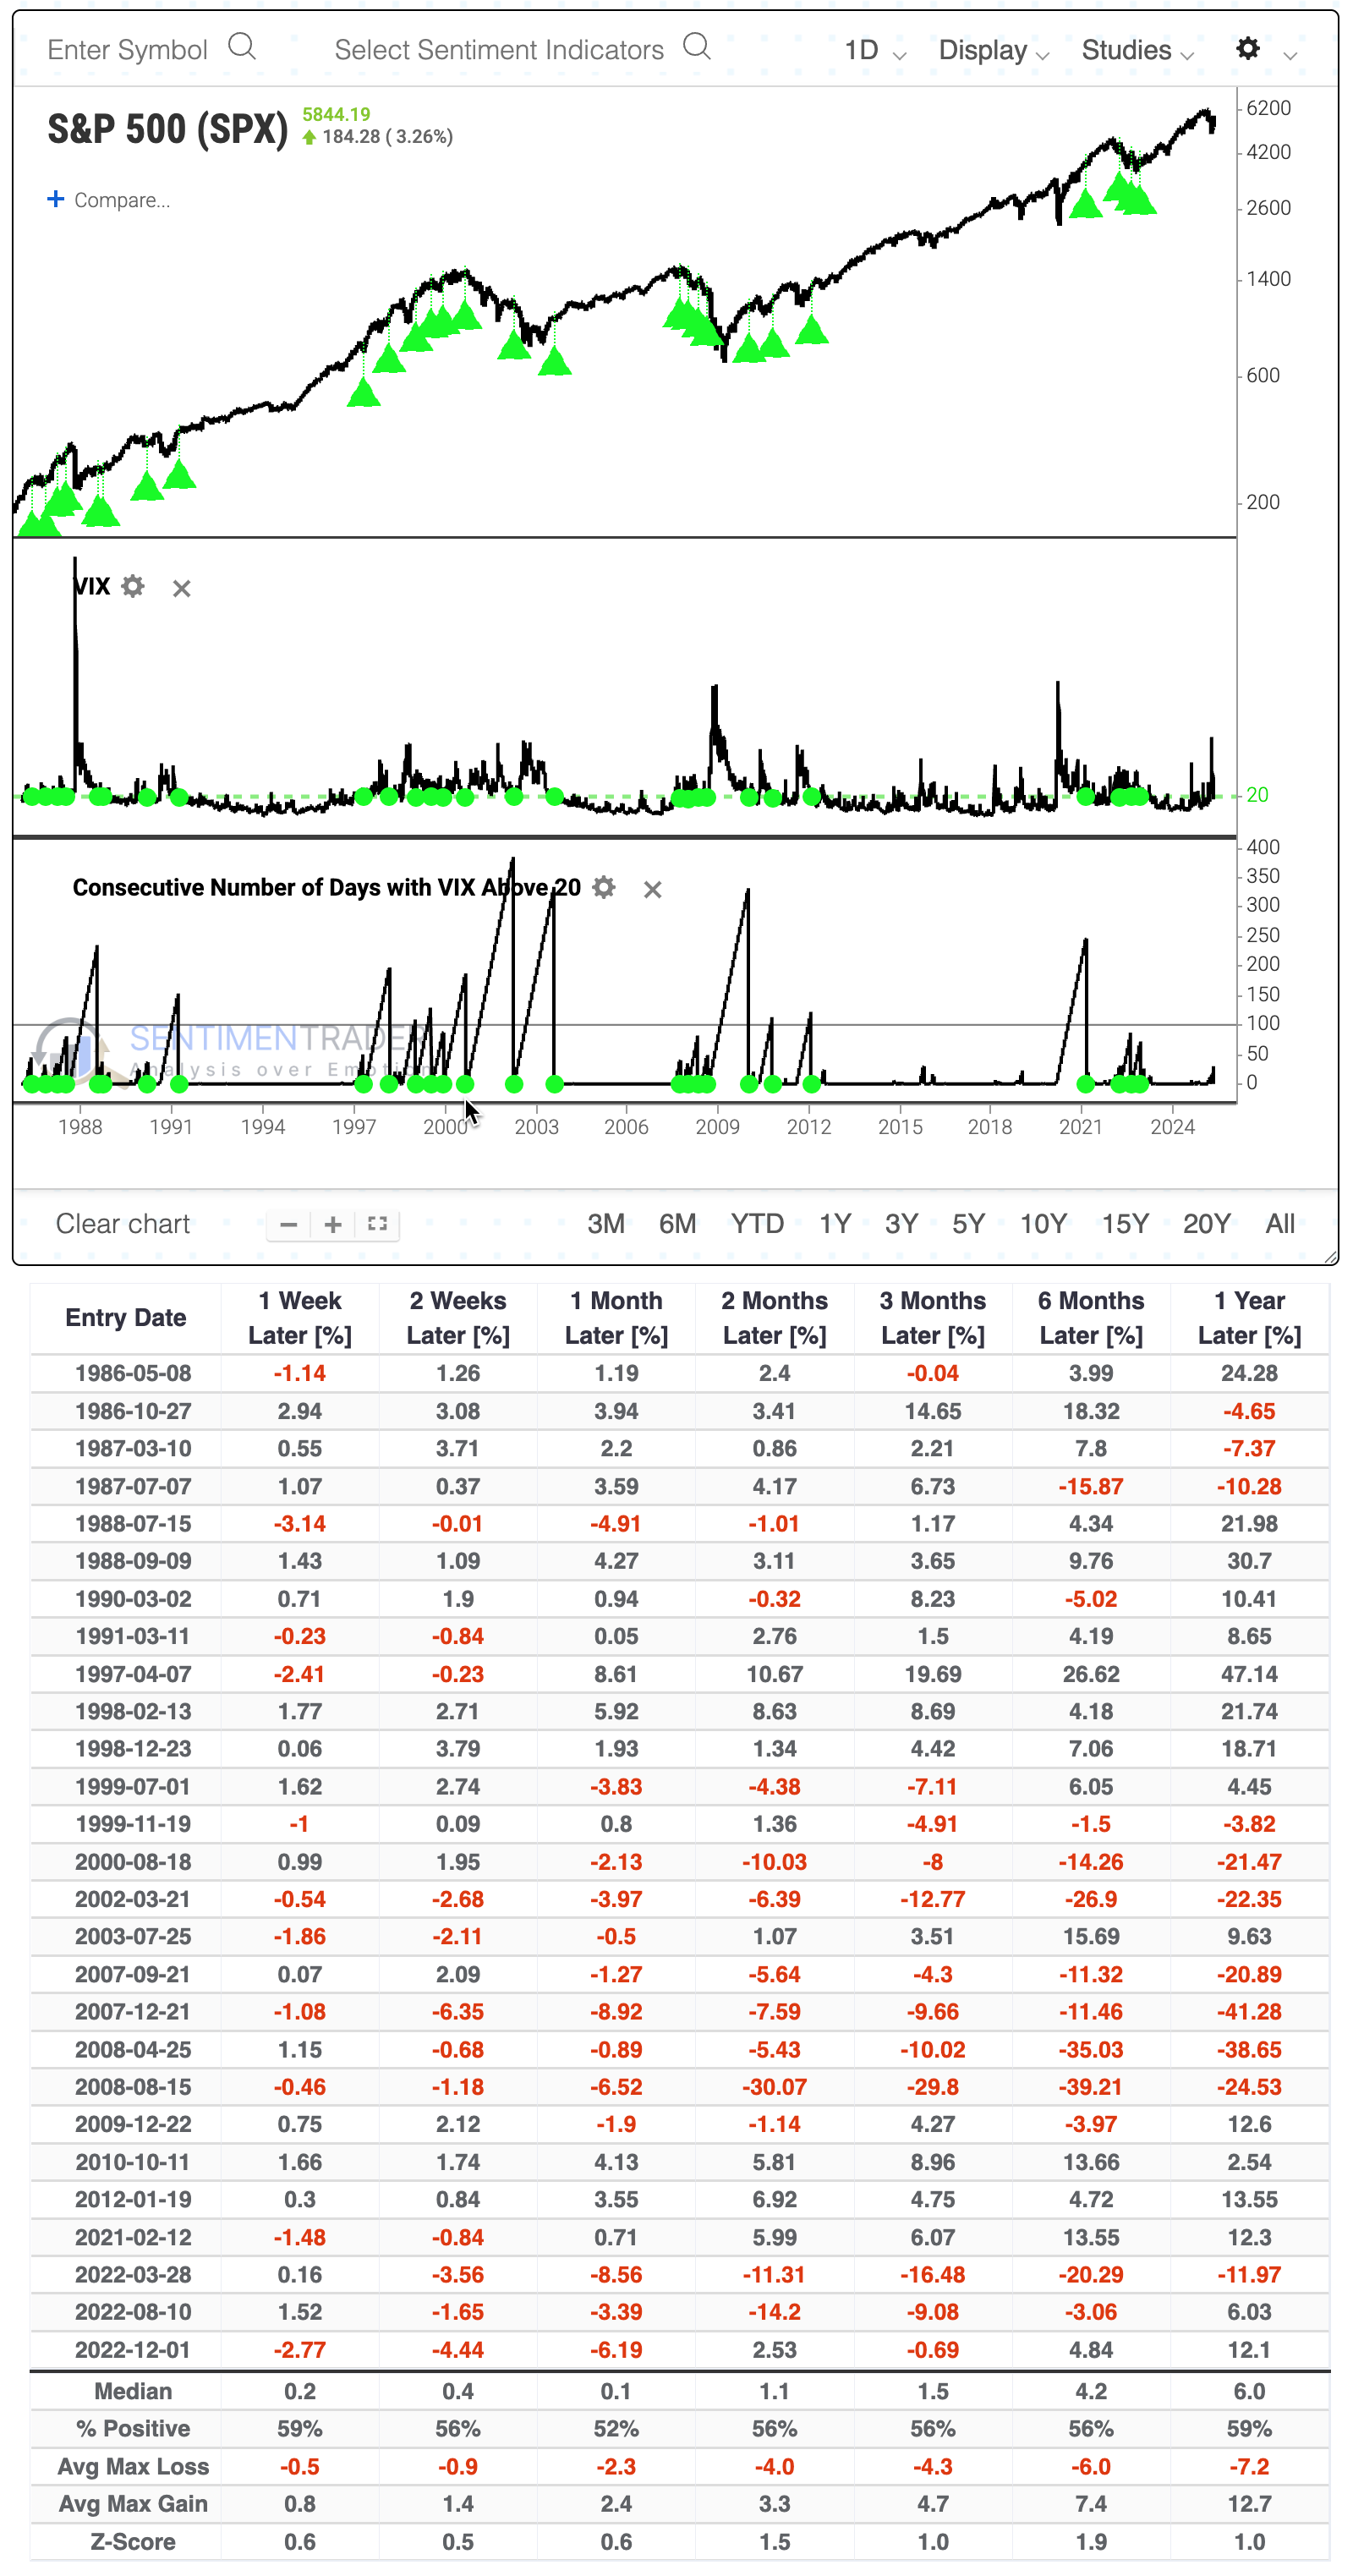
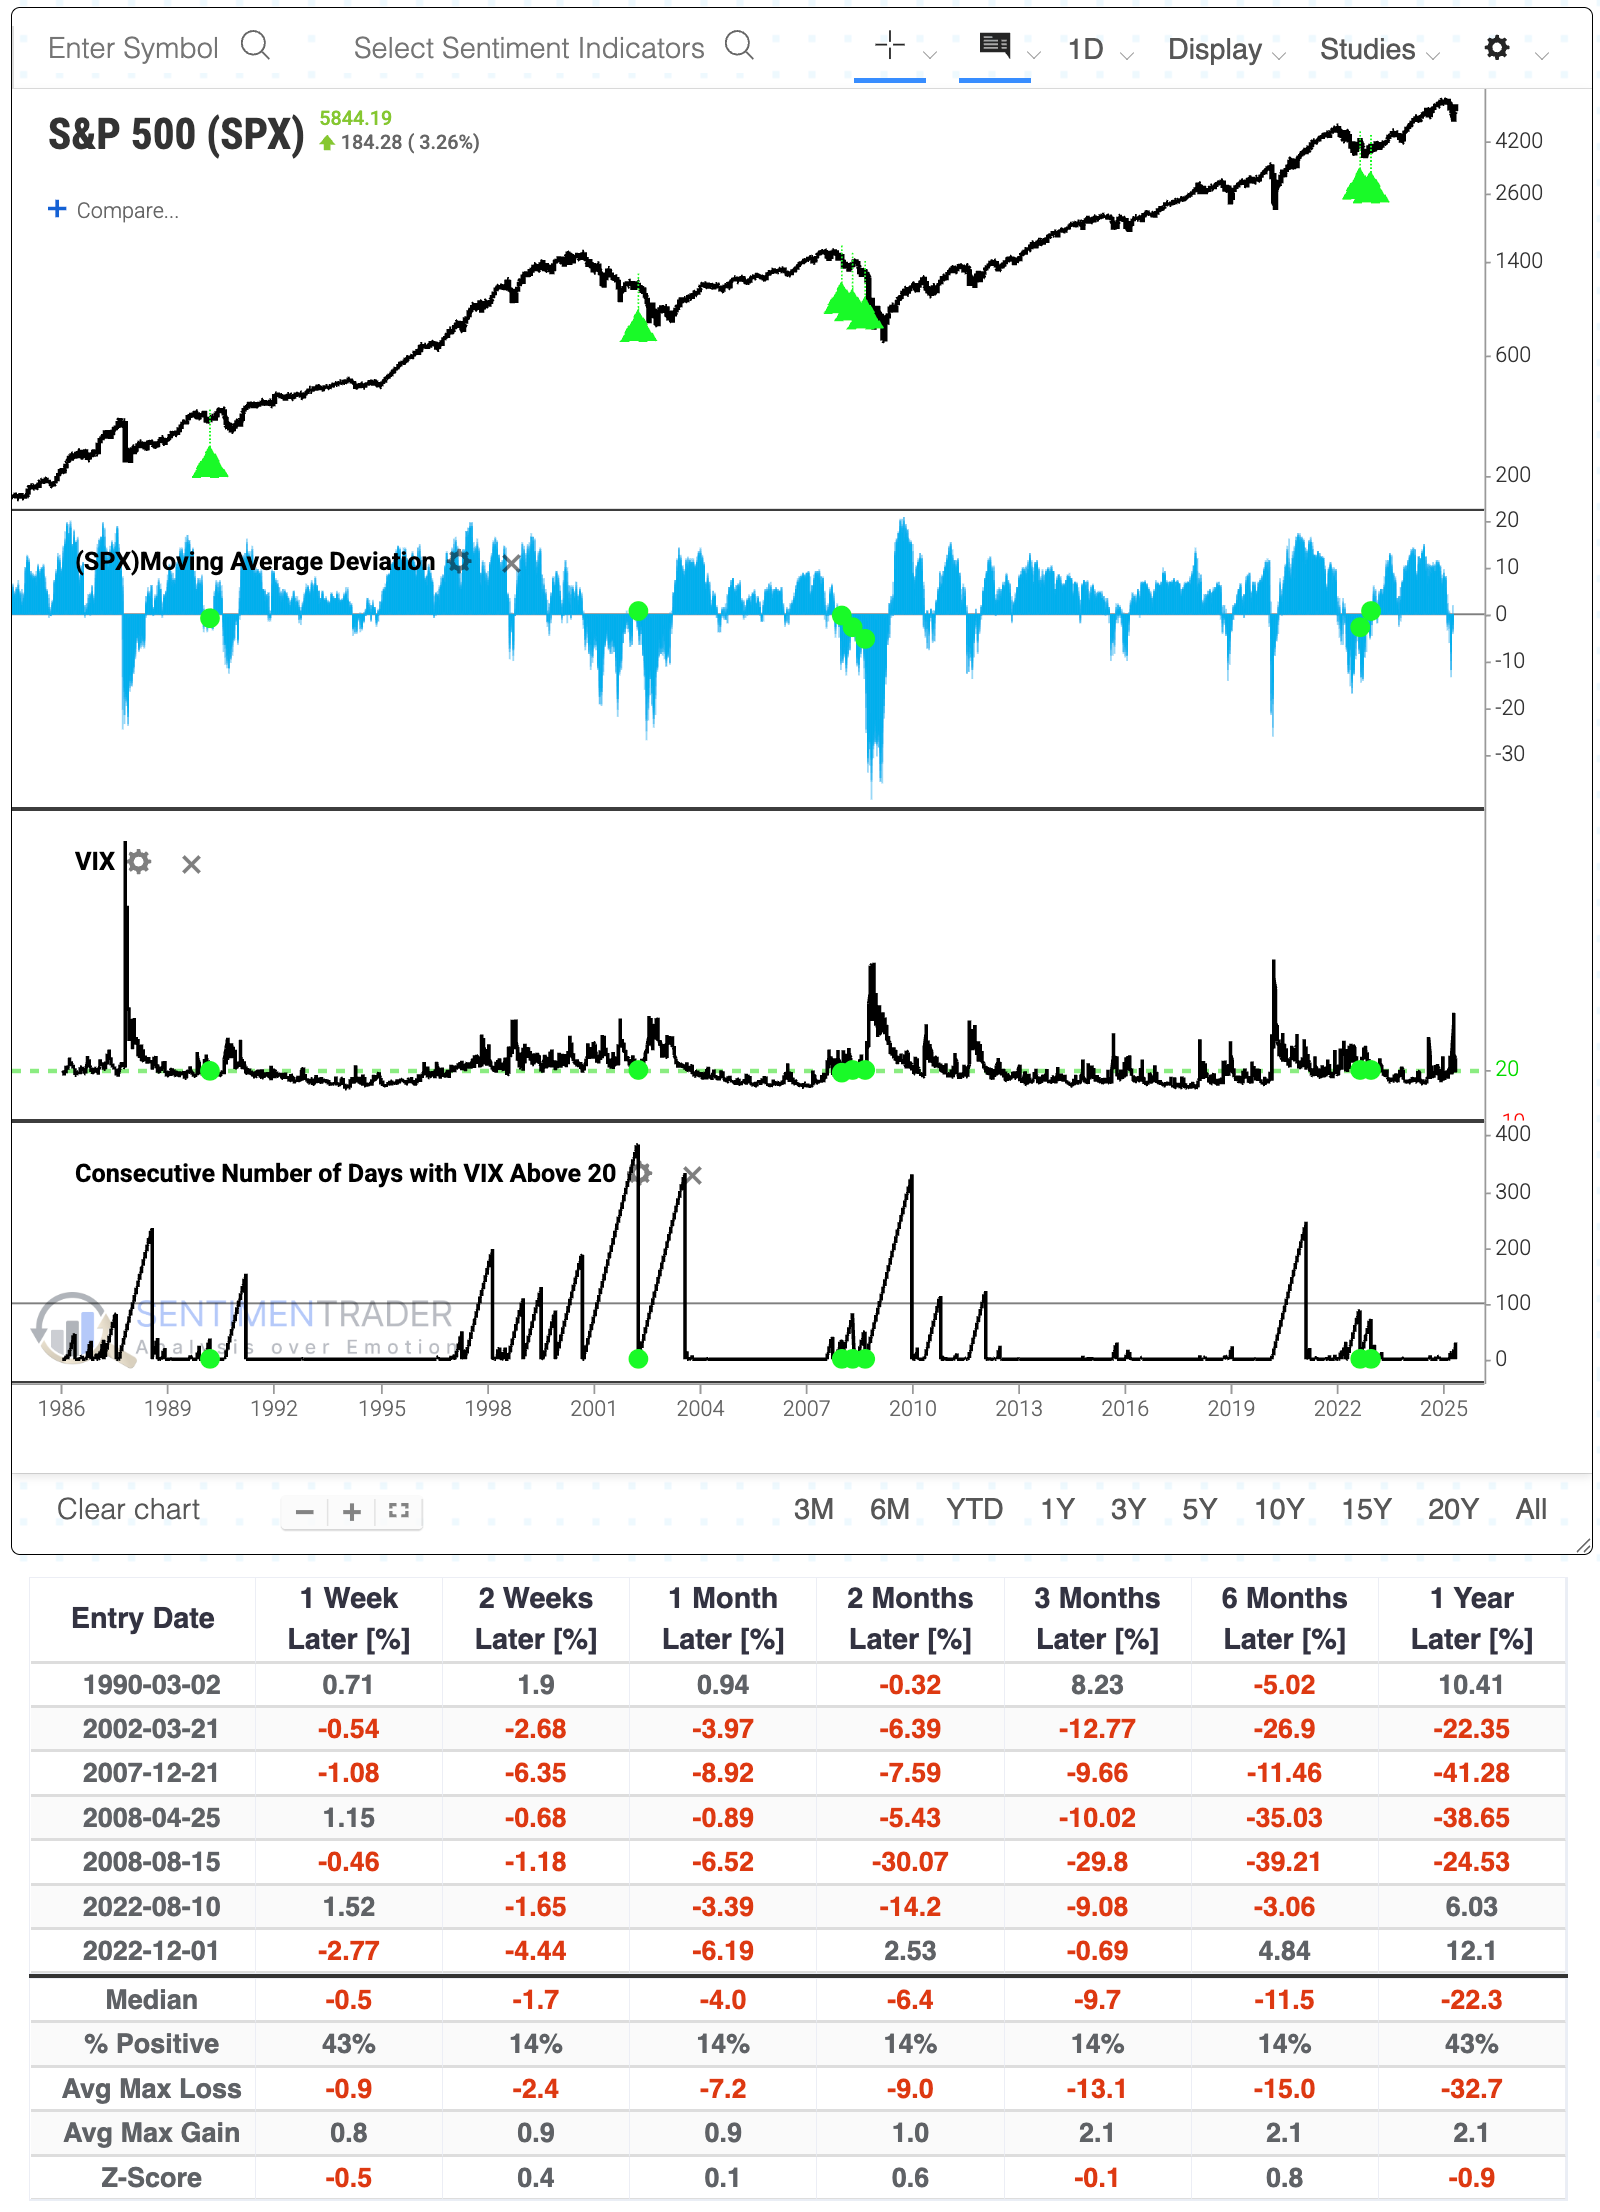
Using Backtest Engine 2.0, we can see how markets performed after the VIX finally closed below 20 after holding above it for at least 30 sessions (click here to load the test and then click the Run Backtest button).
Overall, it wasn't very impressive. The S&P 500 did okay following these signals, but its average returns across time frames were barely positive, and were positive barely half the time.
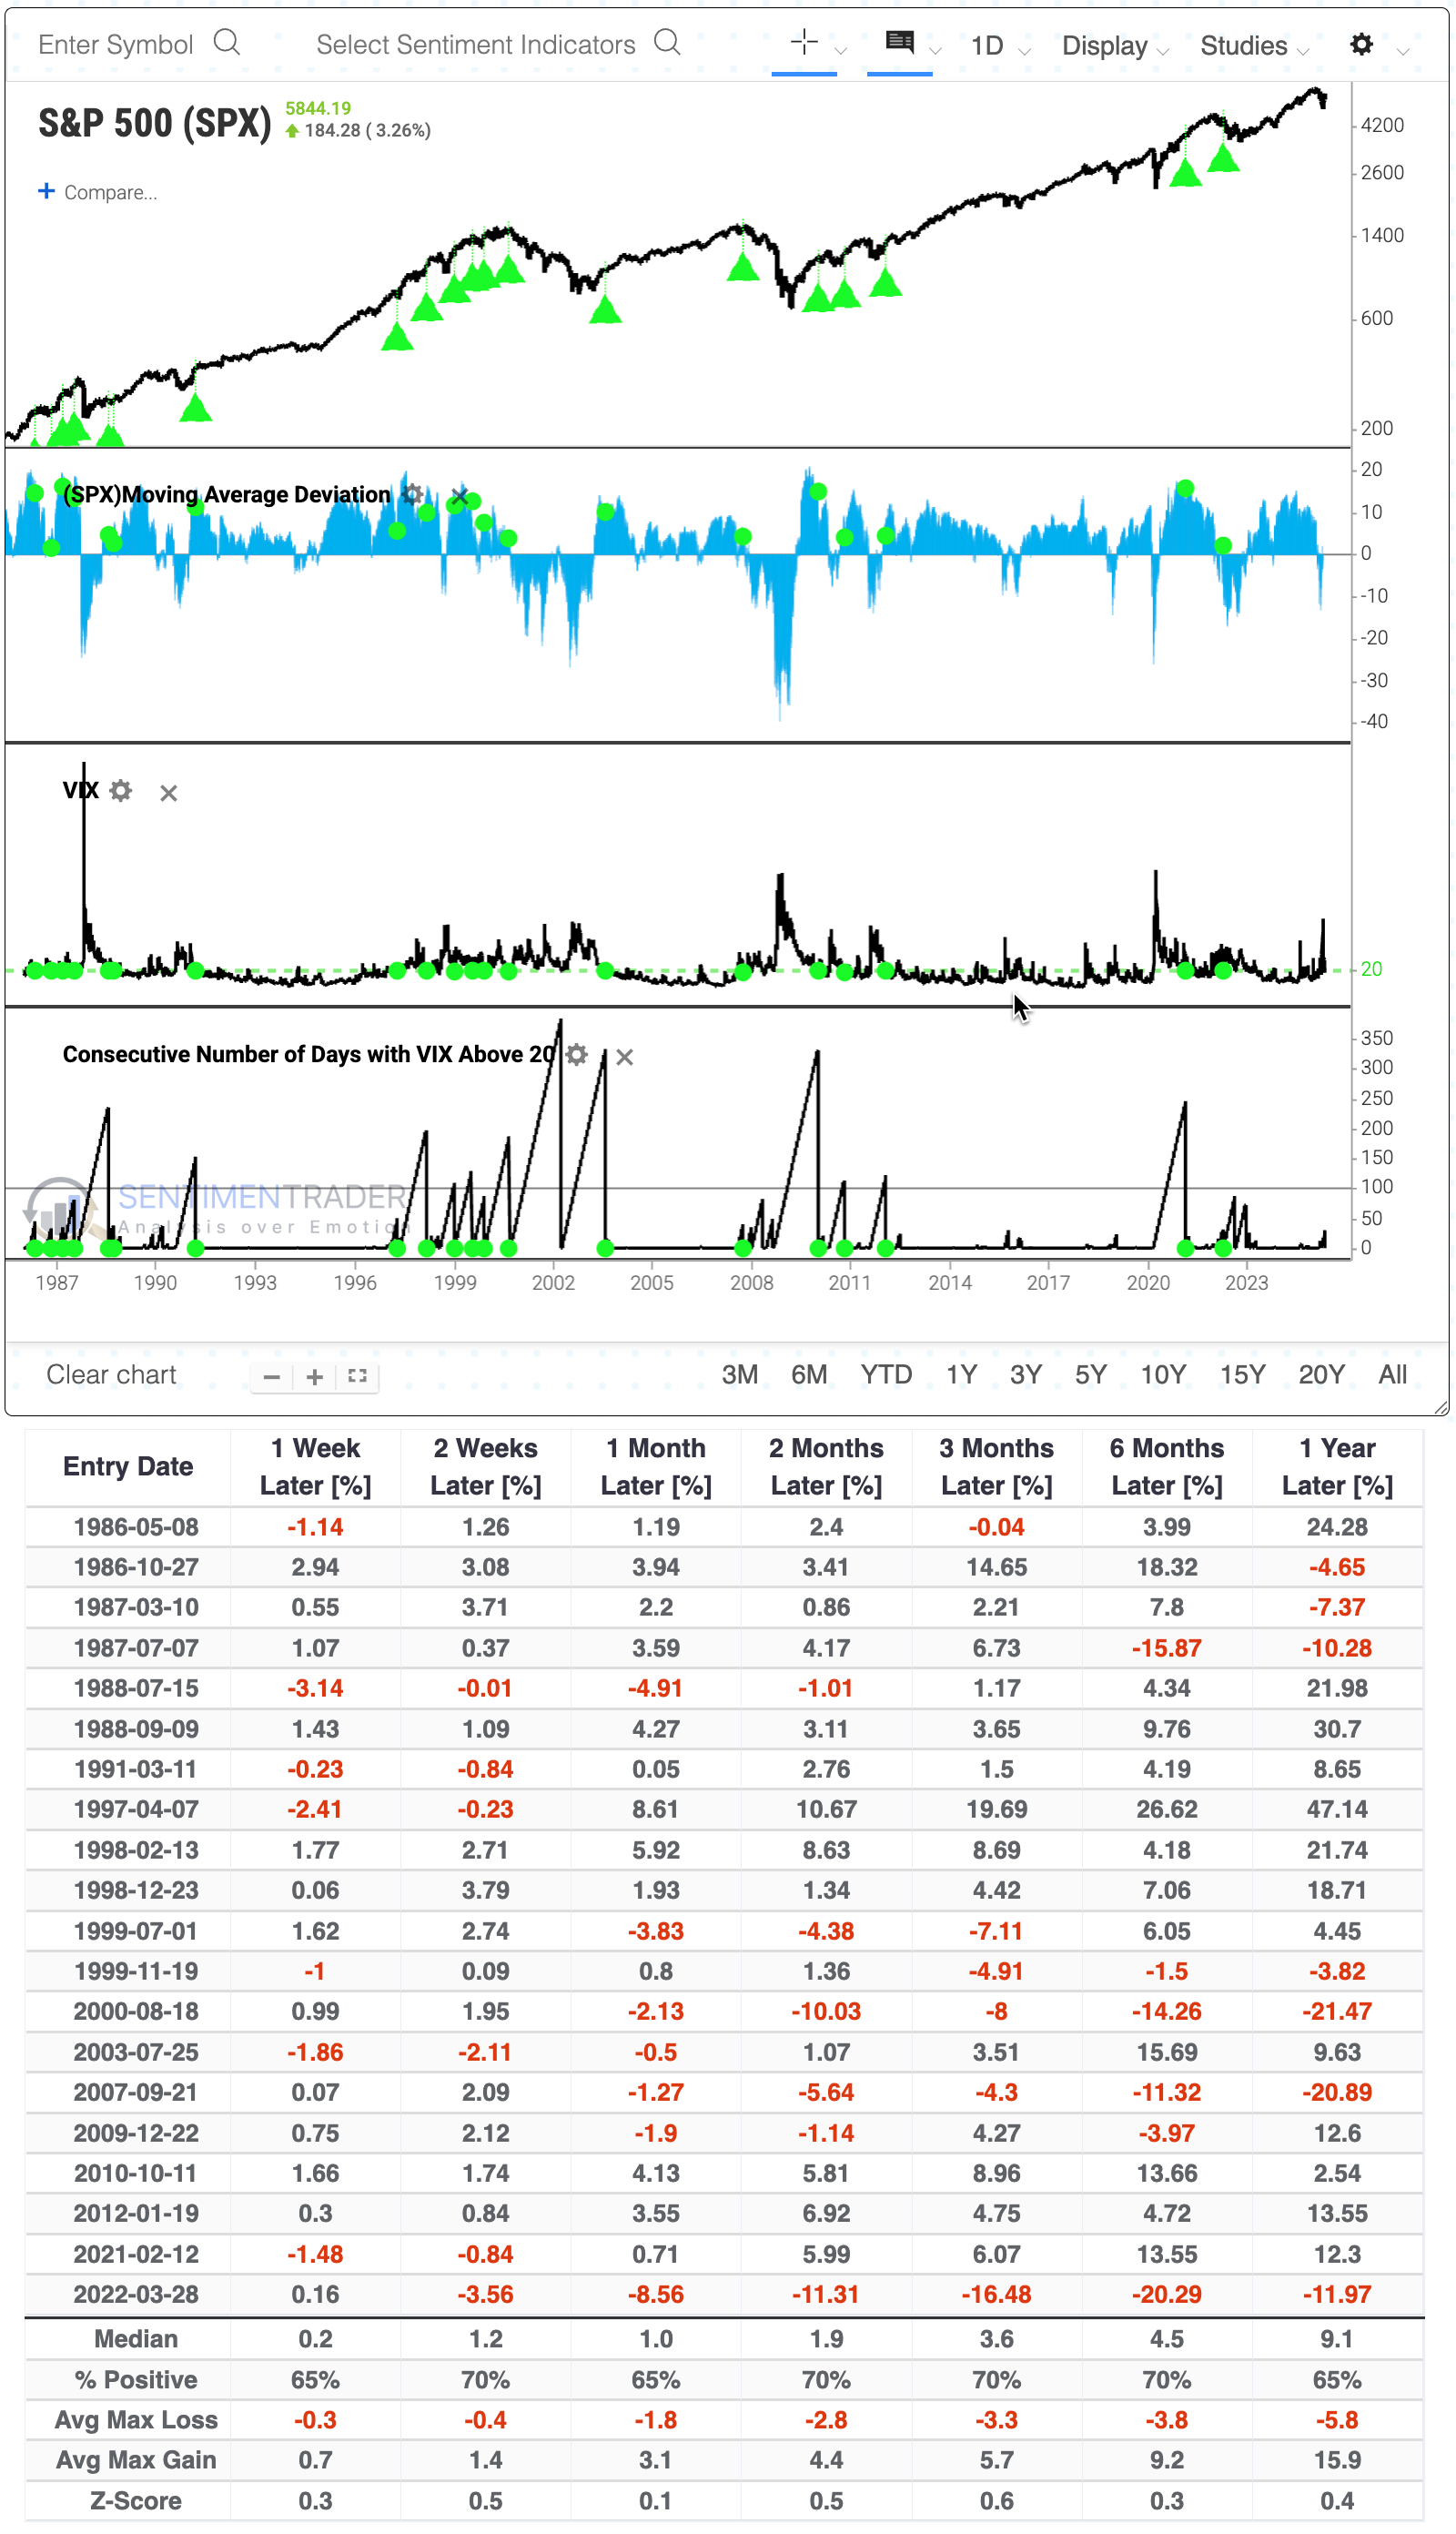
One major distinction is that the S&P 500 has managed to spurt at least 1% above its 200-day moving average. That tells us that there was enough interest from buyers to push it meaningfully above its average price over the past 200 sessions. It didn't *just barely* exceed its average, it sprinted above it.
Trend matters
When a VIX streak above 20 ended and the S&P was at least 1% above its average, future returns improved significantly. There were still some miserable failures - this triggered during the initial stages of the 2001-02, 2008, and 2022 bear markets. However, average returns, consistency, and risk/reward improved across all time frames.
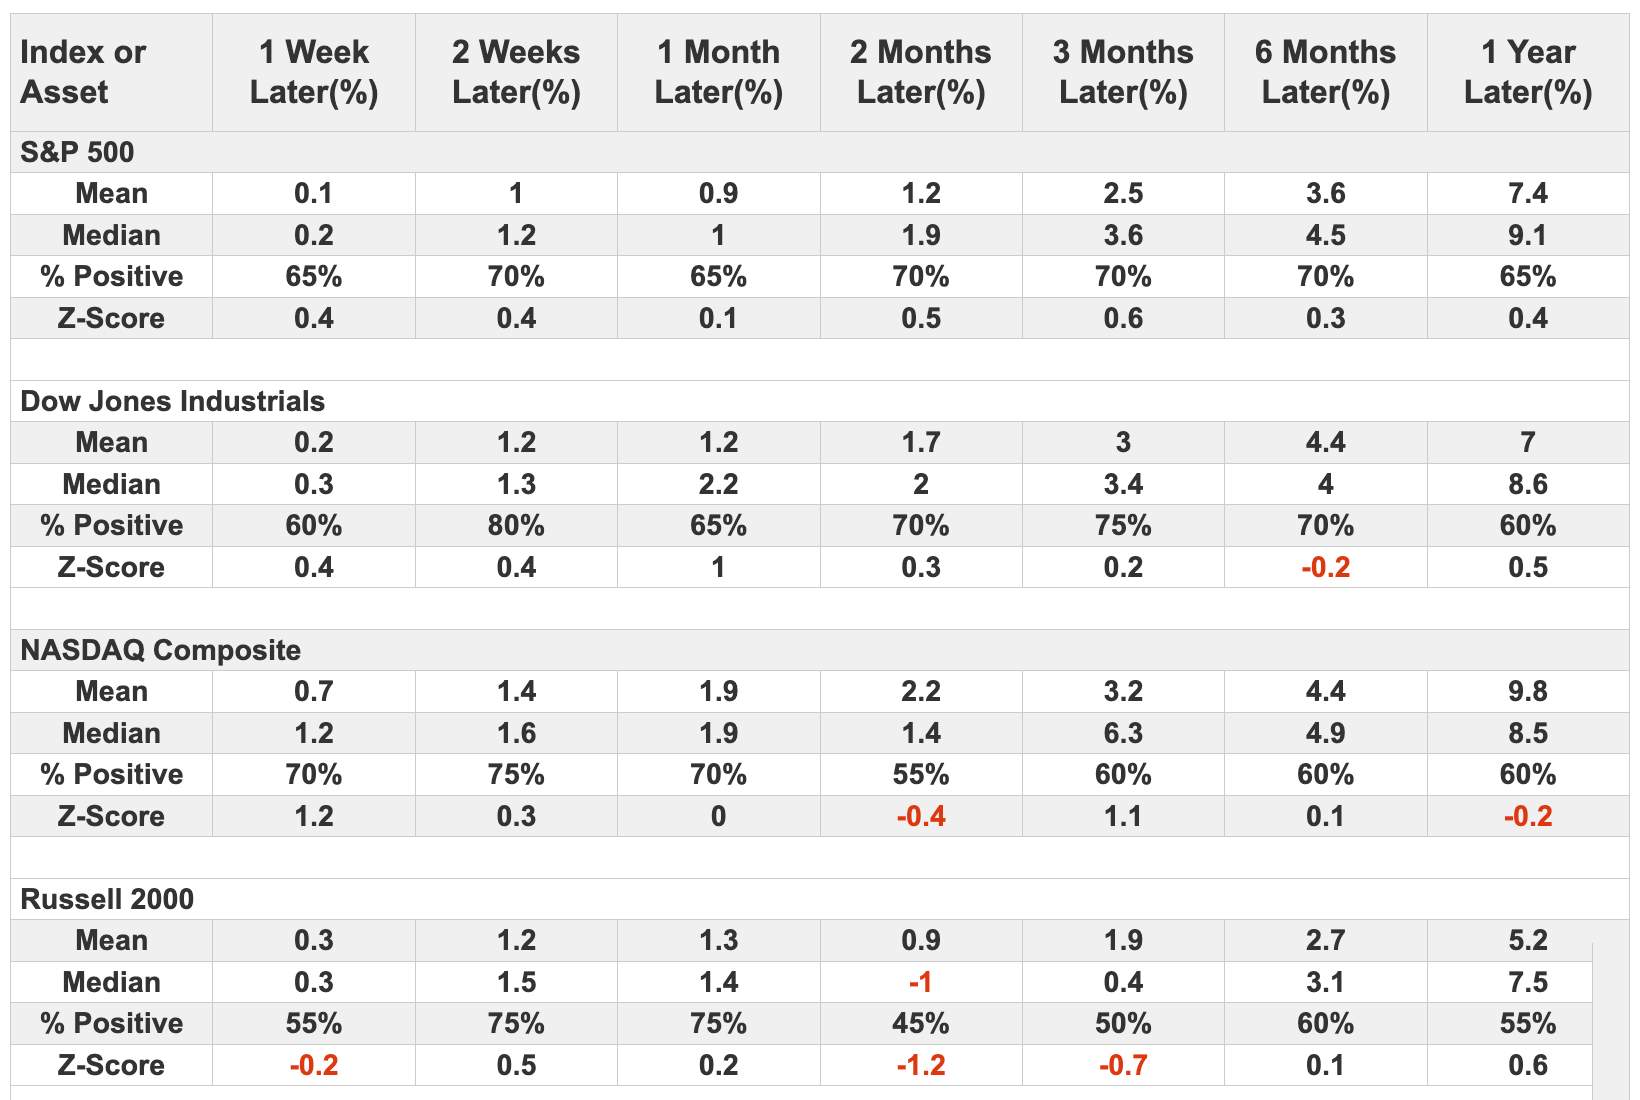
If you run this test and click the Major Indexes tab, you can see how other major equity indices and other markets performed after the signals. Among the major indexes, the Dow Industrials held up as well or better than the S&P. The more volatile Nasdaq Composite tended to see larger swings, with more losses, and the small-cap Russell 2000 even more so. Over the next two months, that index was up only 45% of the time.
Most of the worst signals, those most likely to fail in the weeks and months ahead, were triggered when the VIX streak ended but the S&P was not at least 1% above its 200-day average. Every one of those signals showed a loss either two or three months later. These were truly horrendous signals.
What the research tells us...
Nascent signs that calm has returned to markets are a welcome relief. Under calm conditions, investors are much more likely to commit new capital, bid up prices, and increase valuations. The future looks brighter when we have more confidence in what tomorrow will look like today.
The current administration likes to keep people on their toes, so who knows how long the relatively calm conditions may last. All we know is what we see now, and that's traders pricing in less volatility over the next 30 days. Their confidence in calm conditions has been a welcome sign for stocks, as they had a significantly lower chance of suffering large and sustained losses as long as the VIX is below 20. If that ceases to be the case, especially if the S&P 500 is below its 200-day moving average at the time, we have much more to worry about.