
A (barely) healthy environment

Key points:
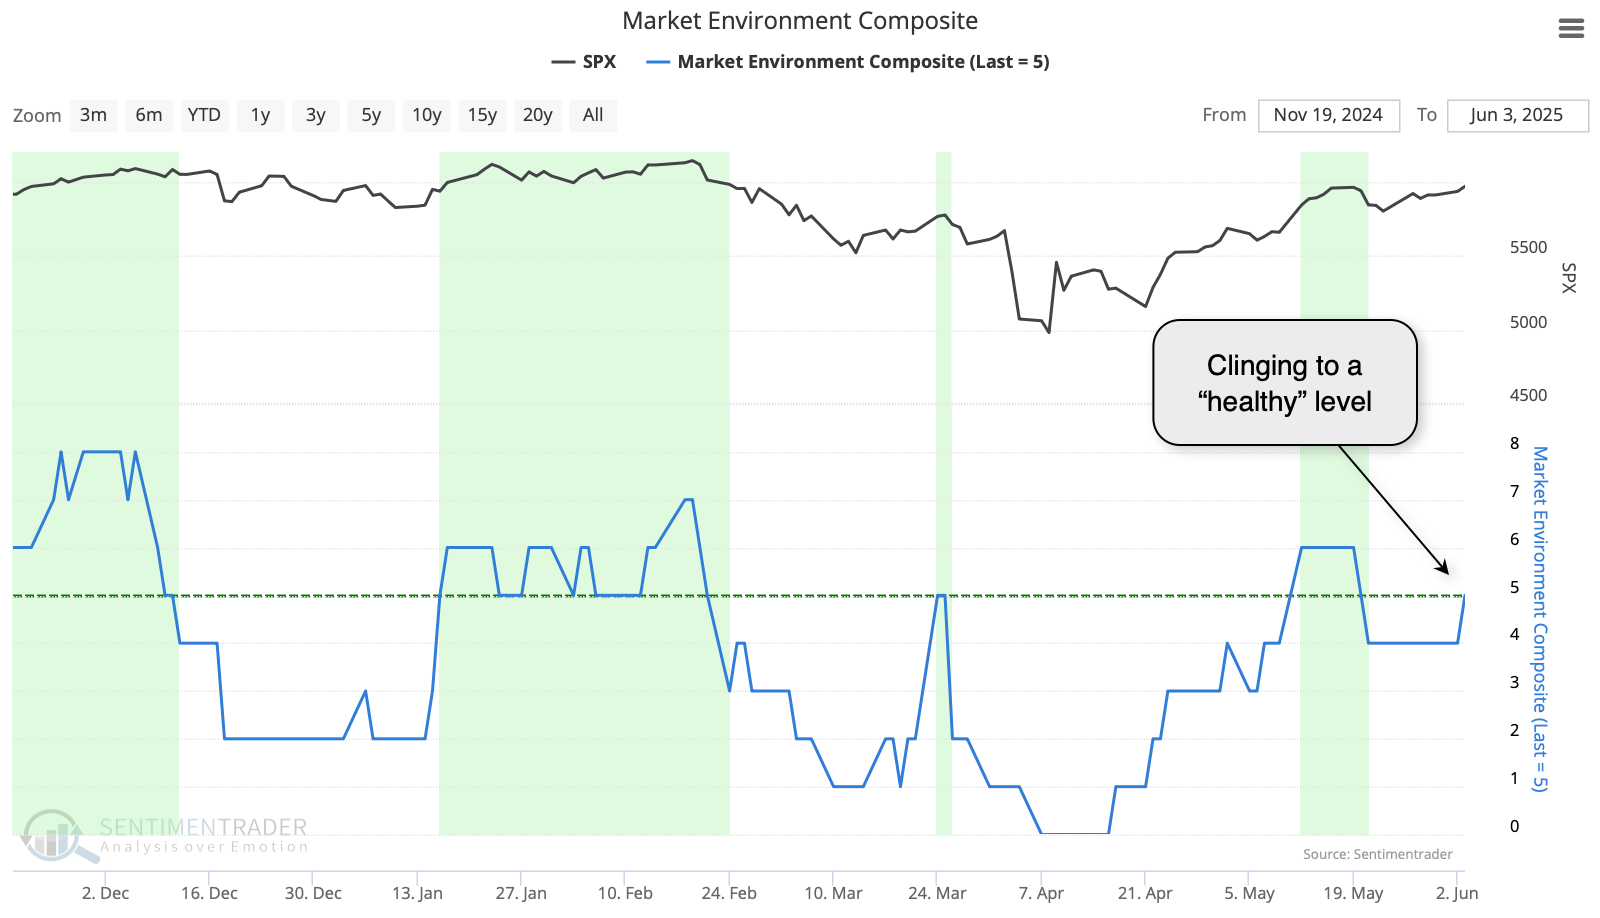
- The Market Environment composite recently cycled from nearly maximum unhealthy back to healthy
- It has settled back in recent sessions and is hovering on the edge of healthy
- The Environment has compelling implications for investors, especially in higher beta sectors
Still hovering in an unhealthy environment
Stocks are doing very well. A healthy market environment helps the sustainability of the advance, making it less likely we're witnessing a bear market rally.
We've discussed a market environment composite several times over the years. The tech team at SentimenTrader has codified it and updates it daily on the site, making it available for saving and testing. The composite is based on 8 core, basic indicators, so when the majority of them are healthy, stocks tend to do well with less risk.
- Higher highs/lows
- Price > 200-day average
- Rising 200-day average
- > 60% of stocks above 200-day
- McClellan Summation > 0
- McClellan Summation is rising
- NYSE New Highs > New Lows
- < 40% of stocks in correction
The Market Environment is currently hovering right at the "healthy" level.
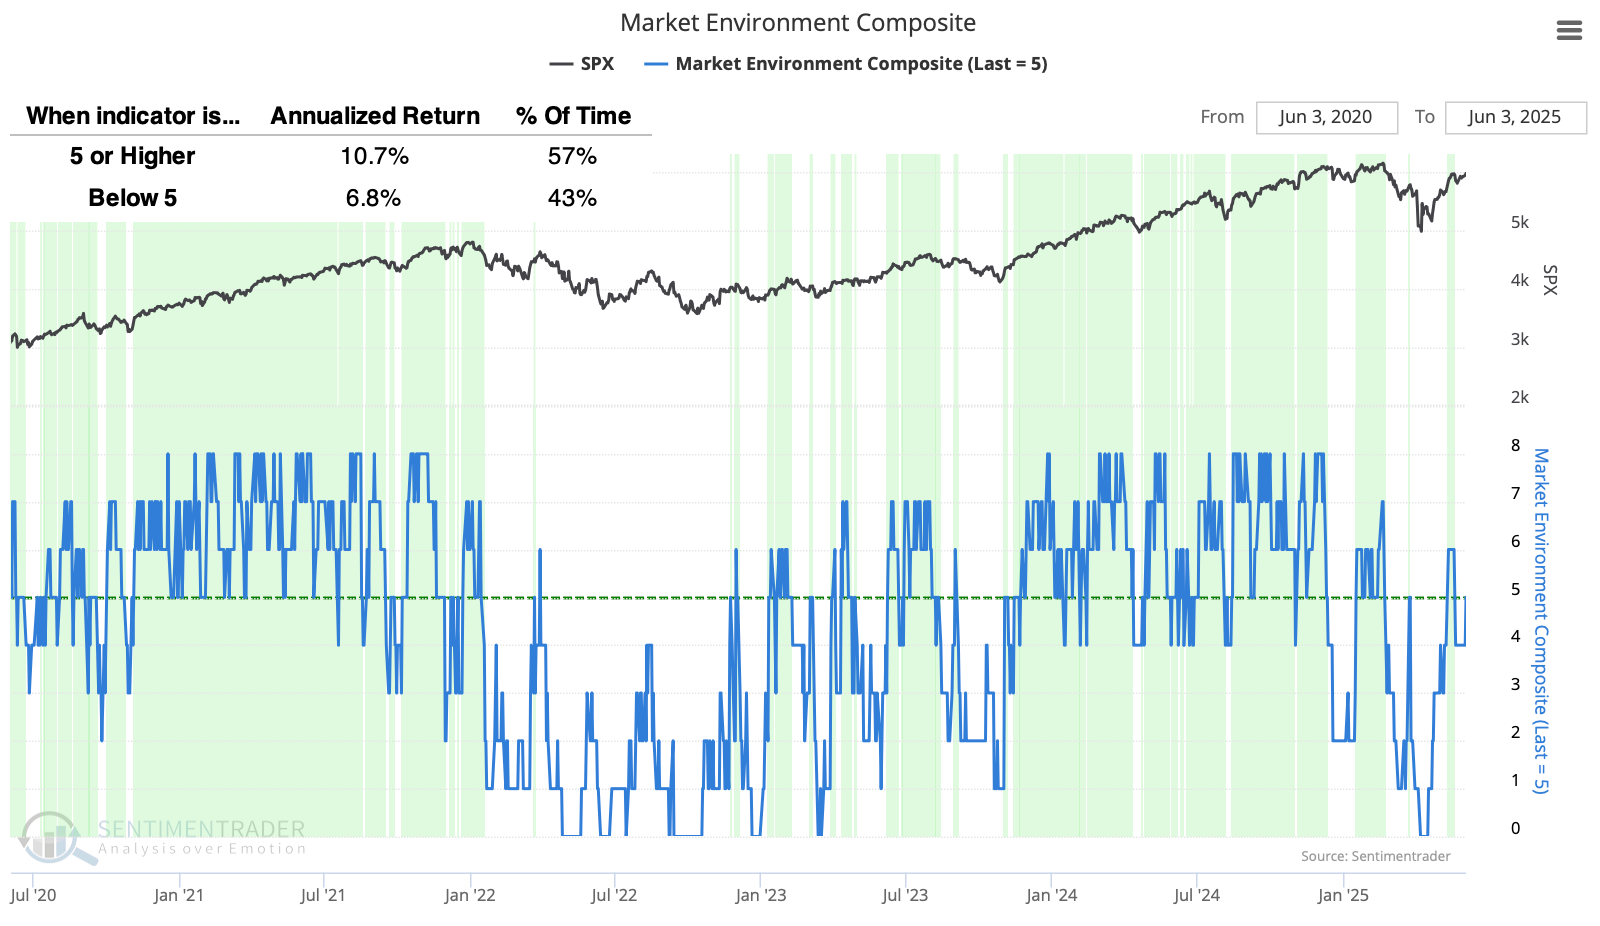
While it would be challenging to use mechanically as a trading system, investors (and traders) have been best served by focusing on long setups or becoming more aggressive when the Environment is healthy. Since 1998, when the version shown on the website originated, the S&P 500's annualized return was +10.7% when the composite was 5 or better. That compares to +6.8% when the composite was below 5.
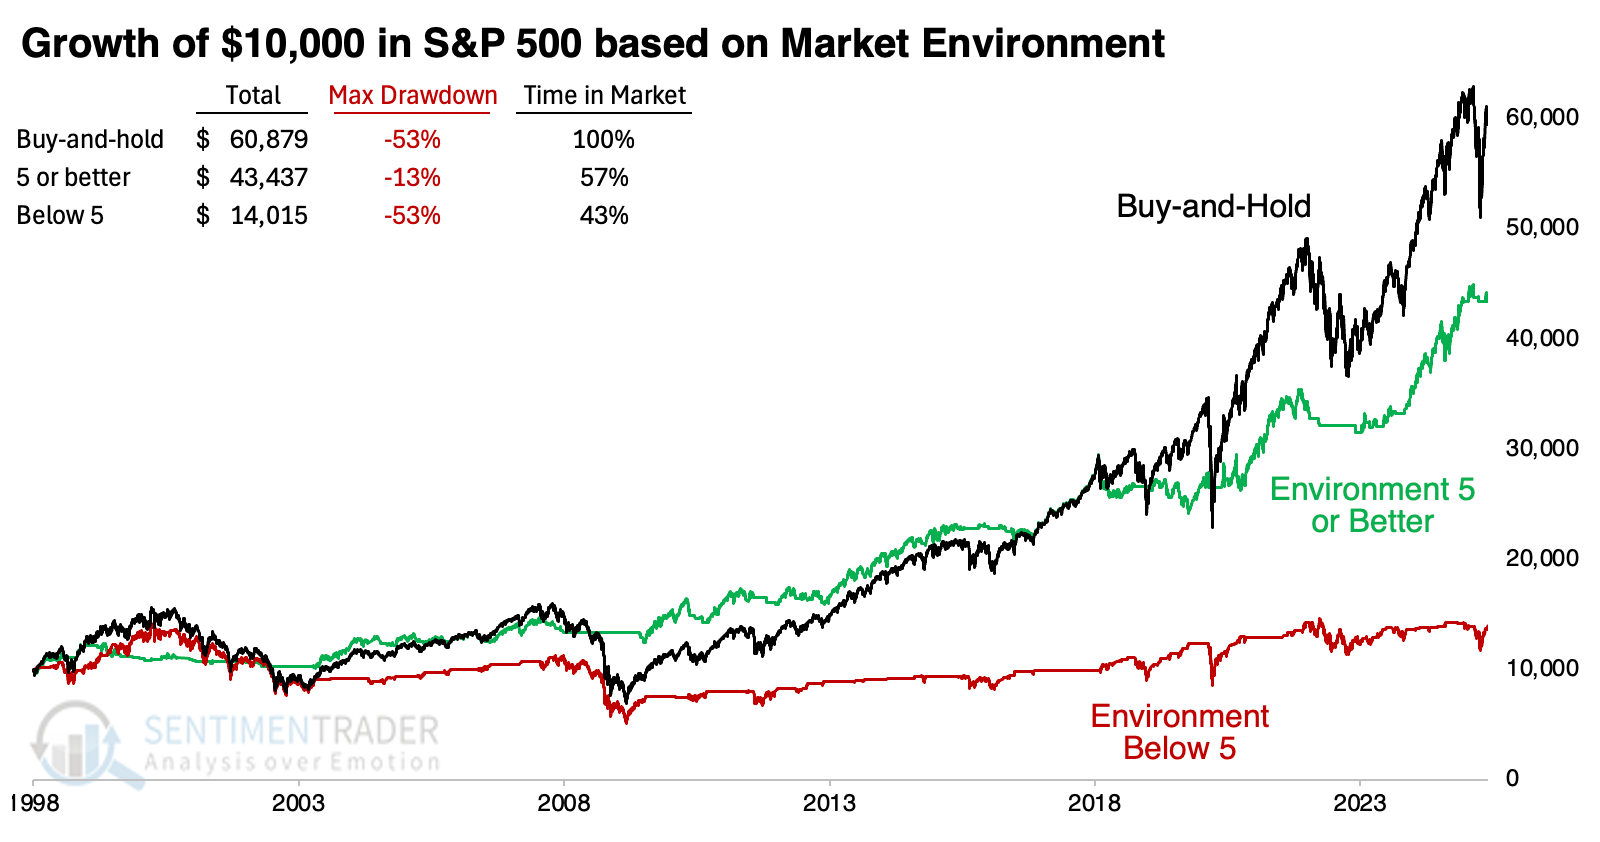
It's hard to beat buy-and-hold with a mechanical timing system over the past 27 years, and this isn't really designed to do that. It's more geared toward highlighting periods of more or less risk; in that sense, it has done well. During healthy environments, $10,000 in the S&P 500 grew to more than $43,000 while suffering a maximum drawdown of only -13%.
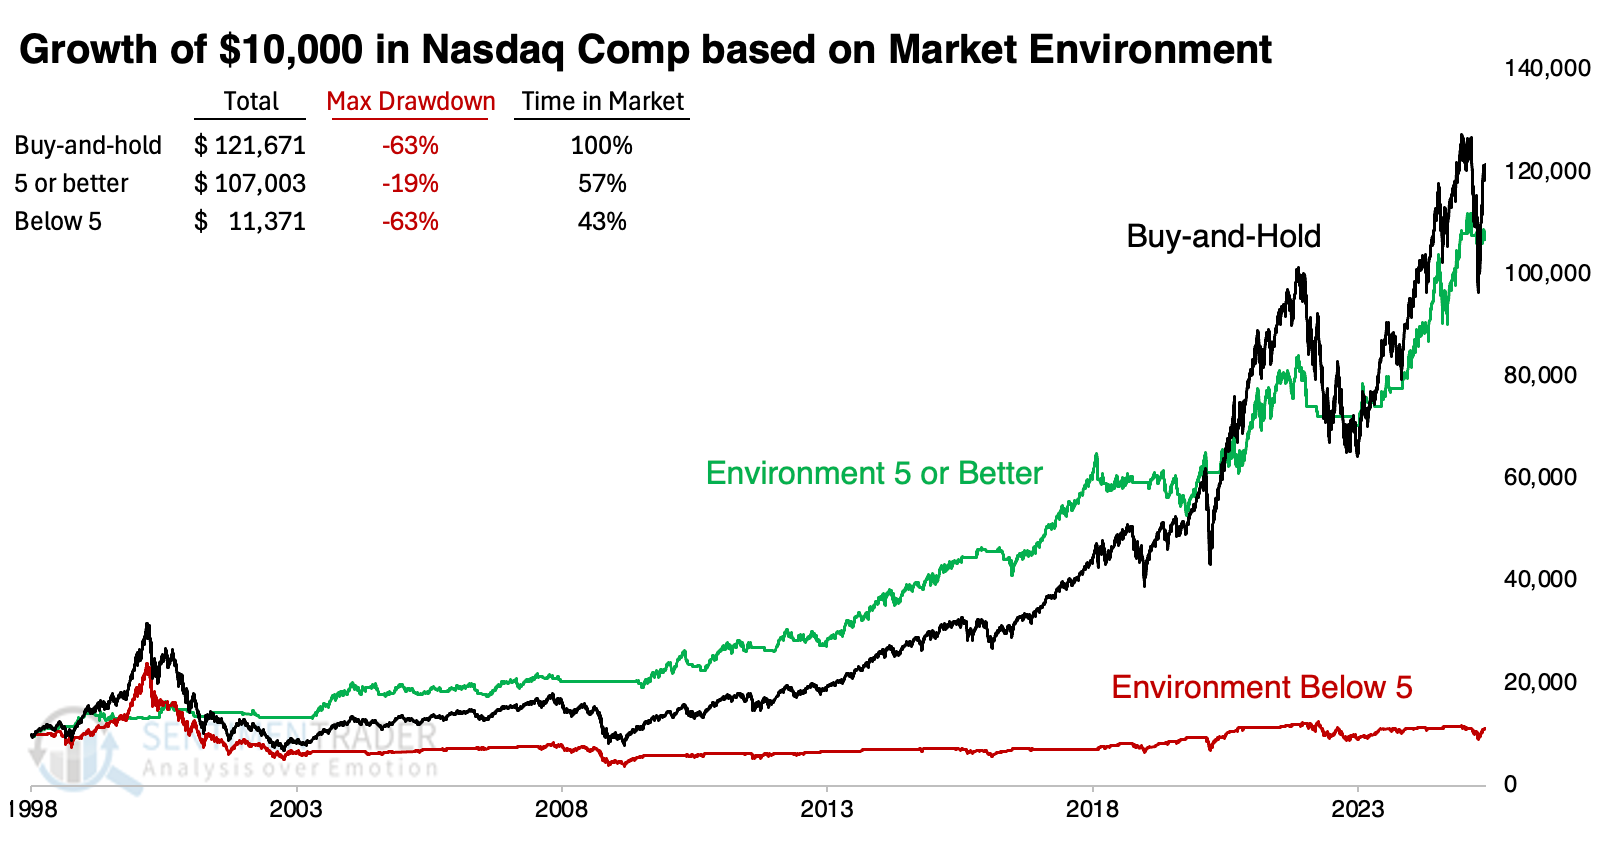
A healthy environment is best for high beta
It was more useful in higher beta indices like the Nasdaq Composite. Since 1998, an investor would have earned nearly as much as buy-and-hold while being in the market only 57% of the time, and suffering a drawdown only a third as large as buy-and-hold (ignoring taxes and transaction costs).
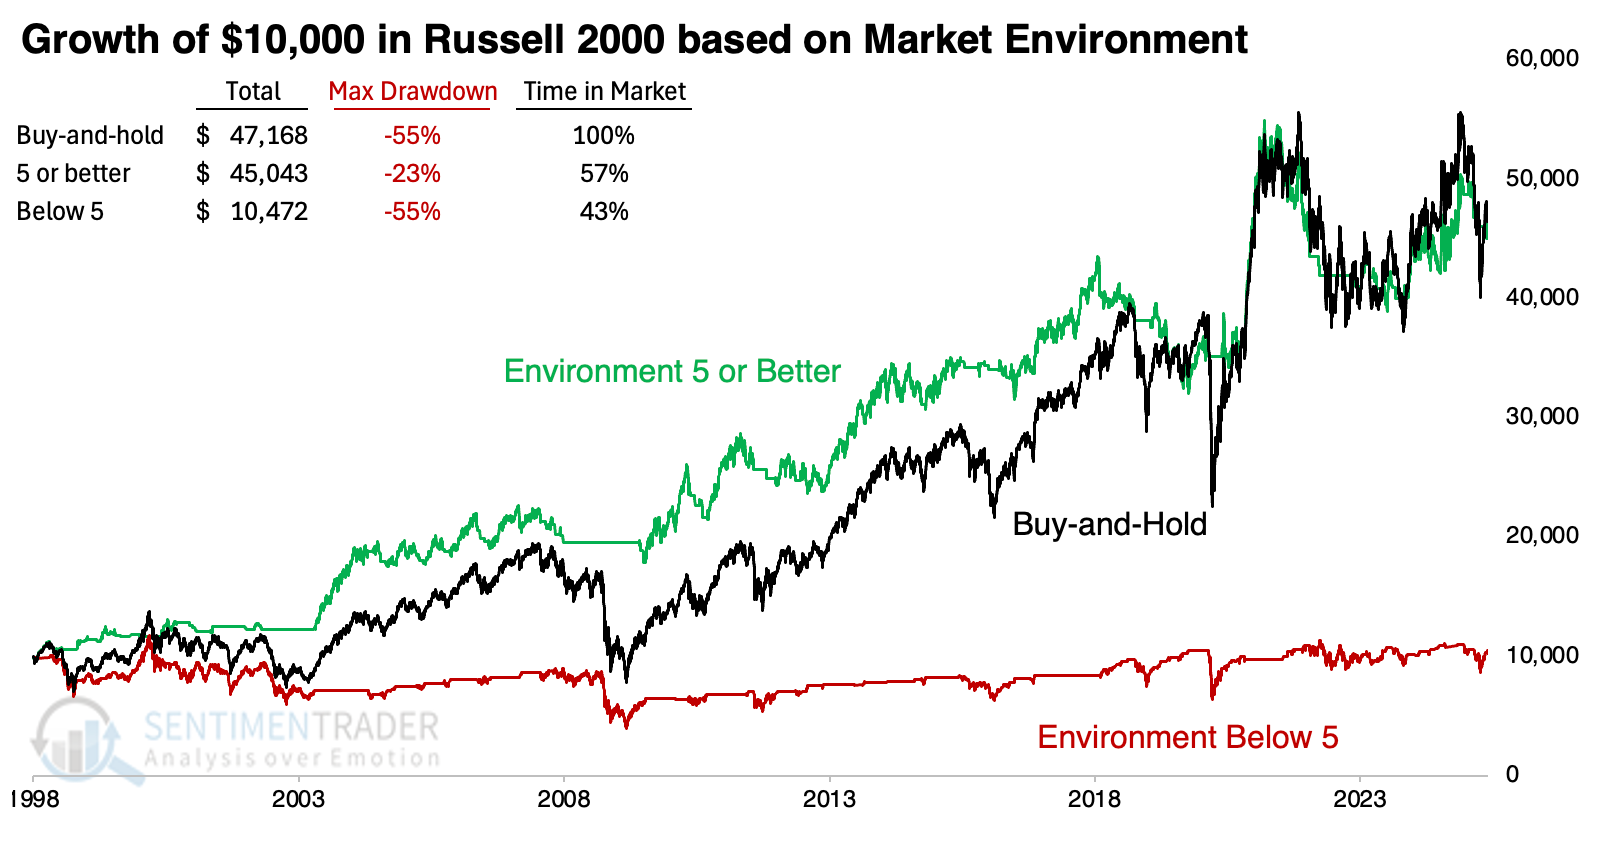
In the small-cap Russell 2000, it was a similar story. Staying out when the Environment was below 5 proved to be a good way to avoid some of the worst markets for those stocks. While the maximum drawdown was still painful, it was significantly less than a buy-and-hold investor suffered, maybe panicking at just the wrong time.
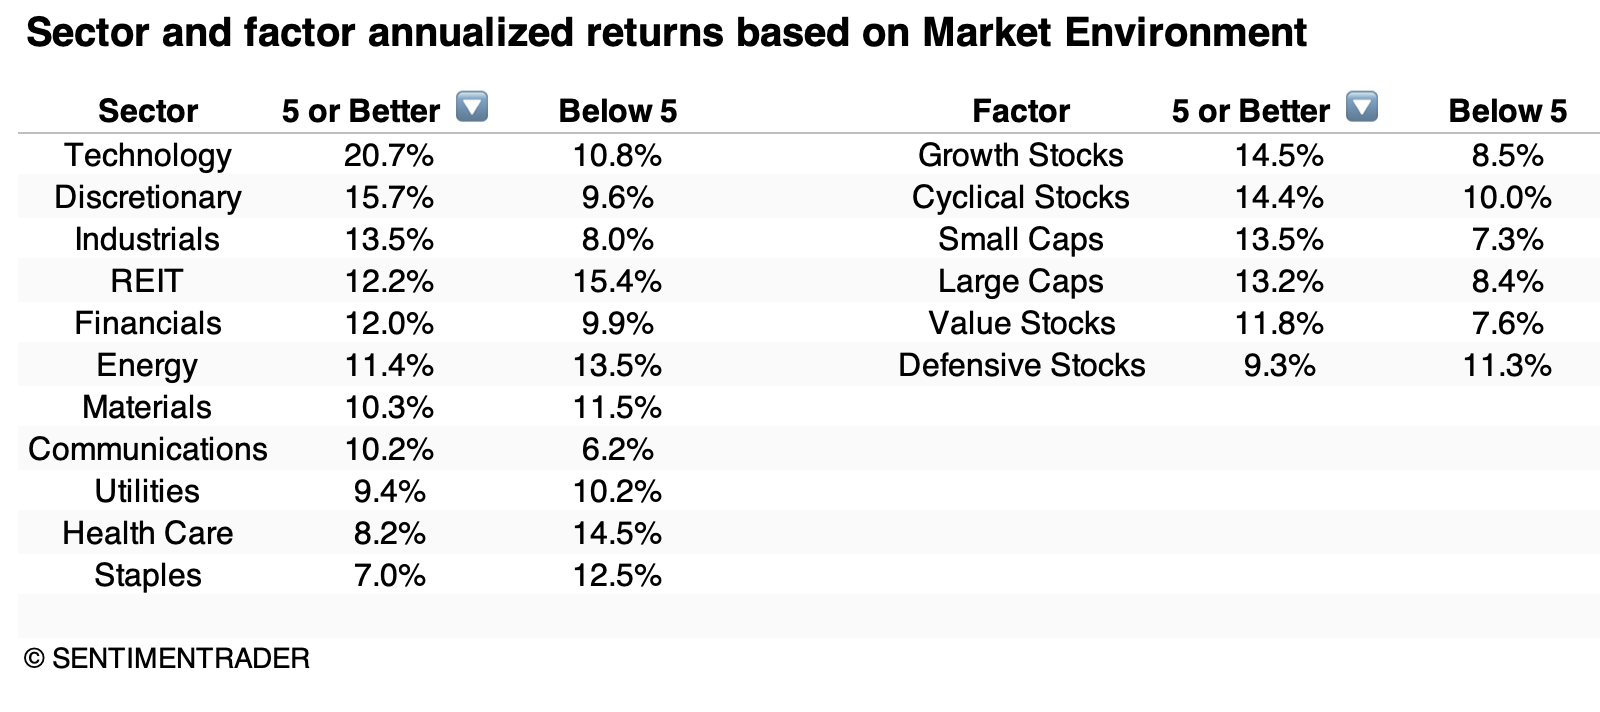
The table below shows how sectors and factors performed under healthy and unhealthy environments, sorted by the highest returns during healthy environments. Growth and cyclical factors performed well, so it's no surprise that technology, consumer discretionary, and industrial stocks showed the highest returns.
Of course, that also means they tended to lag during unhealthy ones, while health care, consumer staples, and utilities showed good returns (especially compared to their returns during healthy environments).
From near-max unhealthy and back
During the worst of the selling in April, the Market Environment was about as negative as it could get. The 10-day average of the composite nearly dropped to 0, then rebounded into healthy territory before settling back in recent days.
If you use Backtest Engine 2.0 to look at similar scenarios, you can see that the S&P 500 did very well in the months afterward, with a wicked exception during the 2002 bear market (click here to load the test, then click Run Backtest).
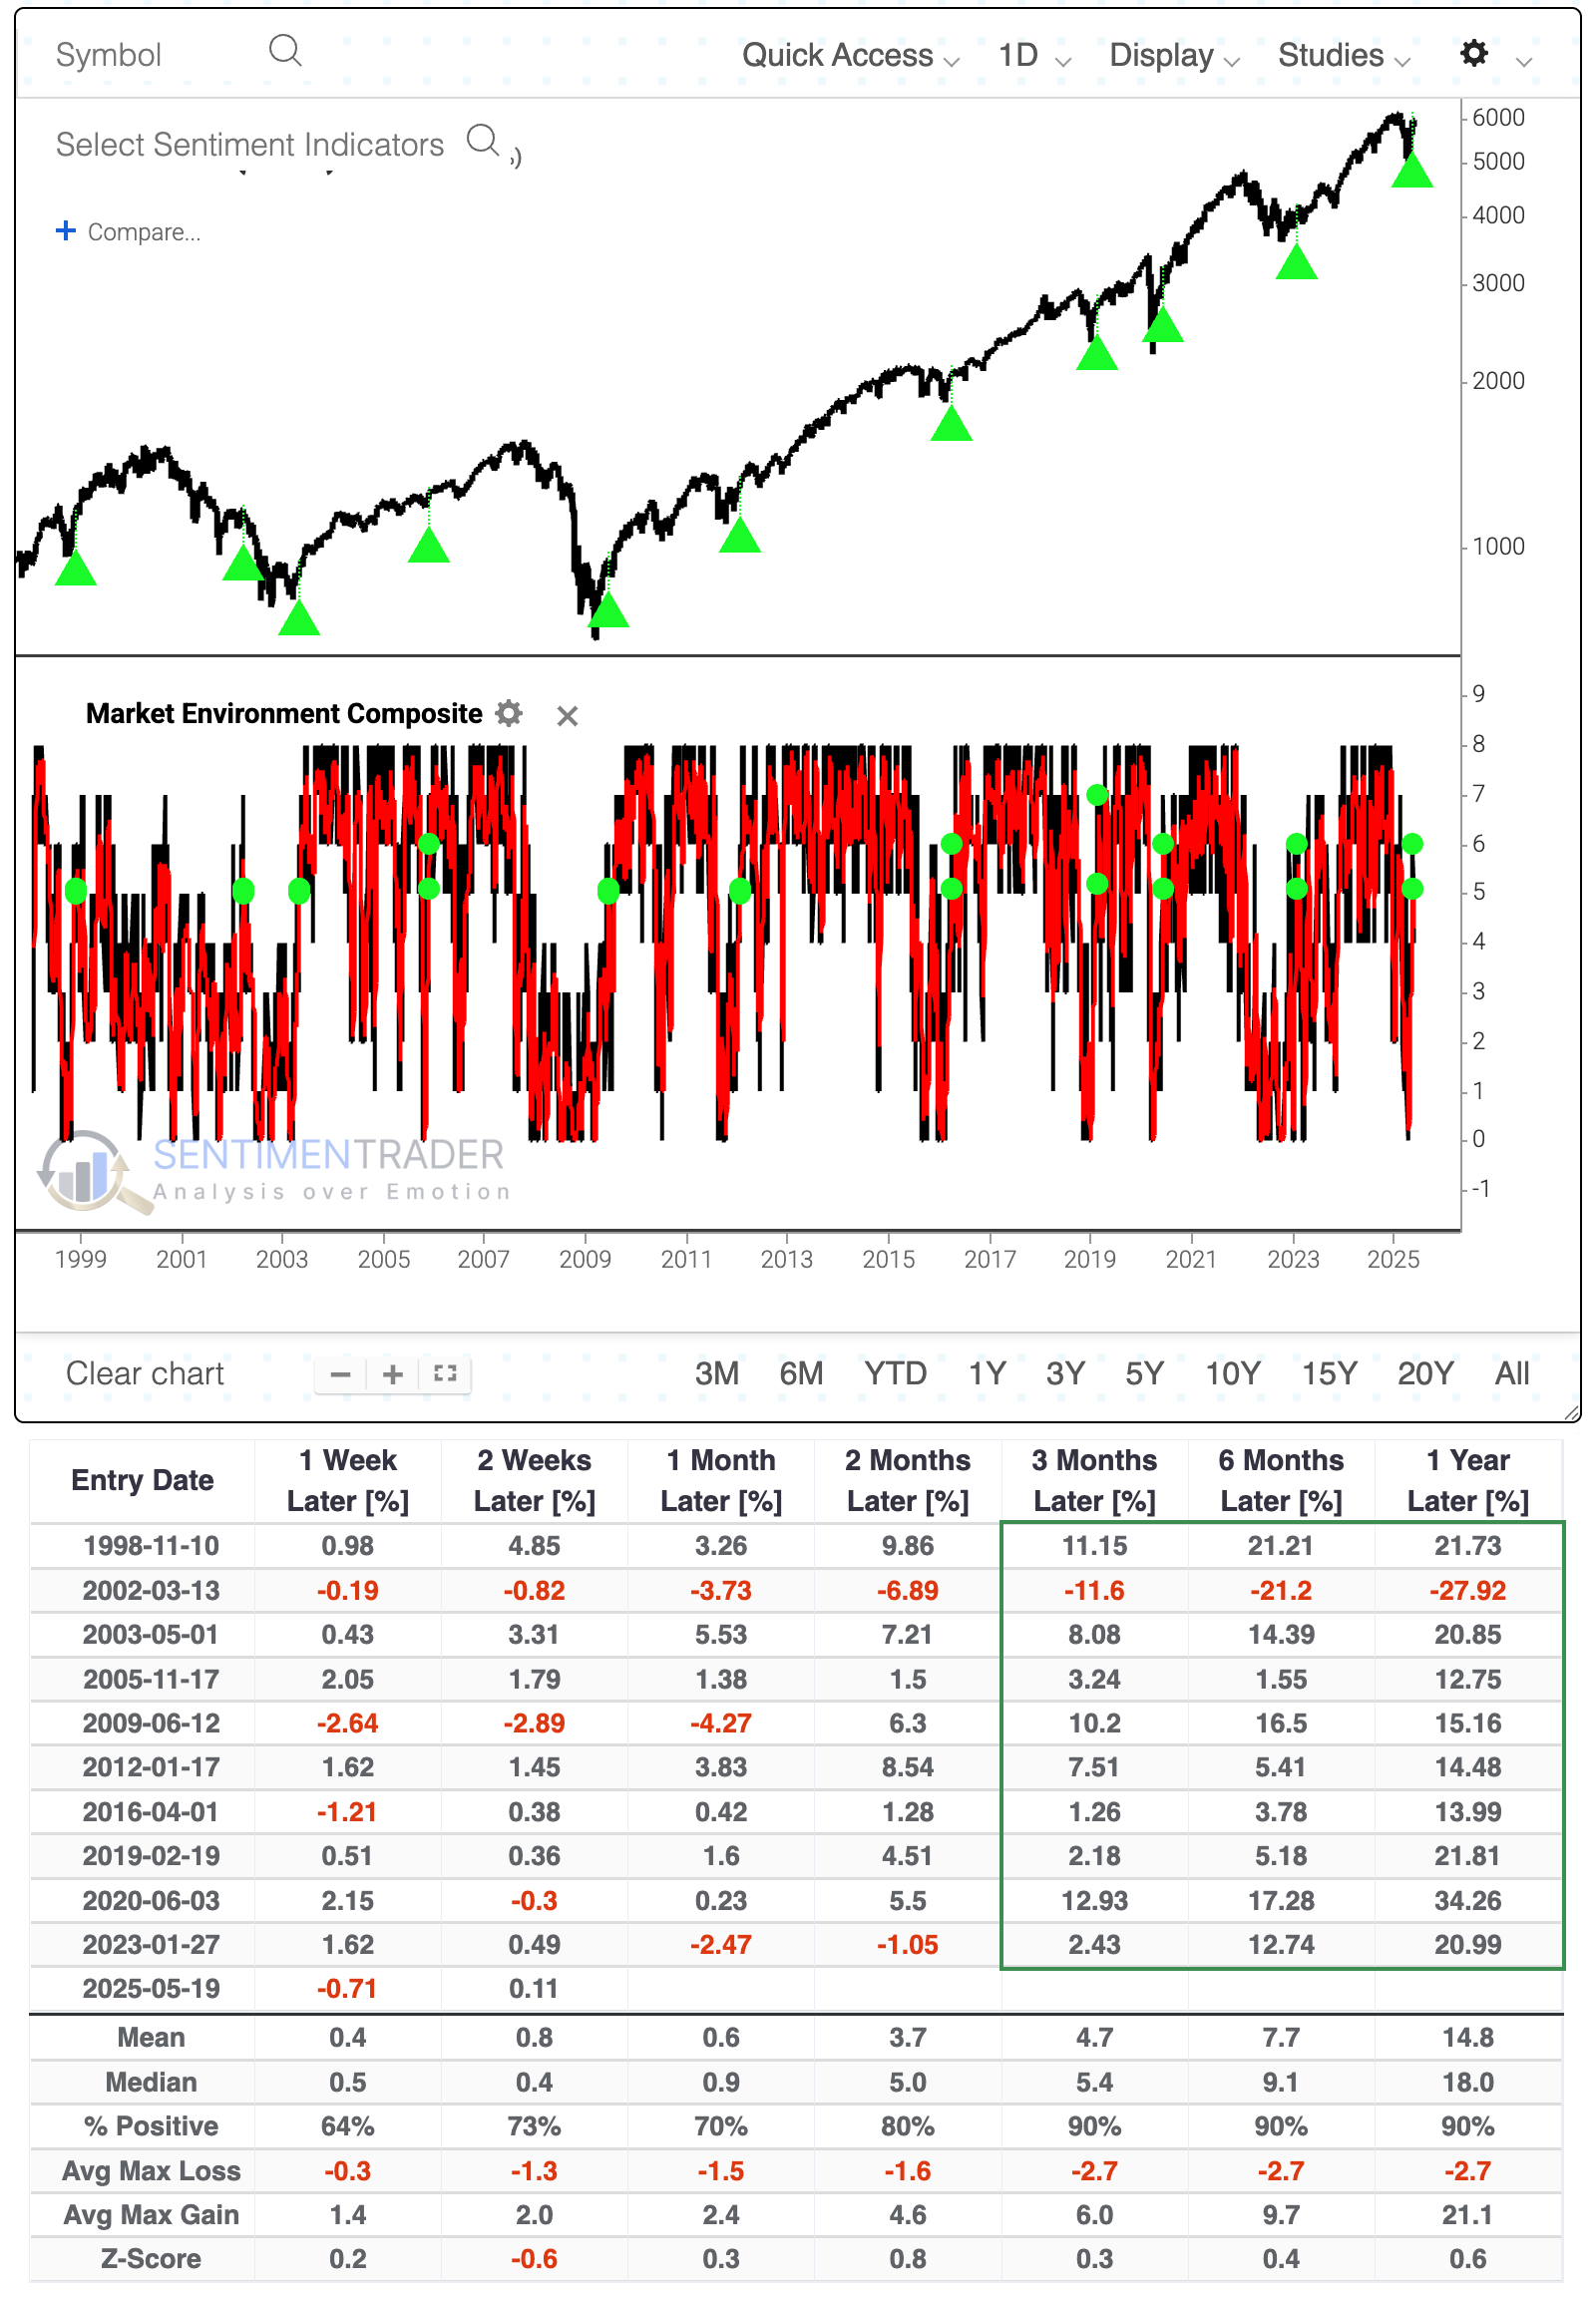
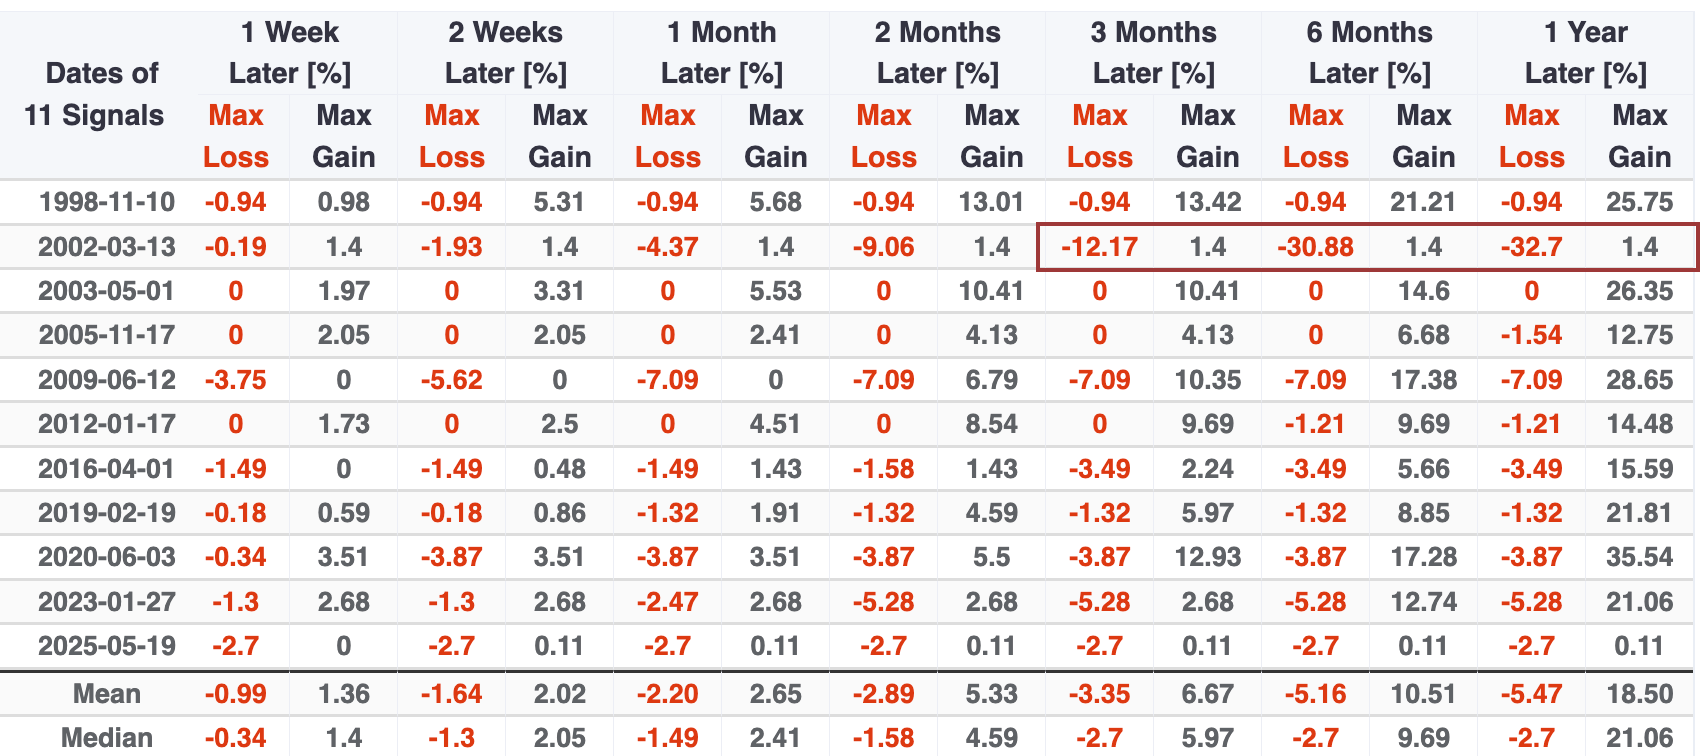
Drawdowns tended to be mild after these signals. Only the 2002 failure witnessed a maximum decline of more than -7.1% at any point within the following year. Excluding 2002, the average one-year drawdown was a minuscule -2.7%.
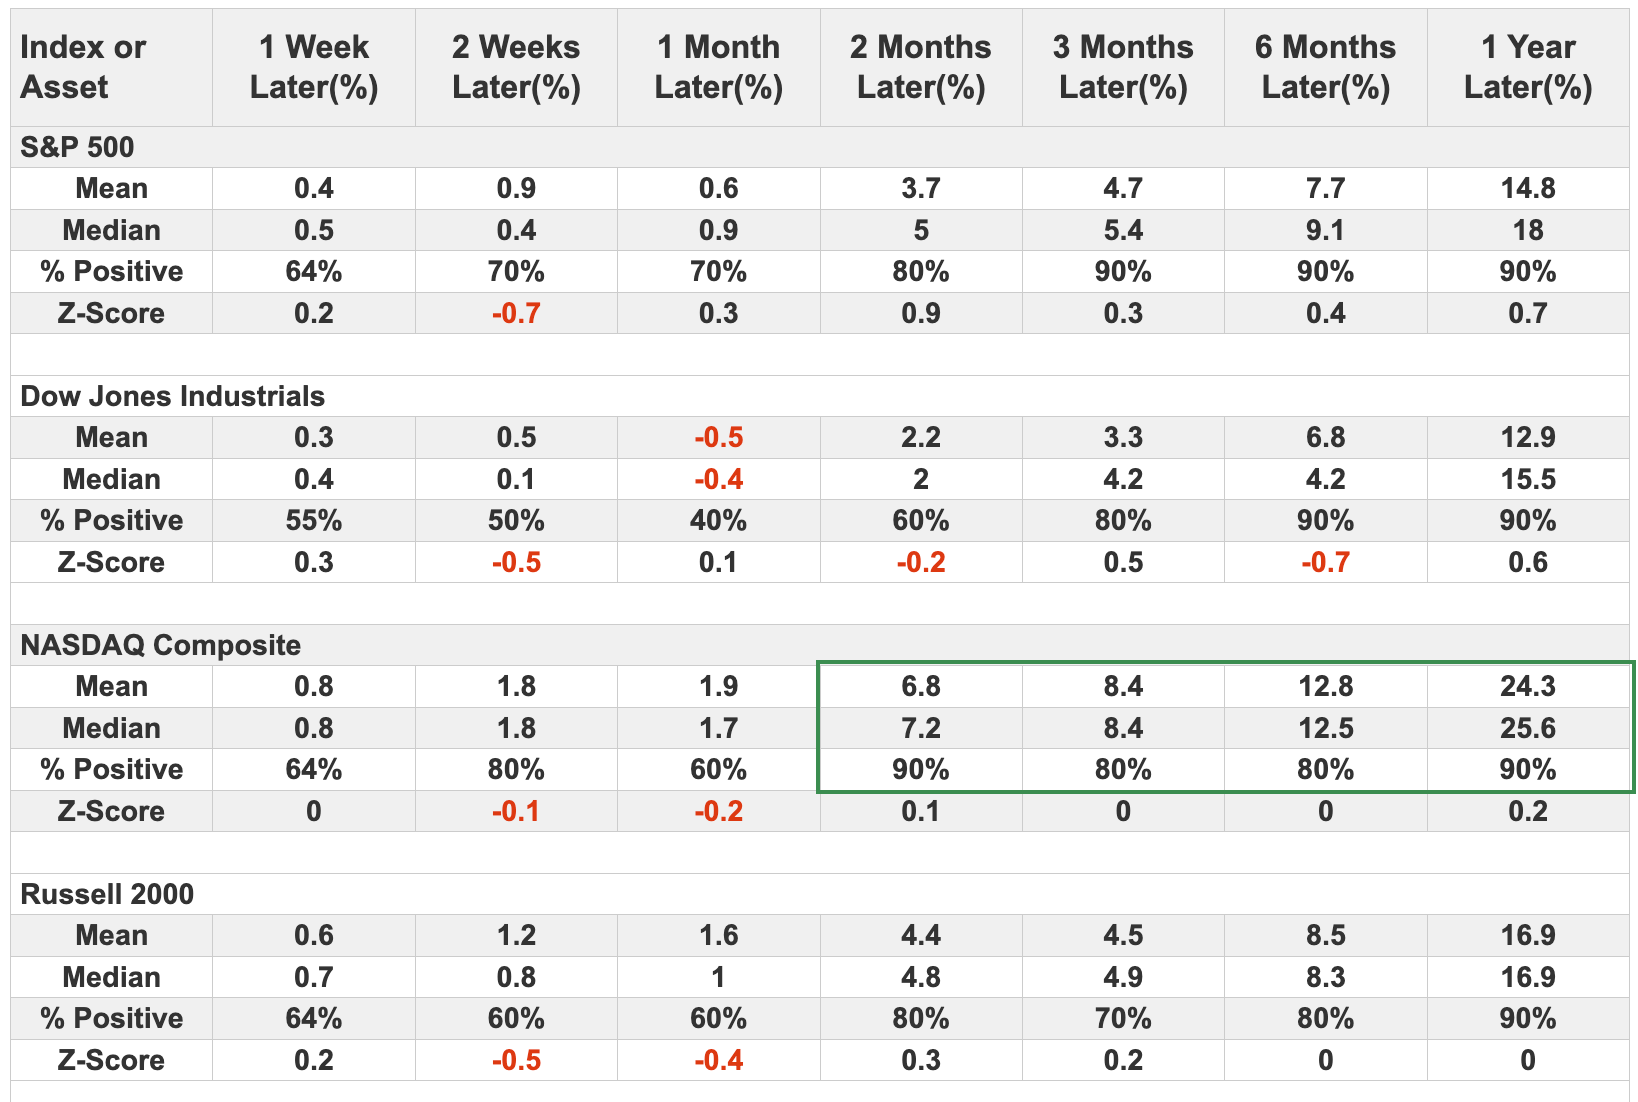
The Major Indexes tab of the results shows that the Nasdaq Composite performed especially well after these recoveries in the Market Environment.
What the research tells us...
Major indices like the S&P 500 and Nasdaq Composite have been holding up well. Breadth saw a tremendous surge off the April low, which was a good sign, but it has stagnated, with many hovering around the thresholds usually seen during healthy, sustained bull markets.
The fact that the 10-day average of the Environment cycled from extremely unhealthy is a good sign. Investors should want to see smaller stocks pick up the reins and rally, which would greatly help breadth figures and flip some other indicators into positive territory.