
TradingEdge Weekly for Sep 26 - Broad-based breakouts, market sentiment shifts, silver's uptrend

Key points:
Record highs across major indexes signal broadening market uptrend
Warning signs emerge as sentiment shifts and market breadth weakens
Silver demonstrates characteristics of secular uptrend with strong momentum
Commodity seasonals highlight Canadian Dollar, Soybeans, Natural Gas, and Sugar opportunities
Equal-weighted versus cap-weighted strategies show performance divergence
House view:
- Stocks:
- Short-term: Modestly bearish. The S&P 500 and Nasdaq traded sideways following the Federal Reserve's September rate cut, with early attempts to retake recent highs faltering amid mixed corporate earnings signals. While tech giants with heavy AI exposure reported stronger-than-anticipated growth from generative AI tools, consumer and industrial sectors showed uneven performance, reflecting inconsistent demand . Market breadth stabilized slightly after the prior week's volatility, but advancing stocks still failed to establish clear dominance, and trading activity trended lower as investors adopted cautious positioning ahead of quarter-end . The rally remains reliant on a narrow group of mega-cap names, with smaller companies continuing to underperform a divergence that historically precedes short-term pullbacks. Seasonal headwinds typical of late September have been compounded by uncertainty around the Fed's next policy move, as officials remain divided on the need for additional easing . Time frame: 1-4 weeks.
- Intermediate-term: No view. Valuations stay elevated relative to historical averages, with long-term metrics still near multi-decade highs despite recent choppiness. This is offset by persistent market expectations for further Fed rate cuts before year-end, a factor that has historically provided support for risk assets during periods of economic ambiguity . Market leadership remains skewed toward growth sectors, particularly those tied to AI and cloud computing, while cyclical sectors sensitive to economic breadth lag a split that signals investor skepticism about sustained expansion. However, most stocks continue to trade above their medium-term moving averages, and new highs remain ahead of new lows, creating tension between technical resilience and fundamental concerns . Time frame: 1-5 months.
- Long-term: Bullish. The economic recovery continues to be driven by sectors tied to technological innovation, a pattern consistent with sustained expansions. Companies investing in AI, cloud infrastructure, and digital transformation have demonstrated stronger profitability compared to less tech-enabled peers, indicating underlying resilience . Long-term breadth measures have improved, with most stocks maintaining uptrends above their long-term moving averages a positive signal for sustained gains. Structural tailwinds from monetary easing and corporate tech spending are expected to support growth over the coming quarters, outweighing near-term valuation pressures . This time frame covers 6-12 months.
- Cyclical momentum: Favors sectors sensitive to interest rates and technological investment, which historically outperform in early easing cycles.
- Defensive resilience: Stable sectors offer lower volatility but limited upside potential amid accelerating tech-driven growth.
- Longer-term: Mean reversion tendencies suggest potential for smaller companies and equal-weight strategies to outperform after periods of mega-cap tech dominance.
- Bonds: Long-term cycles remain bearish. Septembers historical weakness for longer-dated Treasuries has persisted, amplified by the U.S. Treasury's announcement of additional debt issuance scheduled for late September . While the Fed's rate cut initially pushed yields lower, prices reversed course as market participants priced in fewer subsequent cuts than previously expected, and institutional selling picked up amid concerns about fiscal deficits . The yield curve has steepened modestly but retains a flattened shape, reflecting ongoing uncertainty about the economic outlook. In our analysis of analyst research, there remains no significant evidence that seasonal weakness or structural headwinds are abating, with some forecasts suggesting pressure could extend into October .
- Commodities: Signs point to a probable secular bull market following recent strength across subsectors. An effective commodity trend model remains bullish. Gold (especially gold miners) extended gains to fresh near-term highs, supported by central bank buying and safe-haven demand amid geopolitical tensions, continuing to defy its historical pattern of struggling to sustain extended rallies . Oil retreated amid news that major producers have abandoned price targets, but speculative short positioning remains at extreme levels that have historically preceded rebounds in recent years . Industrial metals gained ground, driven by demand from tech infrastructure projects and packaging sectors tied to e-commerce growth, with particular strength in metals used in digital transformation initiatives .
- Crypto: We follow several simple systems for bitcoin, which we consider the equivalent of the S&P 500 for crypto. Due to bitcoin's explosive growth over long periods, it's dangerous to equate neutral conditions with being bearish for some of these. However, if a system is "out," we consider it bearish for this summary.
- Triple 40: Bullish → Modestly Bullish
- RSI Momentum: Bullish
- Trend and Relative Trend: Modestly Bullish → Bearish
- PMI: Bearish
- M2 ROC: Bullish
Where we're at
Most investors have the most riding on equities. We feel that the most significant determinants of success for investors are whether to adjust their allocation to that asset class based on factors that have historically had a good record of preceding above- or below-random returns in the months ahead.
Those factors include the probability of a looming recession, sentiment, price action, volatility, breadth, and the bond market. The chart below summarizes the main indicators and composite models we watch for those factors, and they're mostly in bullish regimes. Valuations are not part of these factors since the relationship has been too inconsistent on time frames under one year.
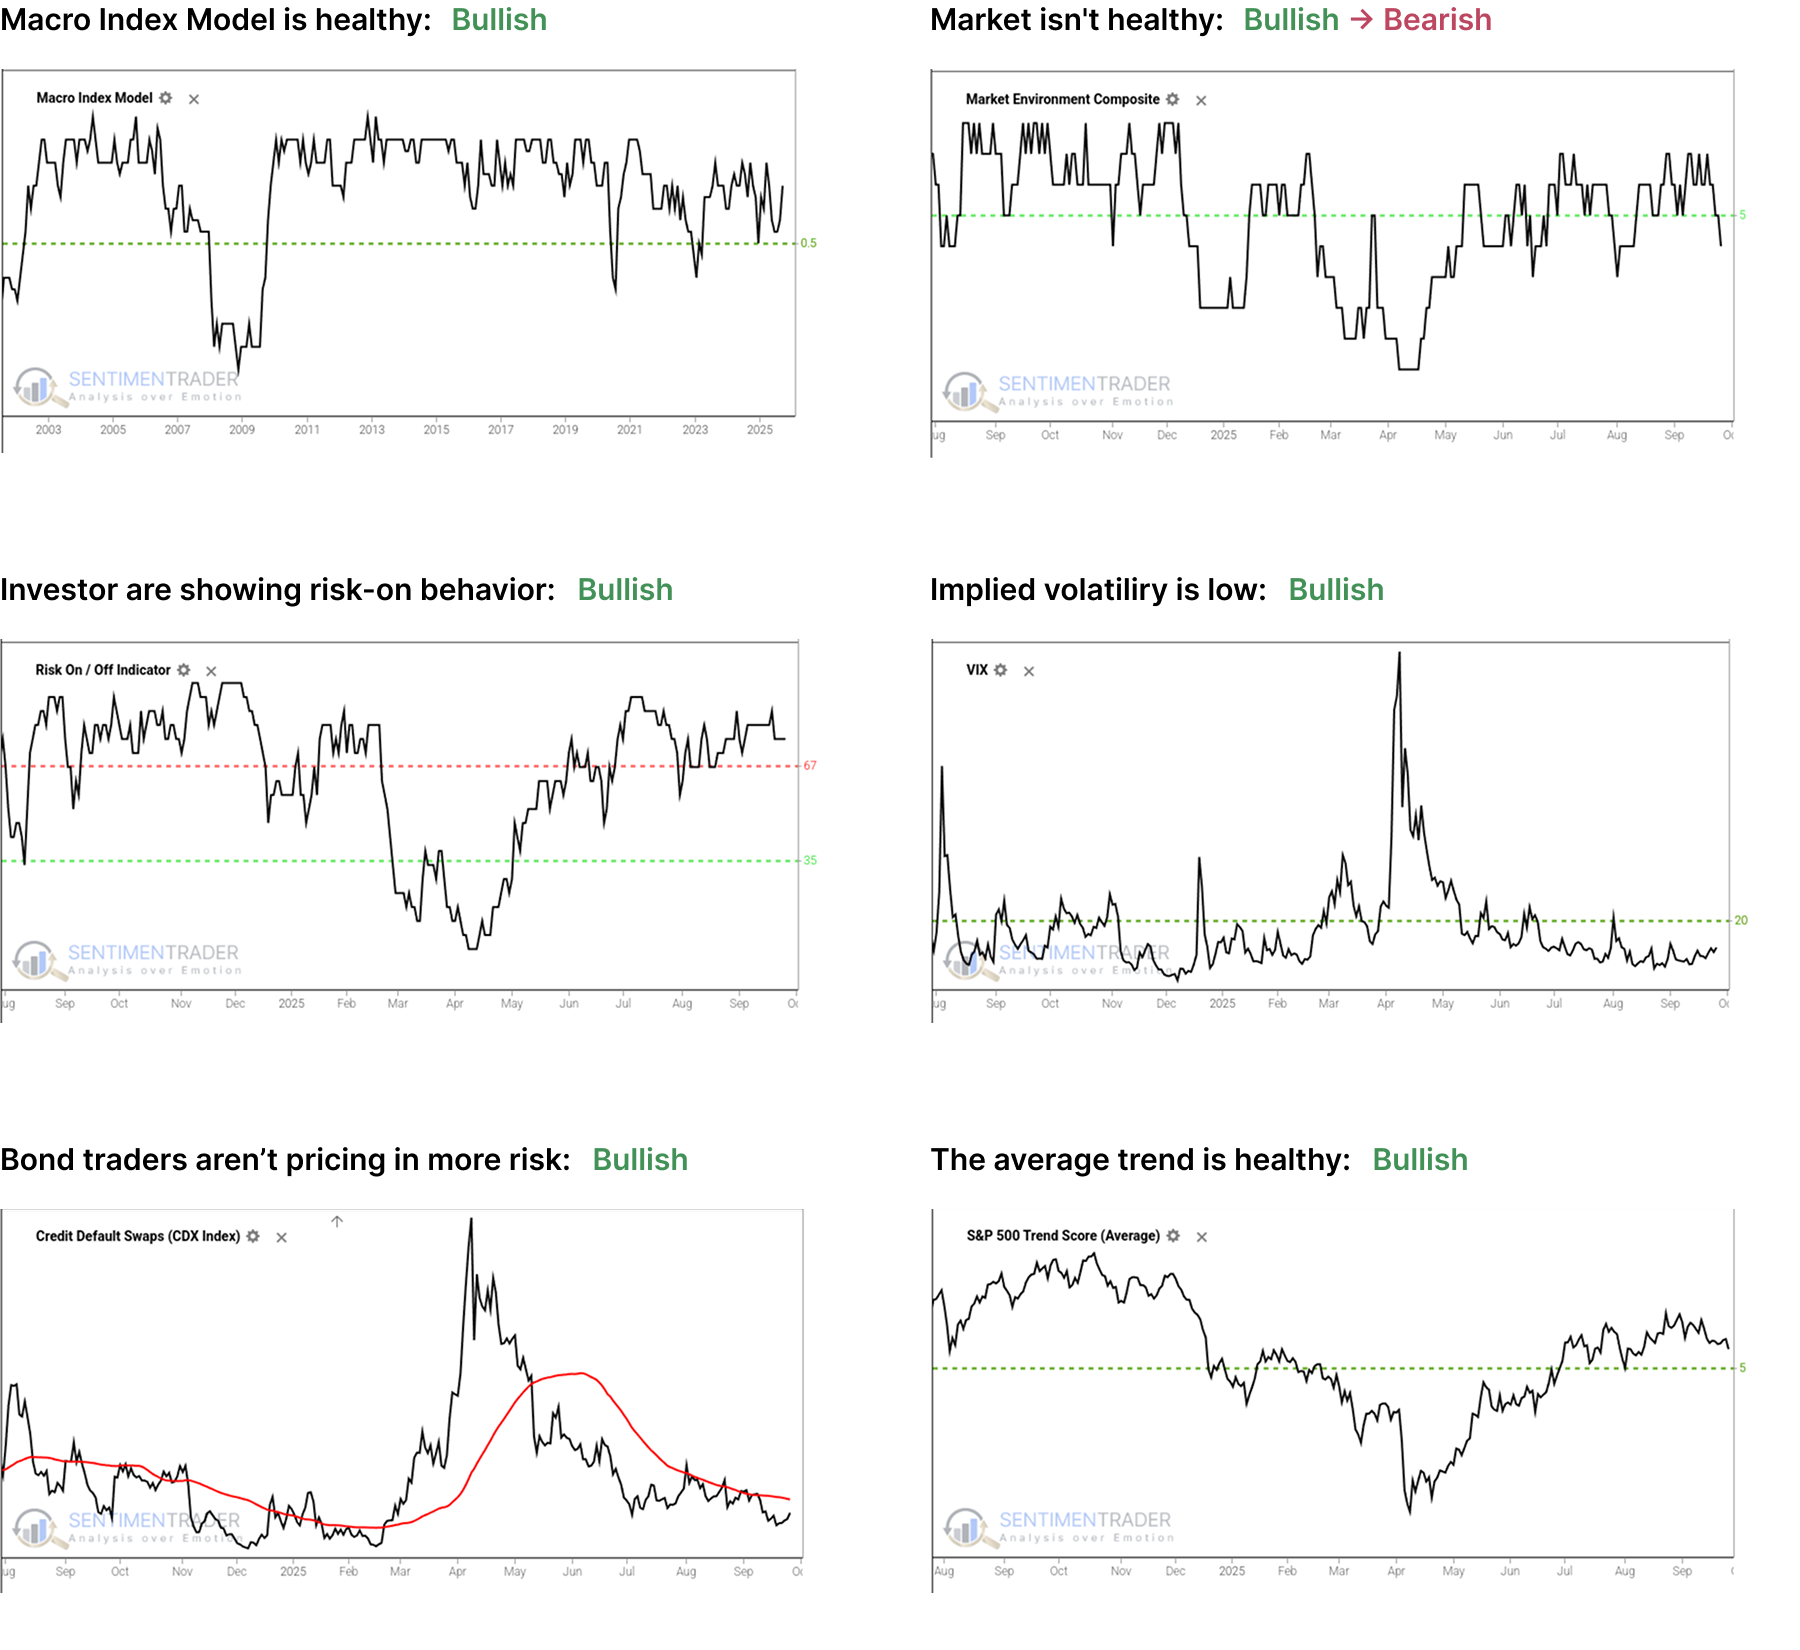
- The Macro Index Model is above the 50% threshold, which has been a vital level as outlined here.
- The Market Environment has been skittish since April, and has slipped into an unhealthy condition. Future returns, especially for higher-beta indices, have historically been notably weaker, with greater risk, when the environment is unhealthy as outlined here.
- The Risk On / Off Indicator shows that investors are still in risk-on mode. This has been a good sign for future returns as outlined here.
- Implied volatility remains below 20, showing a calm environment. The S&P 500 has perfomed well when this is the case as outlined here.
- Credit default swap spreads are below their 50-day moving average, which drastically improves stock returns as outlined here.
- A composite of trend measures in SPY and the average S&P 500 stock remain above 5, which show healthy trend conditions.
Since April, the most compelling studies have had a strongly bullish bias on longer time frames. You can follow these through the Active Studies page. From time to time, when the analysts' studies provide an overwhelming message, it will override the charts above, but there has been no consensus in the studies to suggest overriding the bullish environment.
Other major markets have been mostly rangebound for four months, and there is little among what we follow to suggest a compelling edge either way.
Record highs across major indexes signal broadening market uptrend
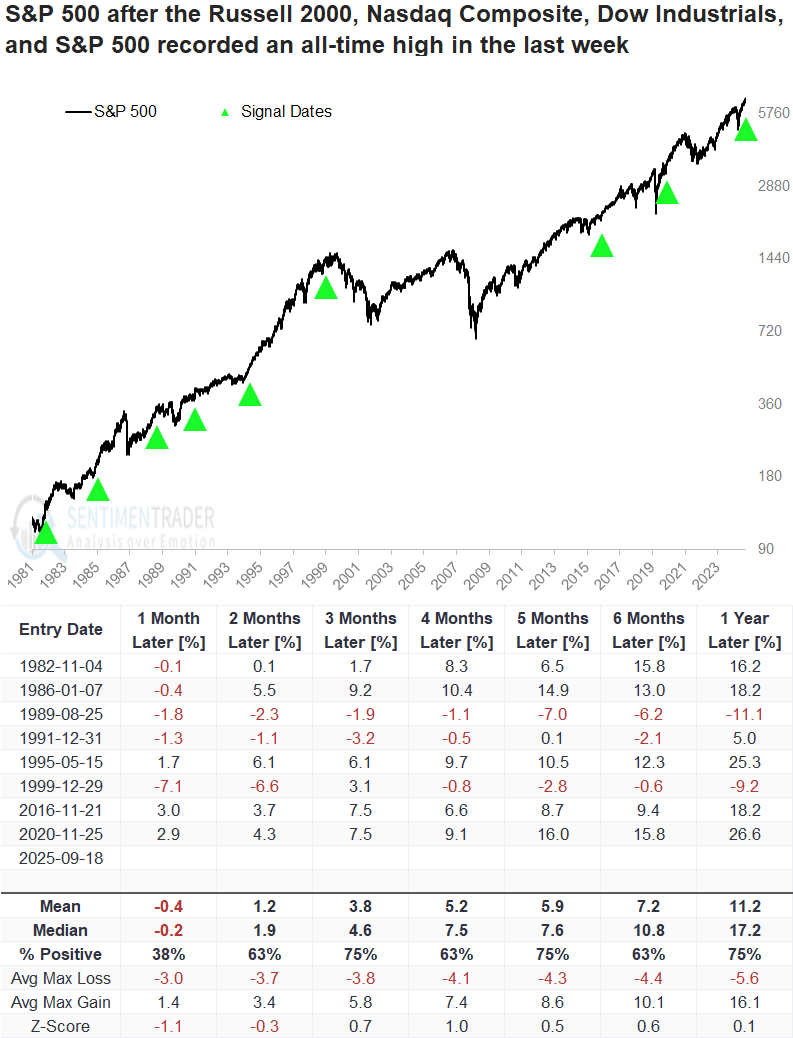
Last week marked a pivotal moment of broad market strength, as the S&P 500, Russell 2000, Nasdaq Composite, and Dow Industrials all closed at record highs together for the first time since 2020, isolating the first instance after a 6-month low in the S&P 500. The synchronized breakout across these four closely watched benchmarks underscores the depth of the rally, with large caps, small caps, growth stocks, and blue chips all participating.
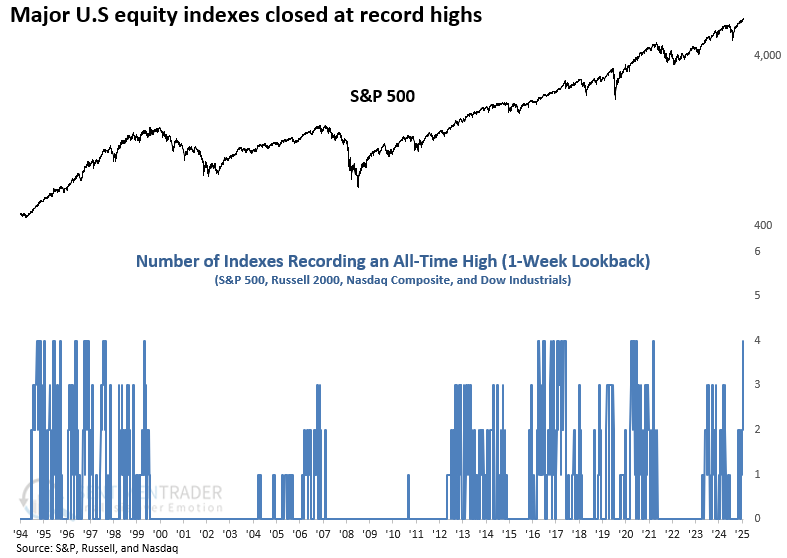
Although the sample size is limited, history shows that when a broad mix of benchmark indexes hit record highs in the same week, the S&P 500 often faltered in the following month before resuming its climb, implying the uptrend in equities has staying power.
Warning signs emerge as sentiment shifts and market breadth weakens
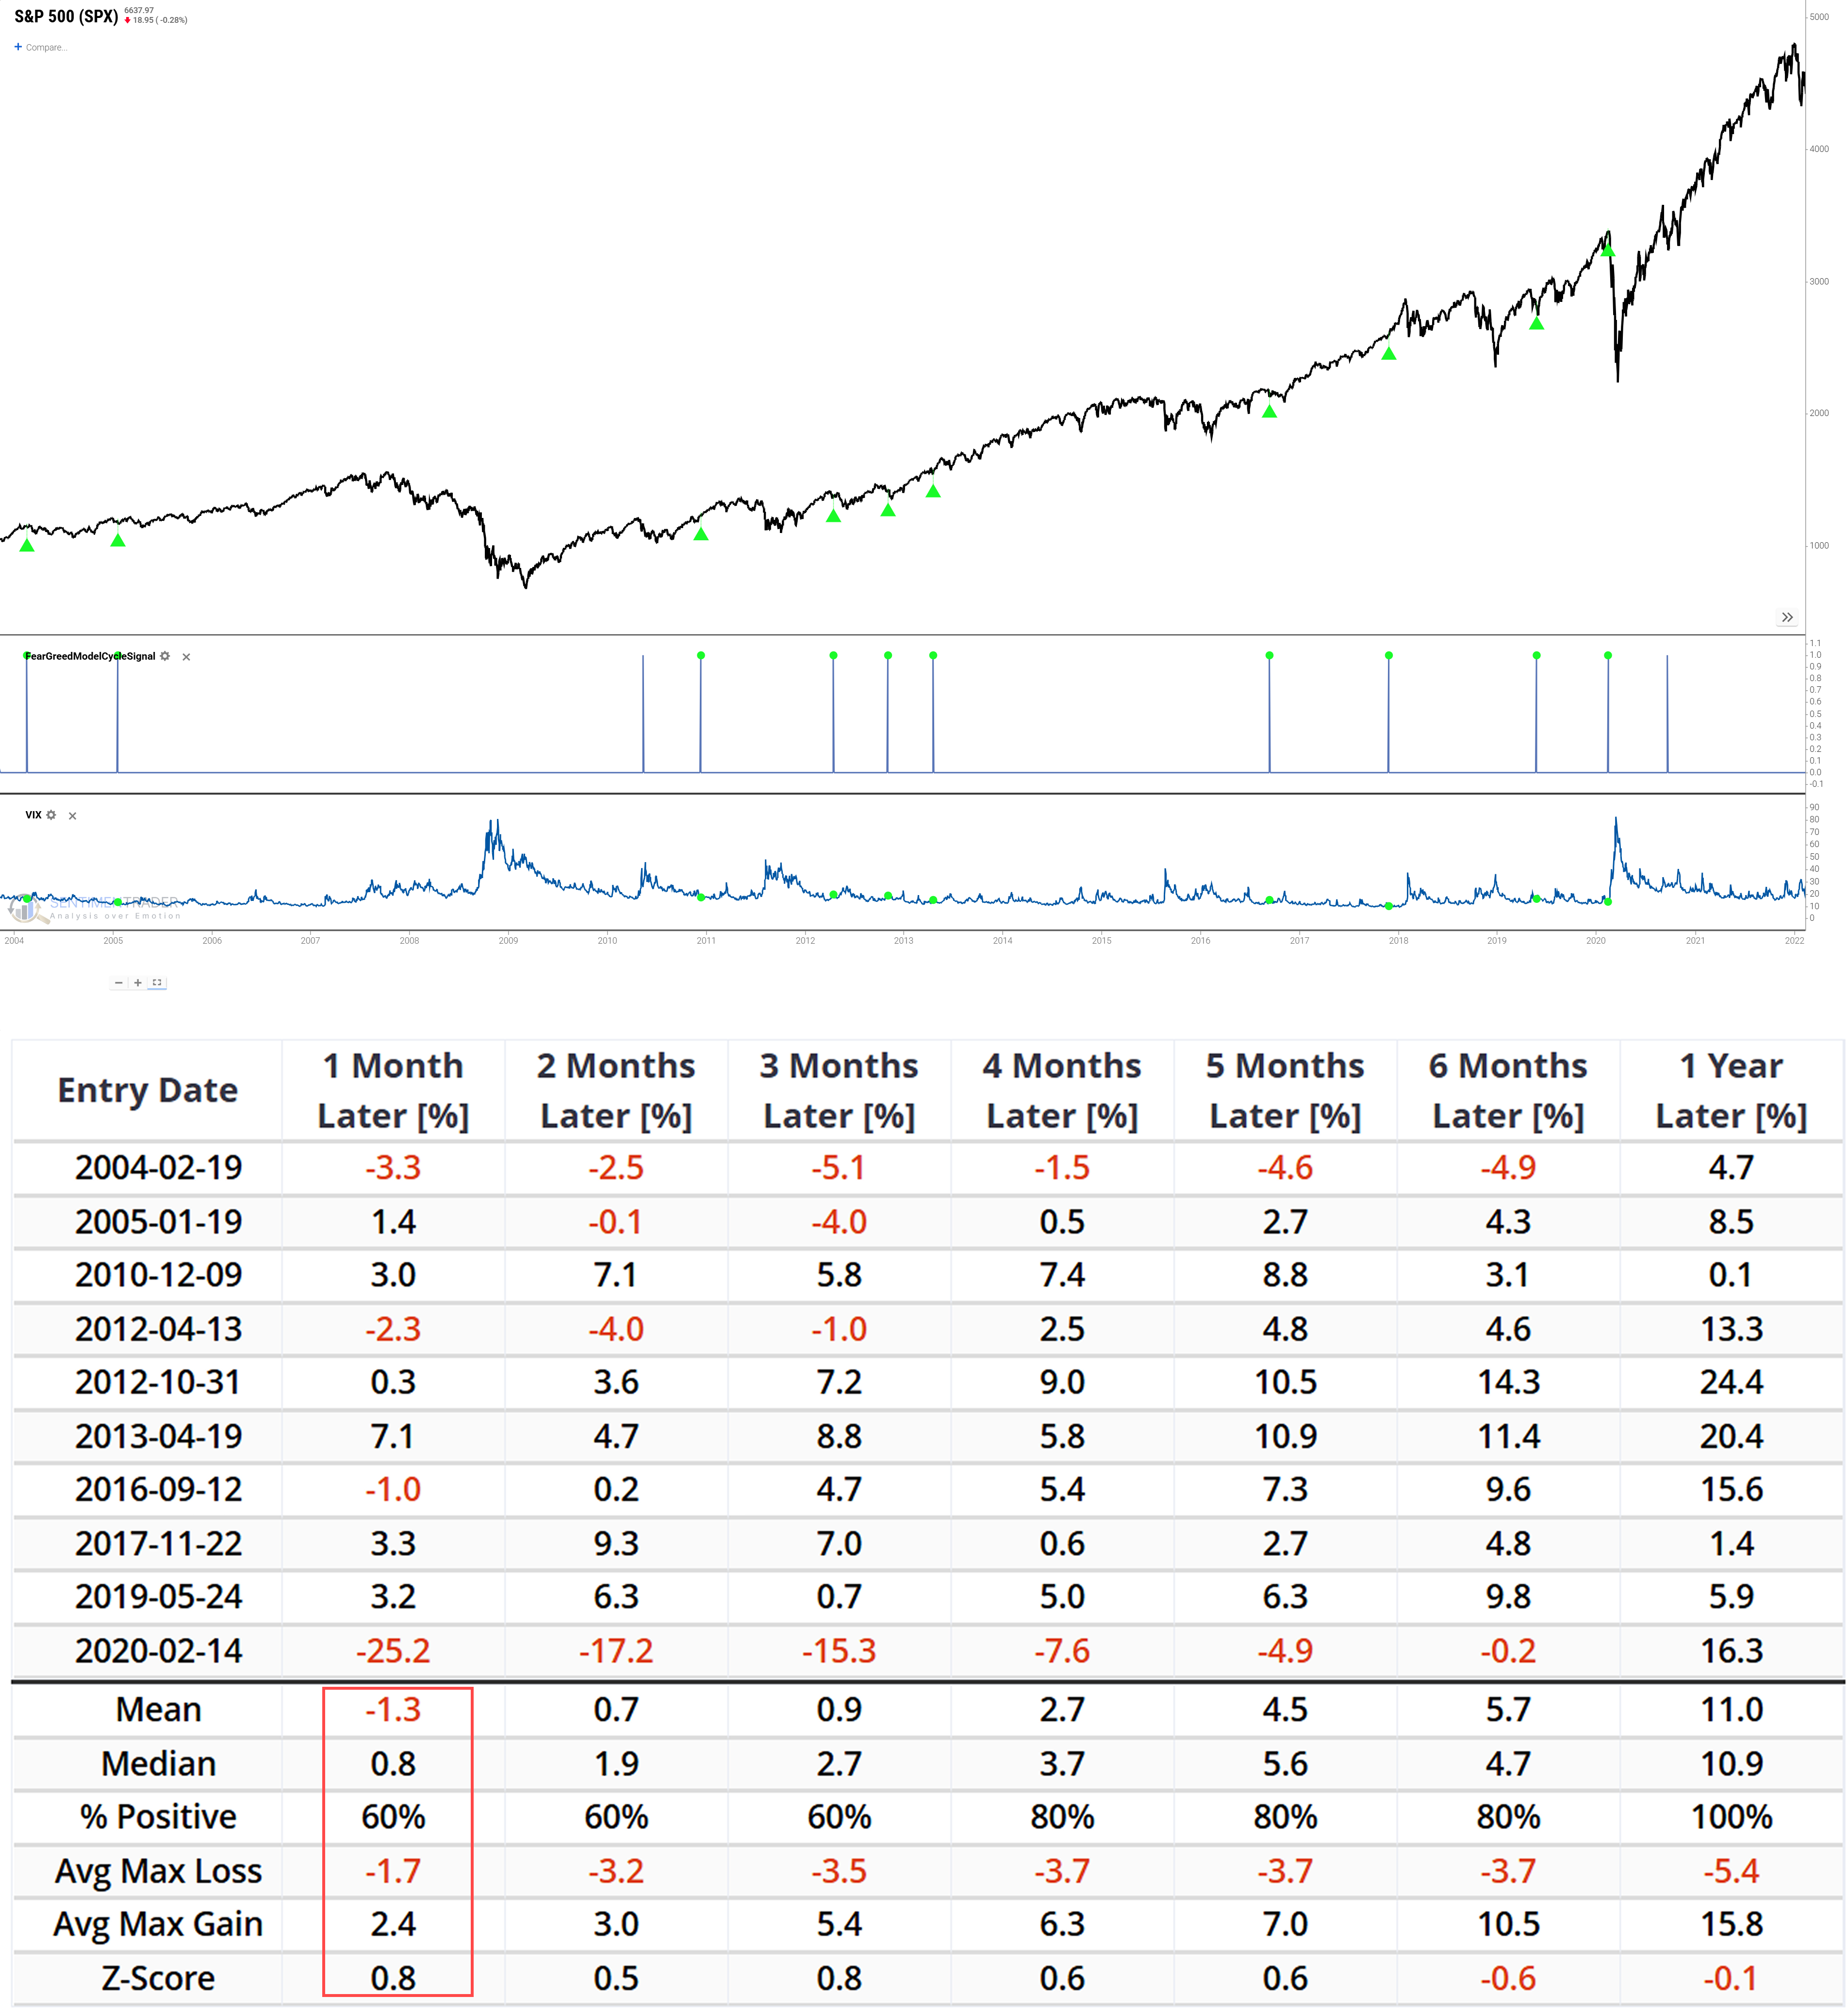
A significant change has occurred in the market's underlying sentiment trend. We are now focusing on the 20-day moving average (20DMA) of the Fear & Greed Model. For this smoother, slower-moving indicator to fall from above 85 to below 65, it requires a prolonged period of extreme greed to be followed by a sustained and significant deterioration in sentiment.

Historical data shows that when this major sentiment breakdown coincides with 'extreme complacency,' the market often falls into a state of hesitation in the short term. The 1-month average return was a weak -1.3%. This suggests the combination of a major sentiment breakdown and high investor complacency is a potent recipe for short-term downside.
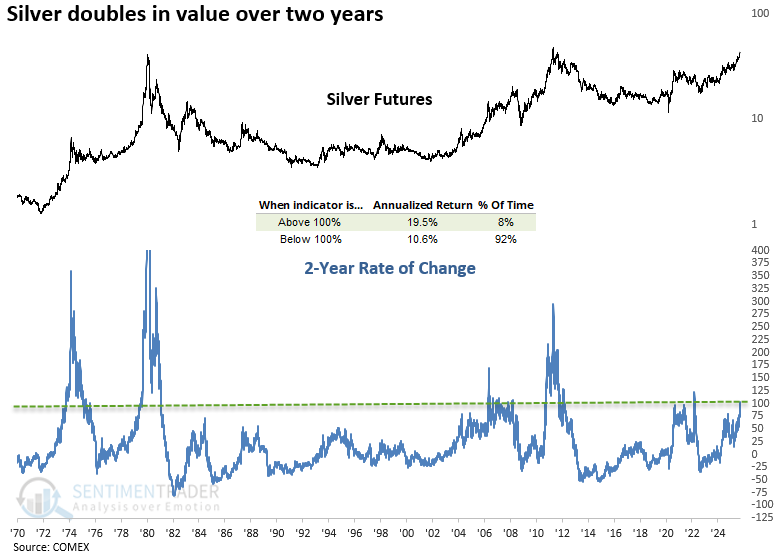
Silver demonstrates characteristics of secular uptrend with strong momentum
Silver's price momentum has been impressive, with the precious metal gaining over 100% in two years for only the sixth time since 1973. Historically, this level of performance has often coincided with secular uptrends in the precious metal. As illustrated in the chart below, readings above 100% have corresponded with annualized returns of 19.5%, notably higher than those observed at lower levels.
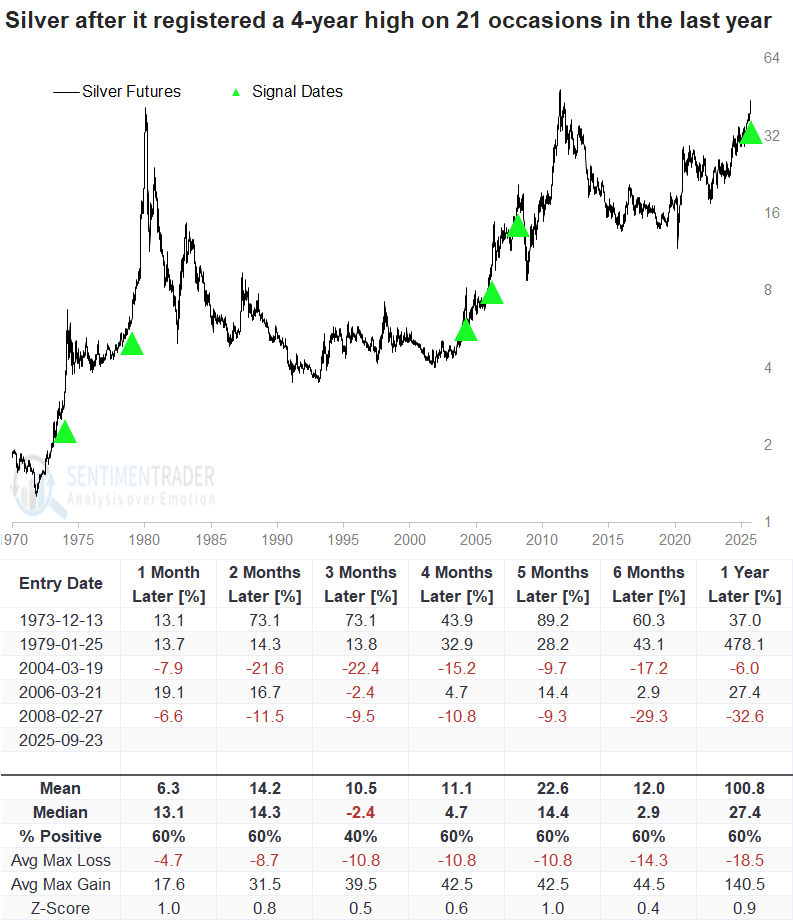
Reinforcing the bull case, silver has registered a 4-year high on 21 separate occasions over the past year, a frequency that points to persistent underlying strength rather than a fleeting rally.
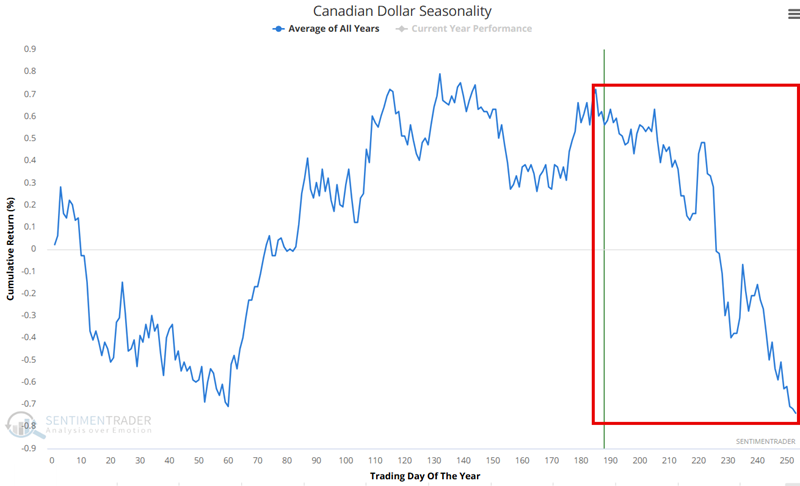
Commodity seasonals highlight Canadian Dollar, Soybeans, Natural Gas, and Sugar opportunities
The Annual Seasonal Trend chart for the Canadian Dollar recently entered an unfavorable period that extends from Trading Day of the Year (TDY) #185 through the end of the year. For 2025, this period extends from September 16th through December 31st.
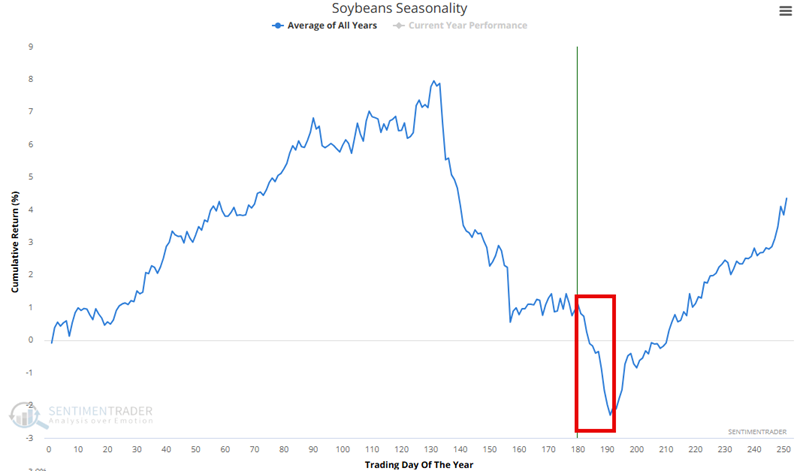
The Annual Seasonal Trend chart for the Soybeans is entering one of its worst historical periods of the year, extending from Trading Day of the Year (TDY) #180 through #191. For 2025, this period extends from September 19th through October 6th.
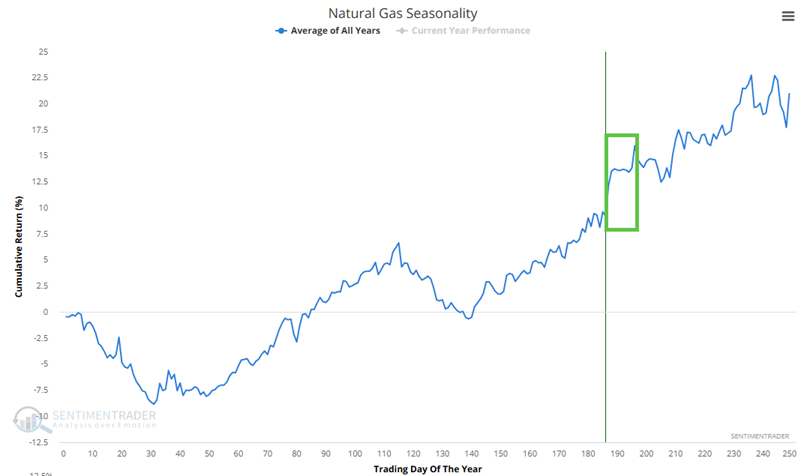
The Annual Seasonal Trend chart for Natural Gas is entering a favorable period, extending from Trading Day of the Year (TDY) #186 through #196. For 2025, this period extends from September 19th through October 3rd.
Equal-weighted versus cap-weighted strategies show performance divergence
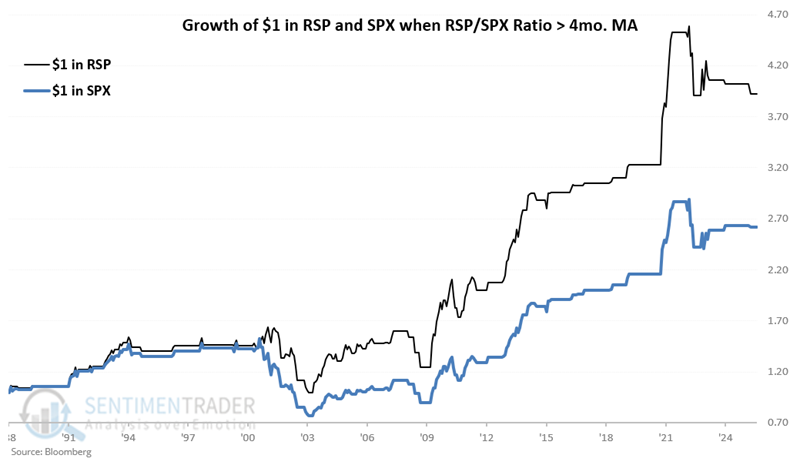
The chart below displays the hypothetical growth of $1 invested in each index, only when the Equal-weighted/Cap-weighted ratio closed the previous month above its 4-month exponential average from January 1988 through August 2025. The Equal-weighted index gained a cumulative 292% while the Cap-weighted gained 162%.
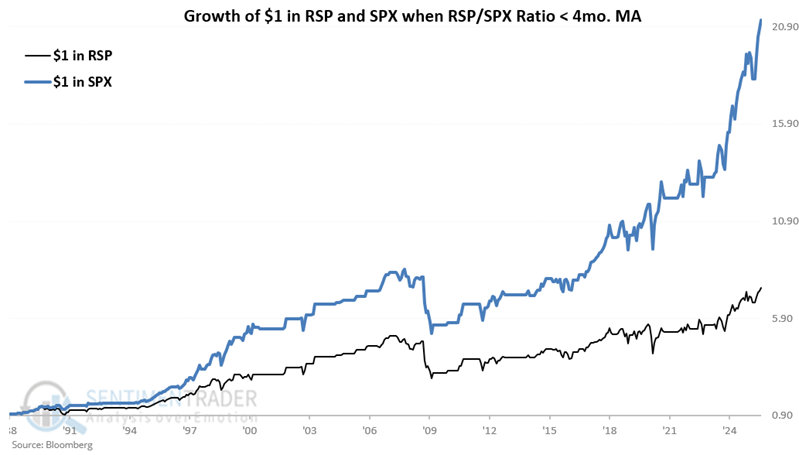
Conversely, the chart below displays the hypothetical growth of $1 invested in each index, only when the Equal-weighted/Cap-weighted ratio closed the previous month below its 4-month exponential average. The Equal-weighted index gained a cumulative 649% while the Cap-weighted index gained 2,023%.
About TradingEdge Weekly...
The goal of TradingEdge Weekly is to summarize some of the research published to SentimenTrader over the past week. Sometimes there is a lot to digest, and this summary highlights the highest conviction or most compelling ideas we discussed. This is NOT the published research; rather, it pulls out some of the most relevant parts. It includes links to the published research for convenience, and if you don't subscribe to those products, it will present the options for access.