
TradingEdge Weekly for Sep 19 - Late-session strength, high-yield bonds, Hang Seng signals, Market Environment Composite, sector highs, Fed rate cuts, healthcare insiders

House view:
- Stocks:
- Short-term: Modestly bearish. The S&P 500 and Nasdaq briefly extended gains following the Federal Reserve's widely expected rate cut, but reversed course as the policy statement struck a neutral tone and the dot plot signaled limited additional easing ahead. This "buy the rumor, sell the news" dynamic reflects market exhaustion after months of pricing in policy support. The rally remains concentrated in a small group of mega-cap tech stocks, with broader market participation declining even as headline indices linger near highs-a technical fragility historically linked to short-term pullbacks. Seasonal headwinds typical of September have emerged, the current cautious sentiment is more driven by the gap between policy expectations and reality, elevated valuations in leading sectors, and prudent positioning ahead of the final stretch of earnings season. Time frame: 1-4 weeks.
- Intermediate-term: No view. Valuations stay elevated relative to historical averages, with long-term metrics still near multi-decade highs despite recent volatility. This is offset by the Federal Reserve's formal shift to an easing cycle, a move that has historically provided a floor for risk assets amid economic uncertainty. Market leadership remains skewed toward growth sectors, while smaller companies continue to underperform a divergence that signals investor skepticism about economic breadth. However, short-term momentum indicators show resilience, with most stocks maintaining positions above their medium-term moving averages, creating tension between technical strength and fundamental concerns. Time frame: 1-5 months.
- Long-term: Bullish. The economic recovery continues to be driven by cyclical sectors, a pattern consistent with sustained expansions. Industries tied to economic growth have demonstrated stronger profitability compared to defensive sectors, indicating underlying resilience. Long-term breadth measures have improved, with most stocks maintaining uptrends above their long-term moving averages-a positive signal for sustained gains. Structural tailwinds from technological investment and monetary easing are expected to support growth over the coming quarters, outweighing near-term valuation pressures. This time frame covers 6-12 months.
- Cyclical momentum: Favors sectors sensitive to interest rates and economic growth, which historically outperform in early easing cycles.
- Defensive resilience: Stable sectors offer lower volatility but limited upside potential in a recovering economy.
- Longer-term: Mean reversion tendencies suggest potential for smaller companies and equal-weight strategies to outperform after periods of mega-cap dominance.
- Bonds: Long-term cycles remain bearish. Historically, September has consistently been one of the weaker seasonal months for the TLT. Since the market landscape shifted in 2020, September's weakness has become even more pronounced, and this sluggish performance often carries over into October. In our analysis of analyst research, we have yet to see significant signs that this trend is changing.
- Commodities: Signs point to a probable secular bull market following recent strength across subsectors. An effective commodity trend model remains bullish. Gold (especially gold miners) briefly extended gains near all-time highs after the Fed's decision, supported by central bank buying and safe-haven demand, defying its historical pattern of struggling to sustain extended rallies. Oil faces seasonal headwinds but has shown resilience following a sharp inventory drawdown; speculative short positioning has reached extremes that have historically preceded rebounds in recent years. Industrial metals benefit from infrastructure stimulus and technological investment trends, with particular strength in sectors tied to digital transformation.
- Crypto: We follow several simple systems for bitcoin, which we consider the equivalent of the S&P 500 for crypto. Due to bitcoin's explosive growth over long periods, it's dangerous to equate neutral conditions with being bearish for some of these. However, if a system is "out," we consider it bearish for this summary.
- Triple 40: Bullish
- RSI Momentum: Bullish
- Trend and Relative Trend: Modestly Bullish
- PMI: Bearish
- M2 ROC: Bullish
Where we're at
Most investors have the most riding on equities. We feel that the most significant determinants of success for investors are whether to adjust their allocation to that asset class based on factors that have historically had a good record of preceding above- or below-random returns in the months ahead.
Those factors include the probability of a looming recession, sentiment, price action, volatility, breadth, and the bond market. The chart below summarizes the main indicators and composite models we watch for those factors, and they're mostly in bullish regimes. Valuations are not part of these factors since the relationship has been too inconsistent on time frames under one year.
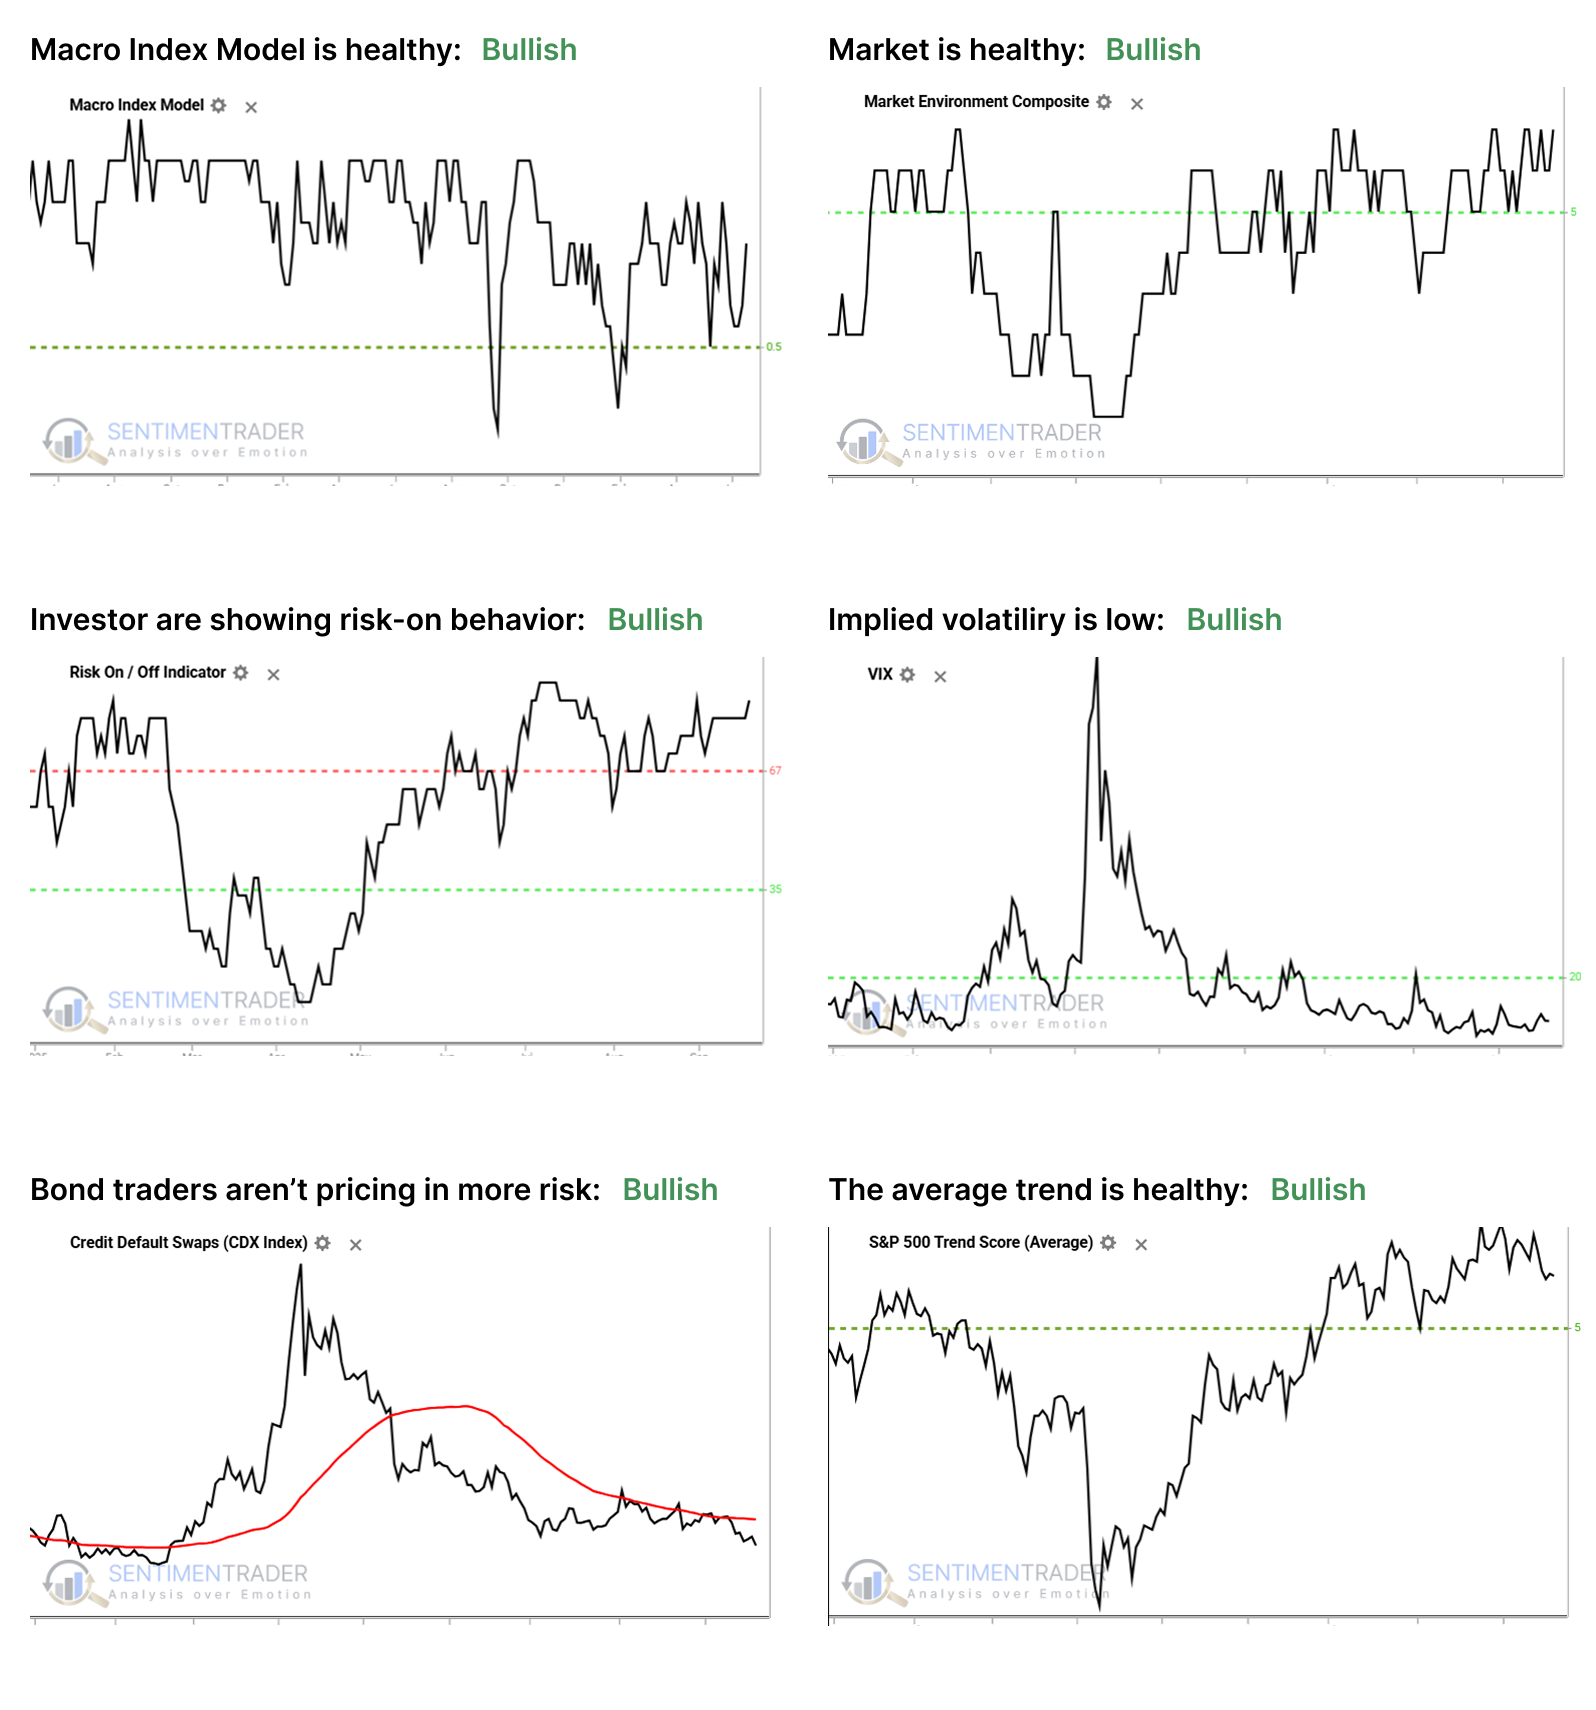
- The Macro Index Model is above the 50% threshold, which has been a vital level as outlined here.
- The Market Environment has been skittish since April, but is currently healthy. Future returns, especially for higher-beta indices, has been markedly better, with less risk, when the environment is healthy as outlined here.
- The Risk On / Off Indicator shows that investors are still in risk-on mode. This has been a good sign for future returns as outlined here.
- Implied volatility remains below 20, showing a calm environment. The S&P 500 has perfomed well when this is the case as outlined here.
- Credit default swap spreads are below their 50-day moving average, which drastically improves stock returns as outlined here.
- A composite of trend measures in SPY and the average S&P 500 stock remain above 5, which show healthy trend conditions.
Since April, the most compelling studies have had a strongly bullish bias on longer time frames. You can follow these through the Active Studies page. From time to time, when the analysts' studies provide an overwhelming message, it will override the charts above, but there has been no consensus in the studies to suggest overriding the bullish environment.
Other major markets have been mostly rangebound for four months, and there is little among what we follow to suggest a compelling edge either way.
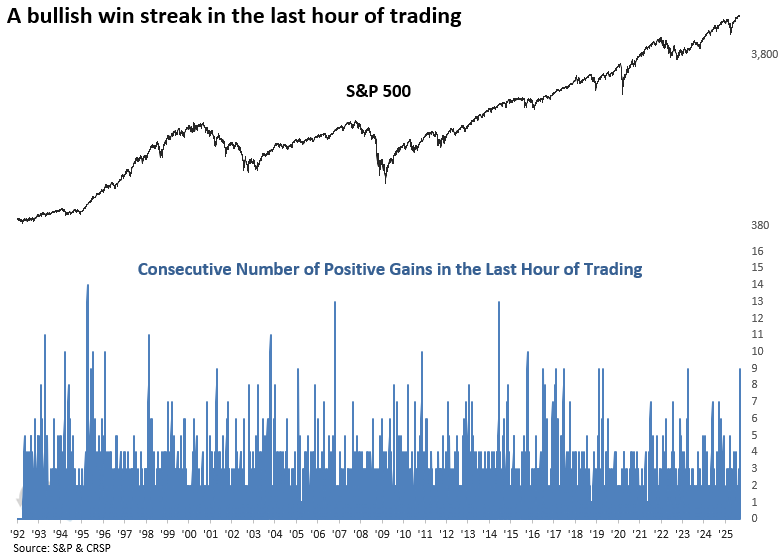
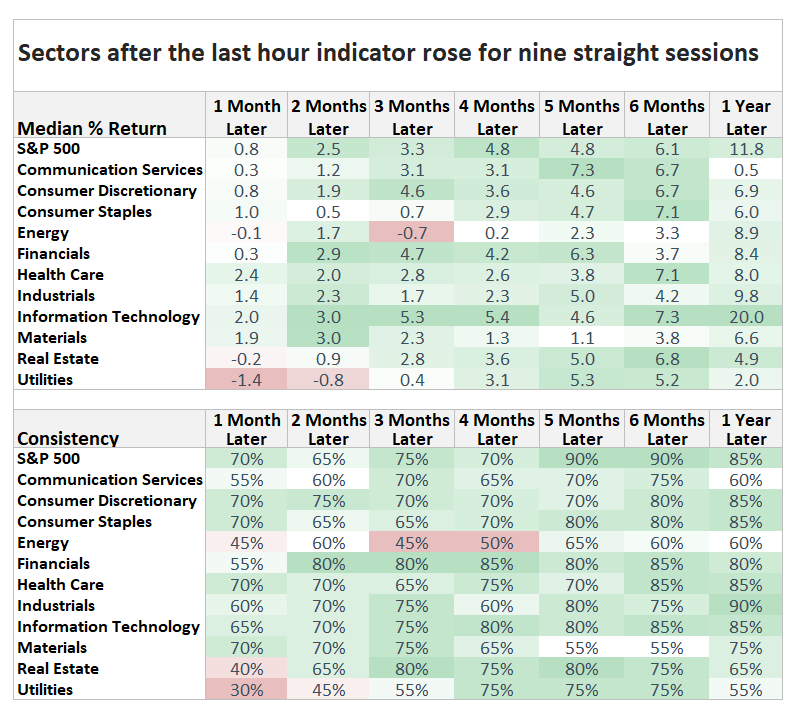
Sustained buying pressure in the last hour of trading
The final hour of trading has shown consistent buying interest, with this critical period of the day displaying a gain for nine consecutive sessions -a streak not seen since April 2023, when equities were recovering from the 2022 bear market.
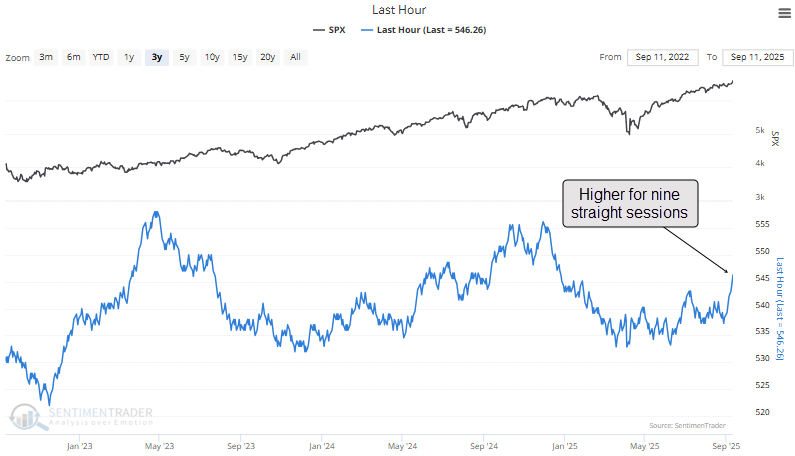
Since 1992, win streaks lasting nine sessions or longer have occurred in fewer than 1% of trading sessions, underscoring rare and persistent late day buying pressure.
Whenever the last hour indicator rose for nine straight sessions, the S&P 500 displayed solid returns and consistency, suggesting the uptrend in stocks is likely to persist.
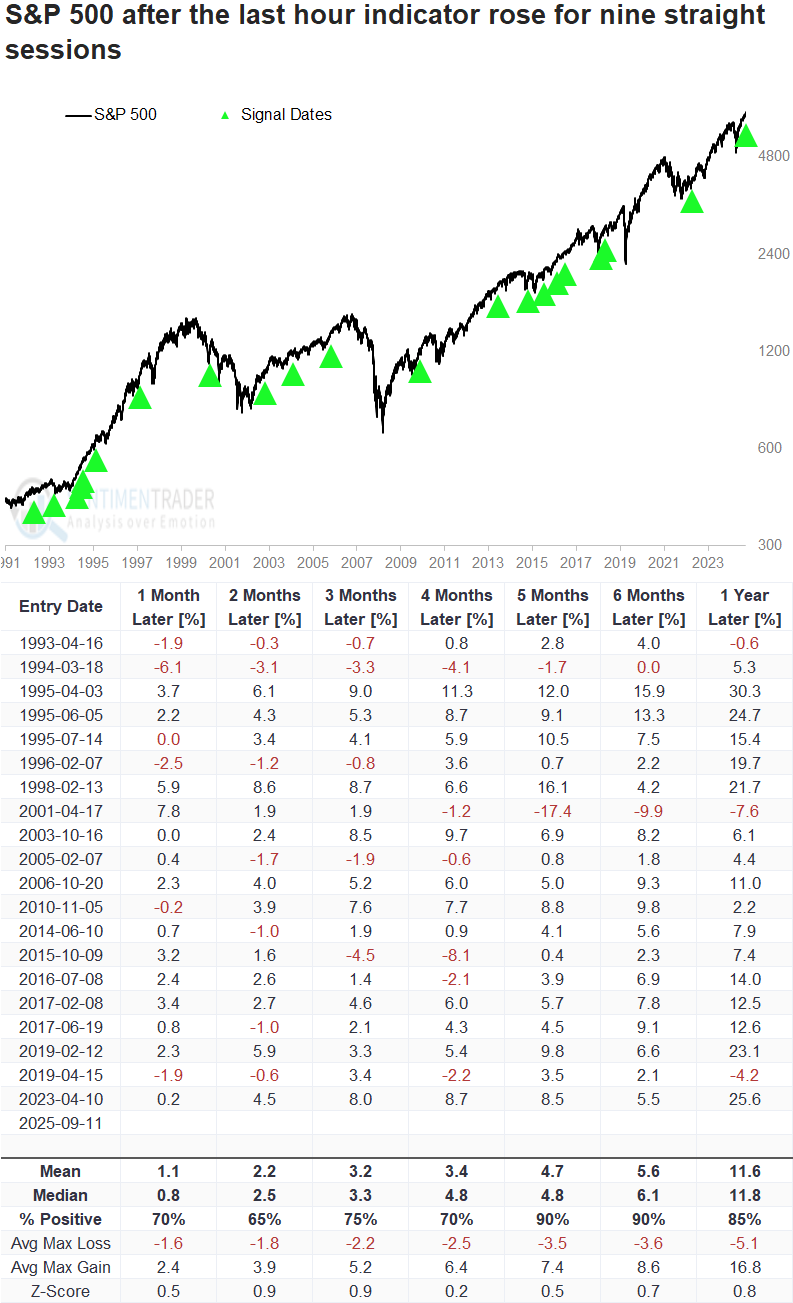
The technology sector outperformed the broad market in 6 out of 7 horizons, suggesting investors should stick with this group as it continues to exhibit leadership status in the current uptrend.
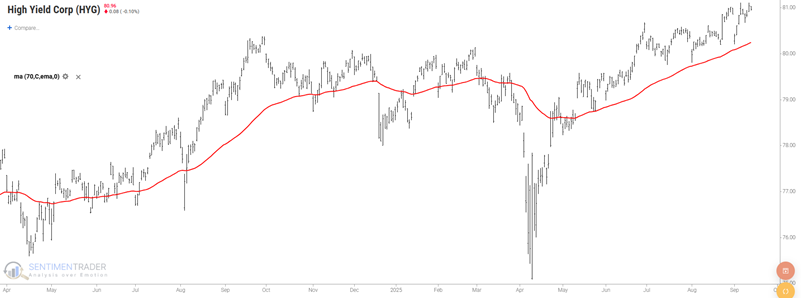
High-yield bonds face seasonal weakness despite uptrend
The chart below shows that the iShares iBoxx $ High Yield Corporate Bond ETF (HYG) is trading in an uptrend, well off the April lows and firmly above its 70-day exponential.
The High-Yield Bond NH-NL is above +500. While this indicates current strength in the high-yield sector, there is a history of short-term weakness following readings of +500 or more.
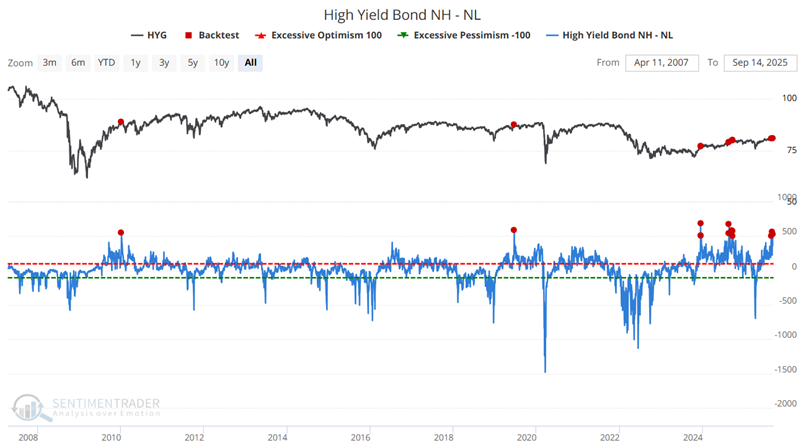
For 2025, this period extends from the close of September 18th through October 3rd.
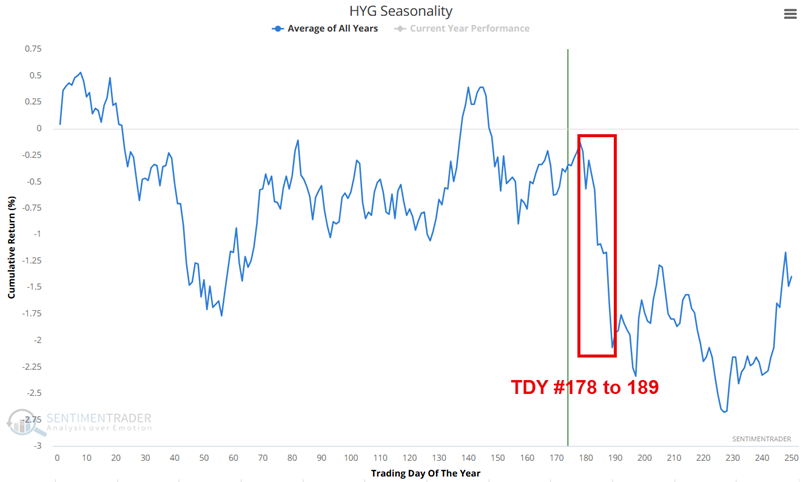
The primary point is to hold off on any new buying until the end of the seasonal period, and to look at any decline between now and then as a potential buying opportunity.
Positive signals emerge for the Hang Seng Index despite short-term volatility risks
Market breadth has expanded extremely recently. We once again observed that over 90% of HSI constituents are trading above their 200-day MA, while more than 75% are above their 50-day MA and more than 80% are above their 10-day MA.
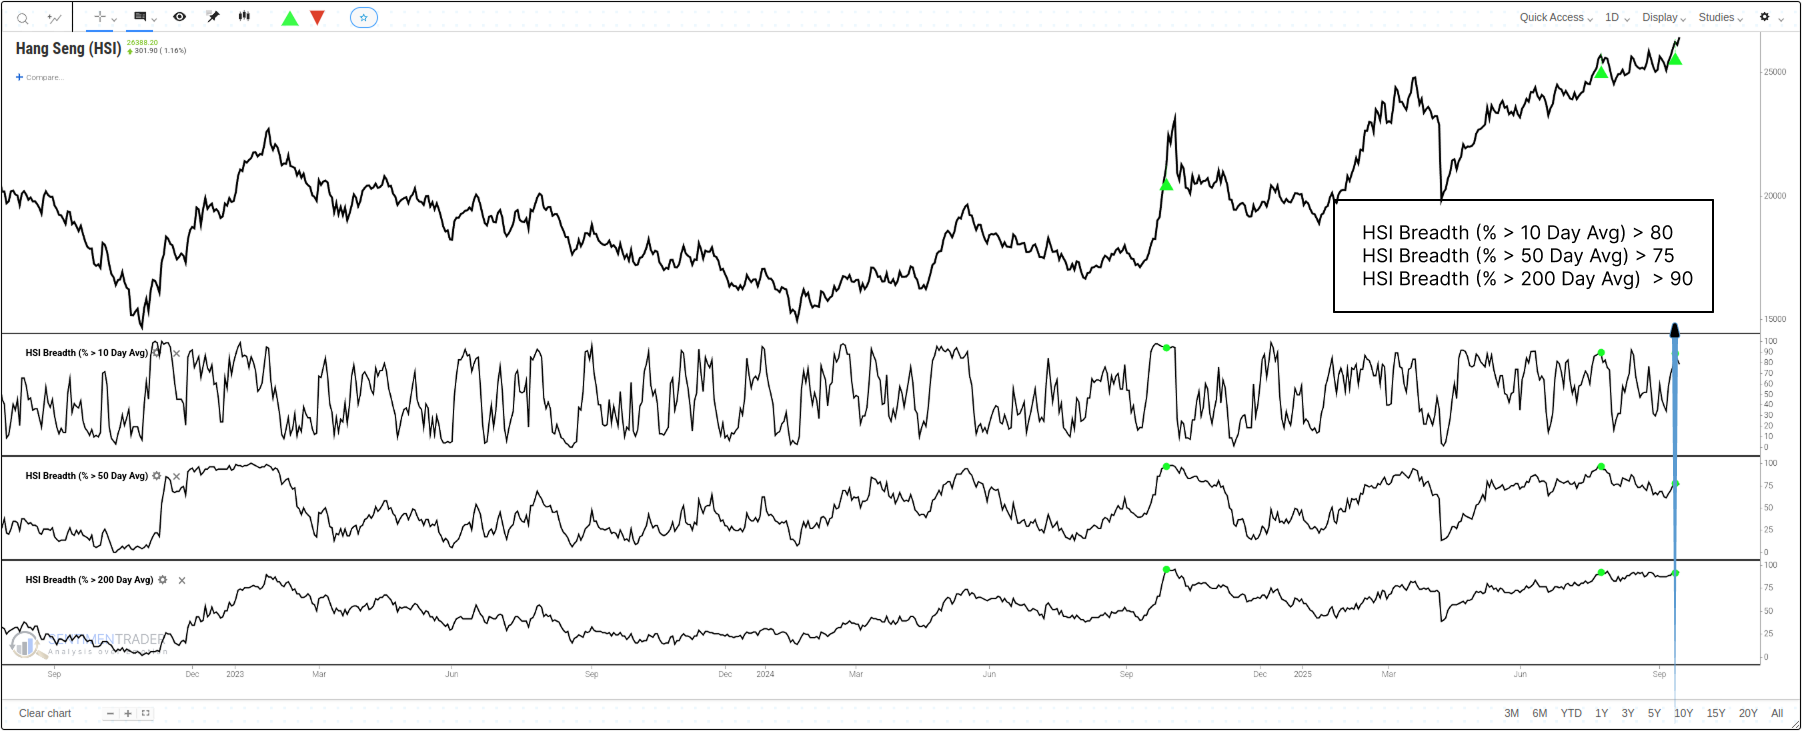
A more robust internal consolidation model (A/D Line signal) suggests the market may be in a state with favorable historical mid-term return expectations.
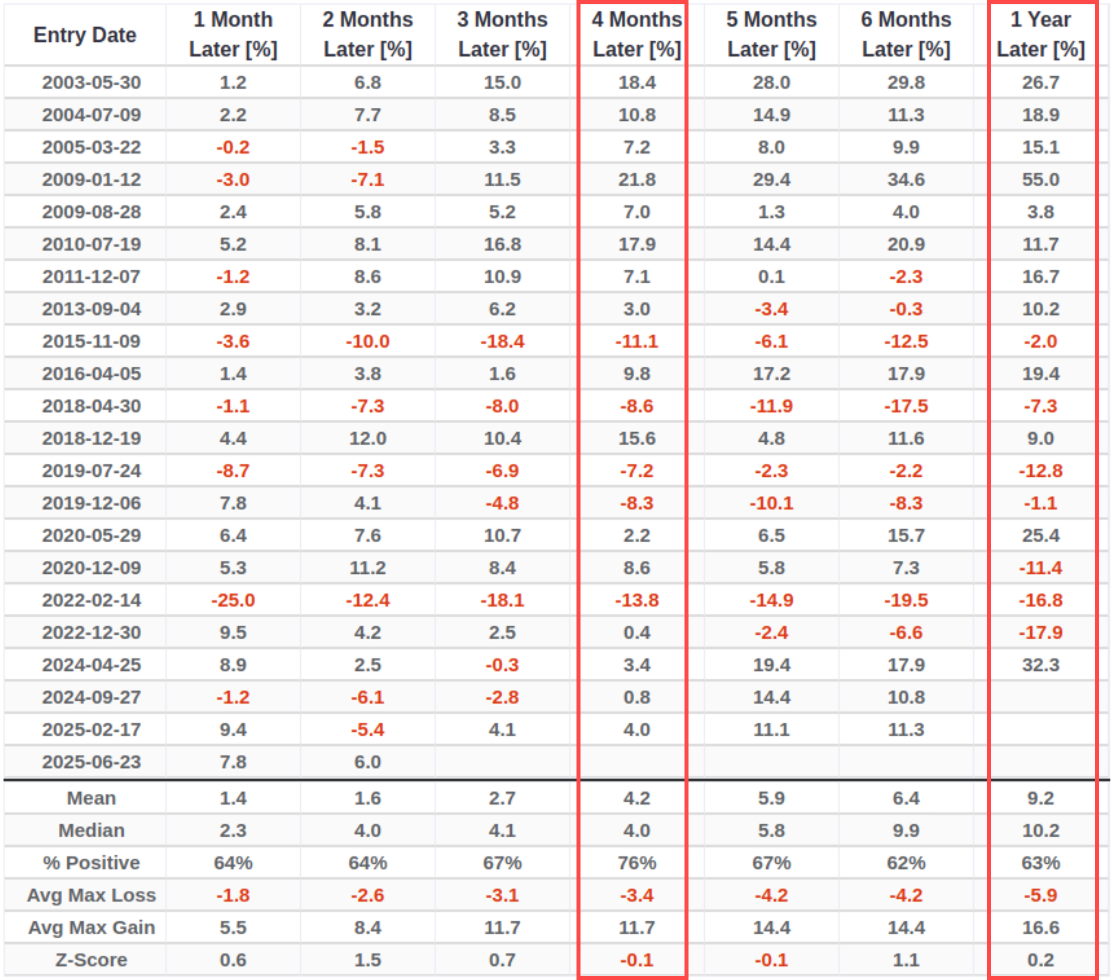
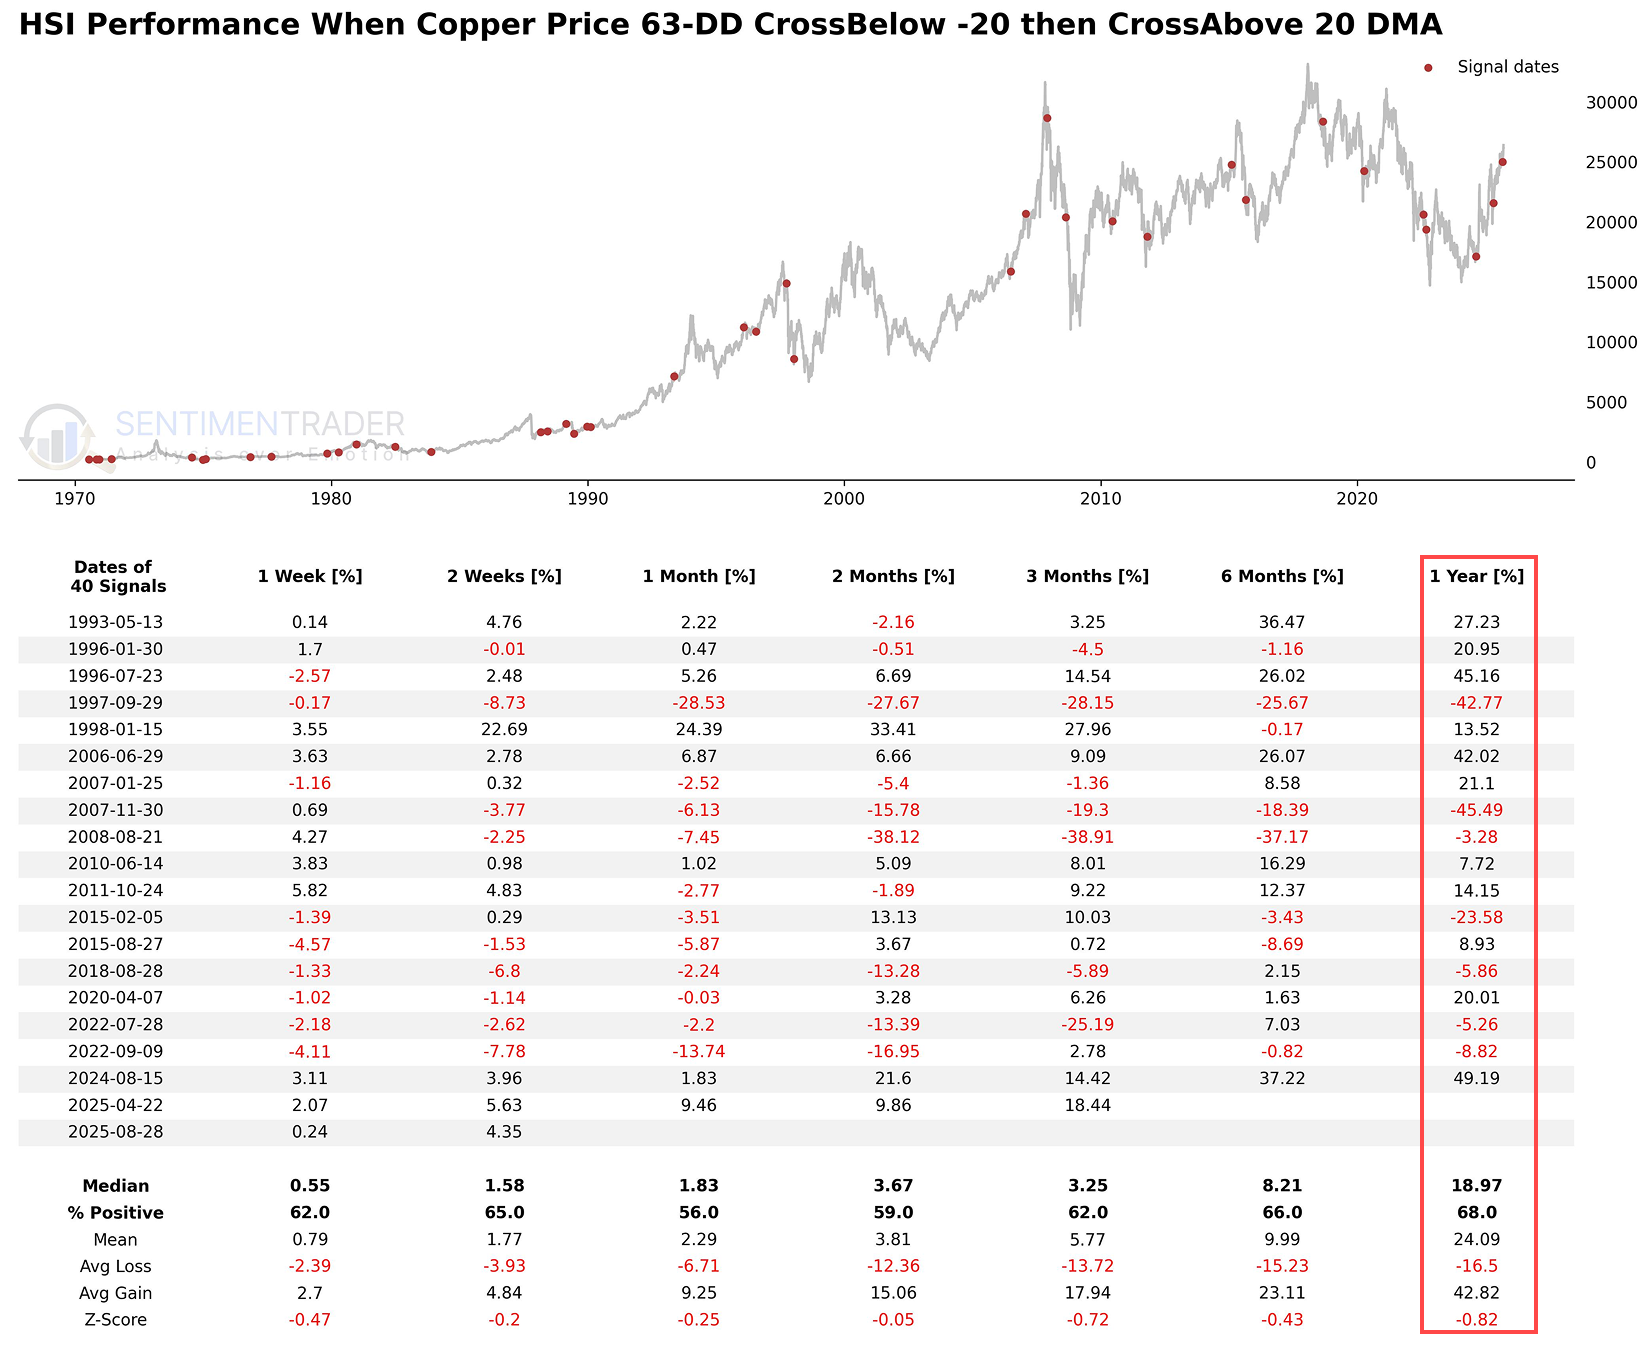
Historical data shows that the emergence of this signal has often correlated with positive performance of the HSI. After copper prices send this signal, the median 1-year return of the HSI reaches +18.97% with a win rate of 68%.
Market Environment Composite reveals longer-term trend confirmation
The Market Environment Composite (MEC) is a set of eight key metrics that provide a snapshot of the overall market condition. These indicators track various aspects of market behavior, such as stock price movements, breadth, and market internals, to help investors assess whether the market is healthy or unhealthy.
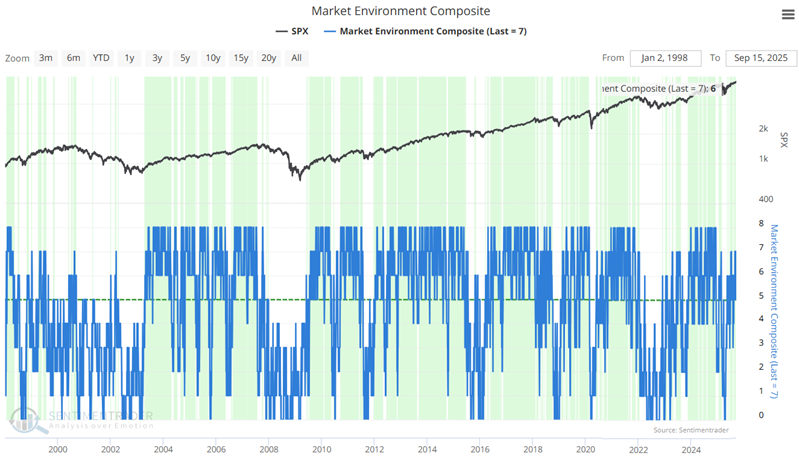
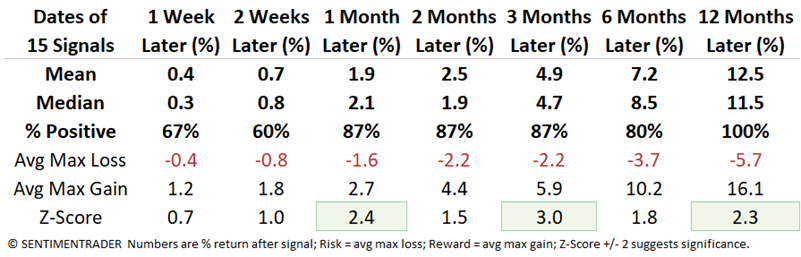
The chart below highlights all dates (including overlaps) when the MEC's 100-day average crossed above 5. The most recent signal occurred on September 12th.
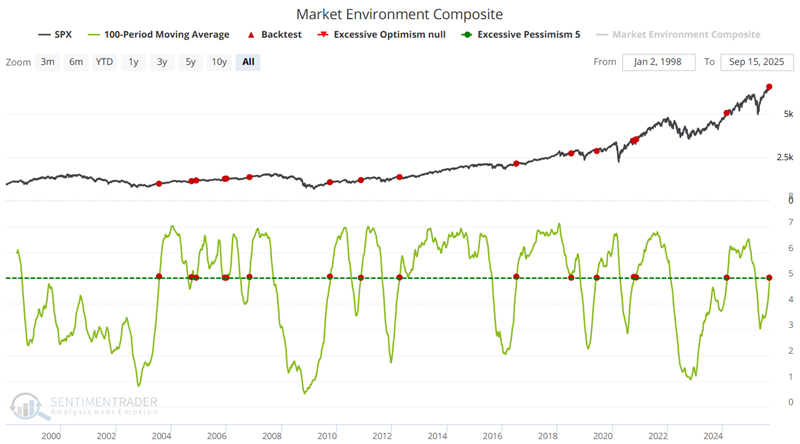
The key point is the 80%+ Win Rates for one-month to one-year timeframes.
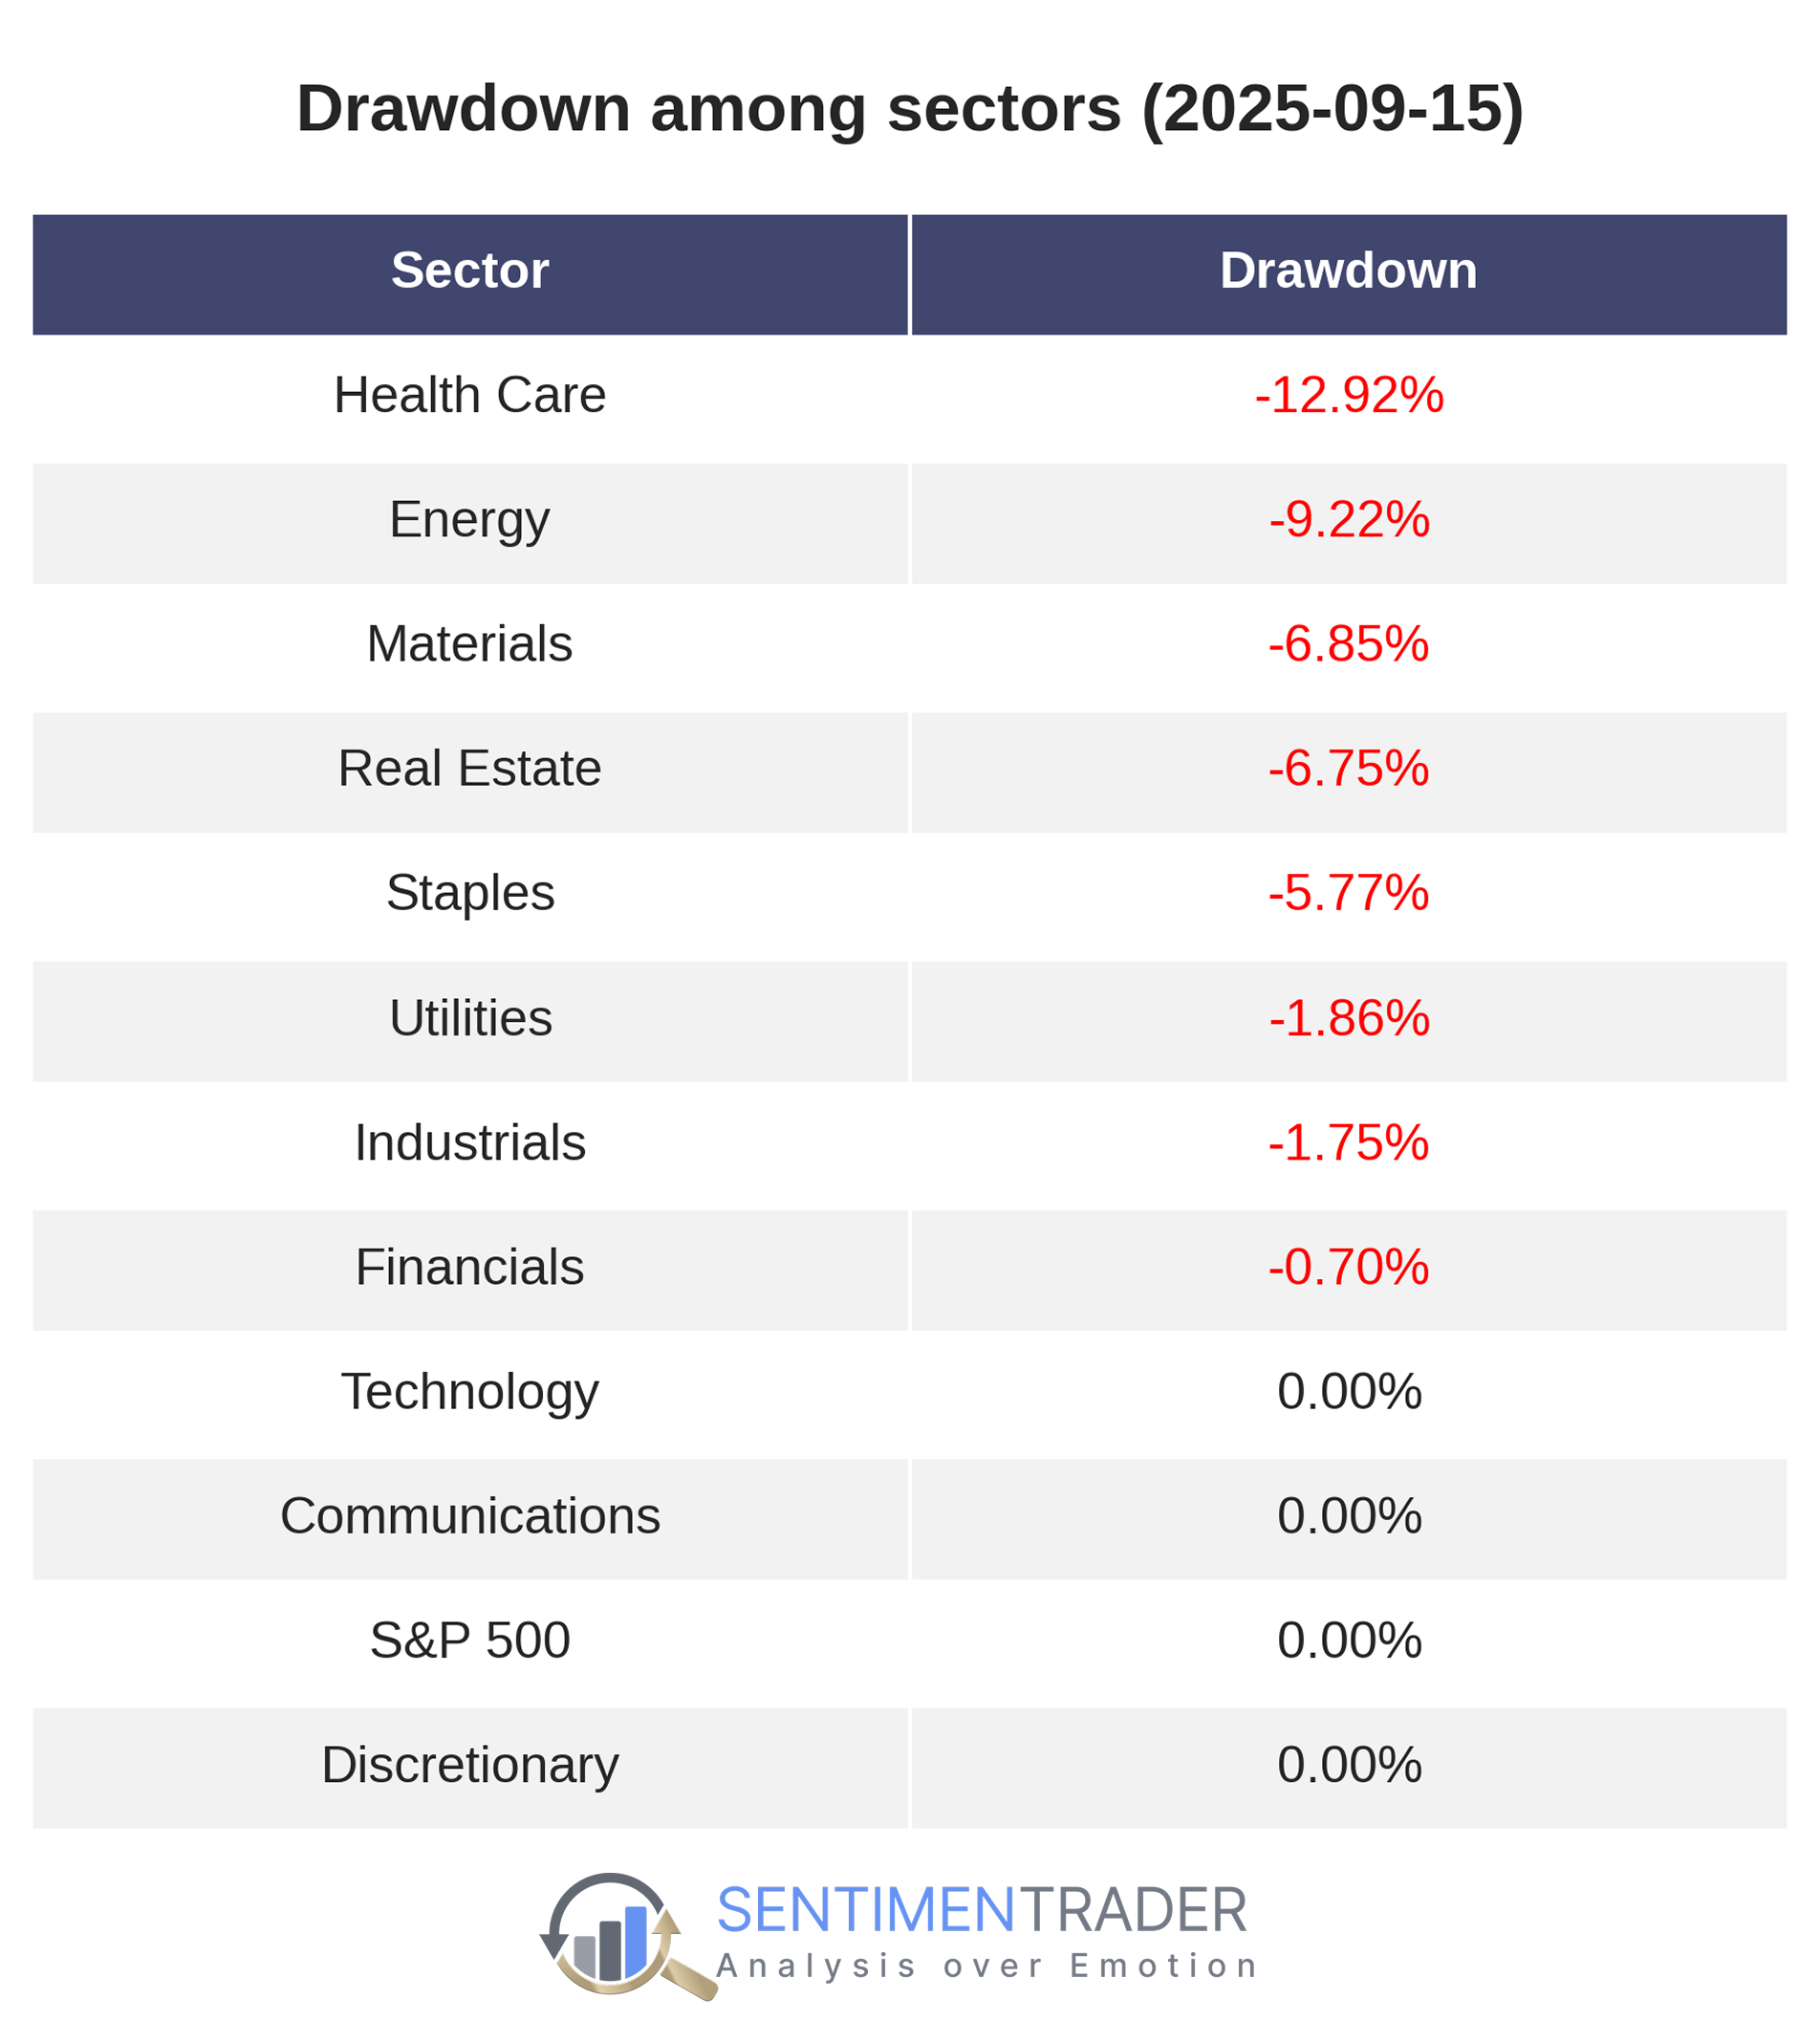
Multiple sectors hitting new highs simultaneously suggest broad-based rally
Beyond the index itself, three crucial leading sectors-Technology (XLK), Communications (XLC), and Consumer Discretionary (XLY)-also reached historical peaks simultaneously.
The scatter plot below shows that when only a few sectors (0-2) participate in the breakthrough, the one-year forward return distribution is highly dispersed, including cases of substantial losses.
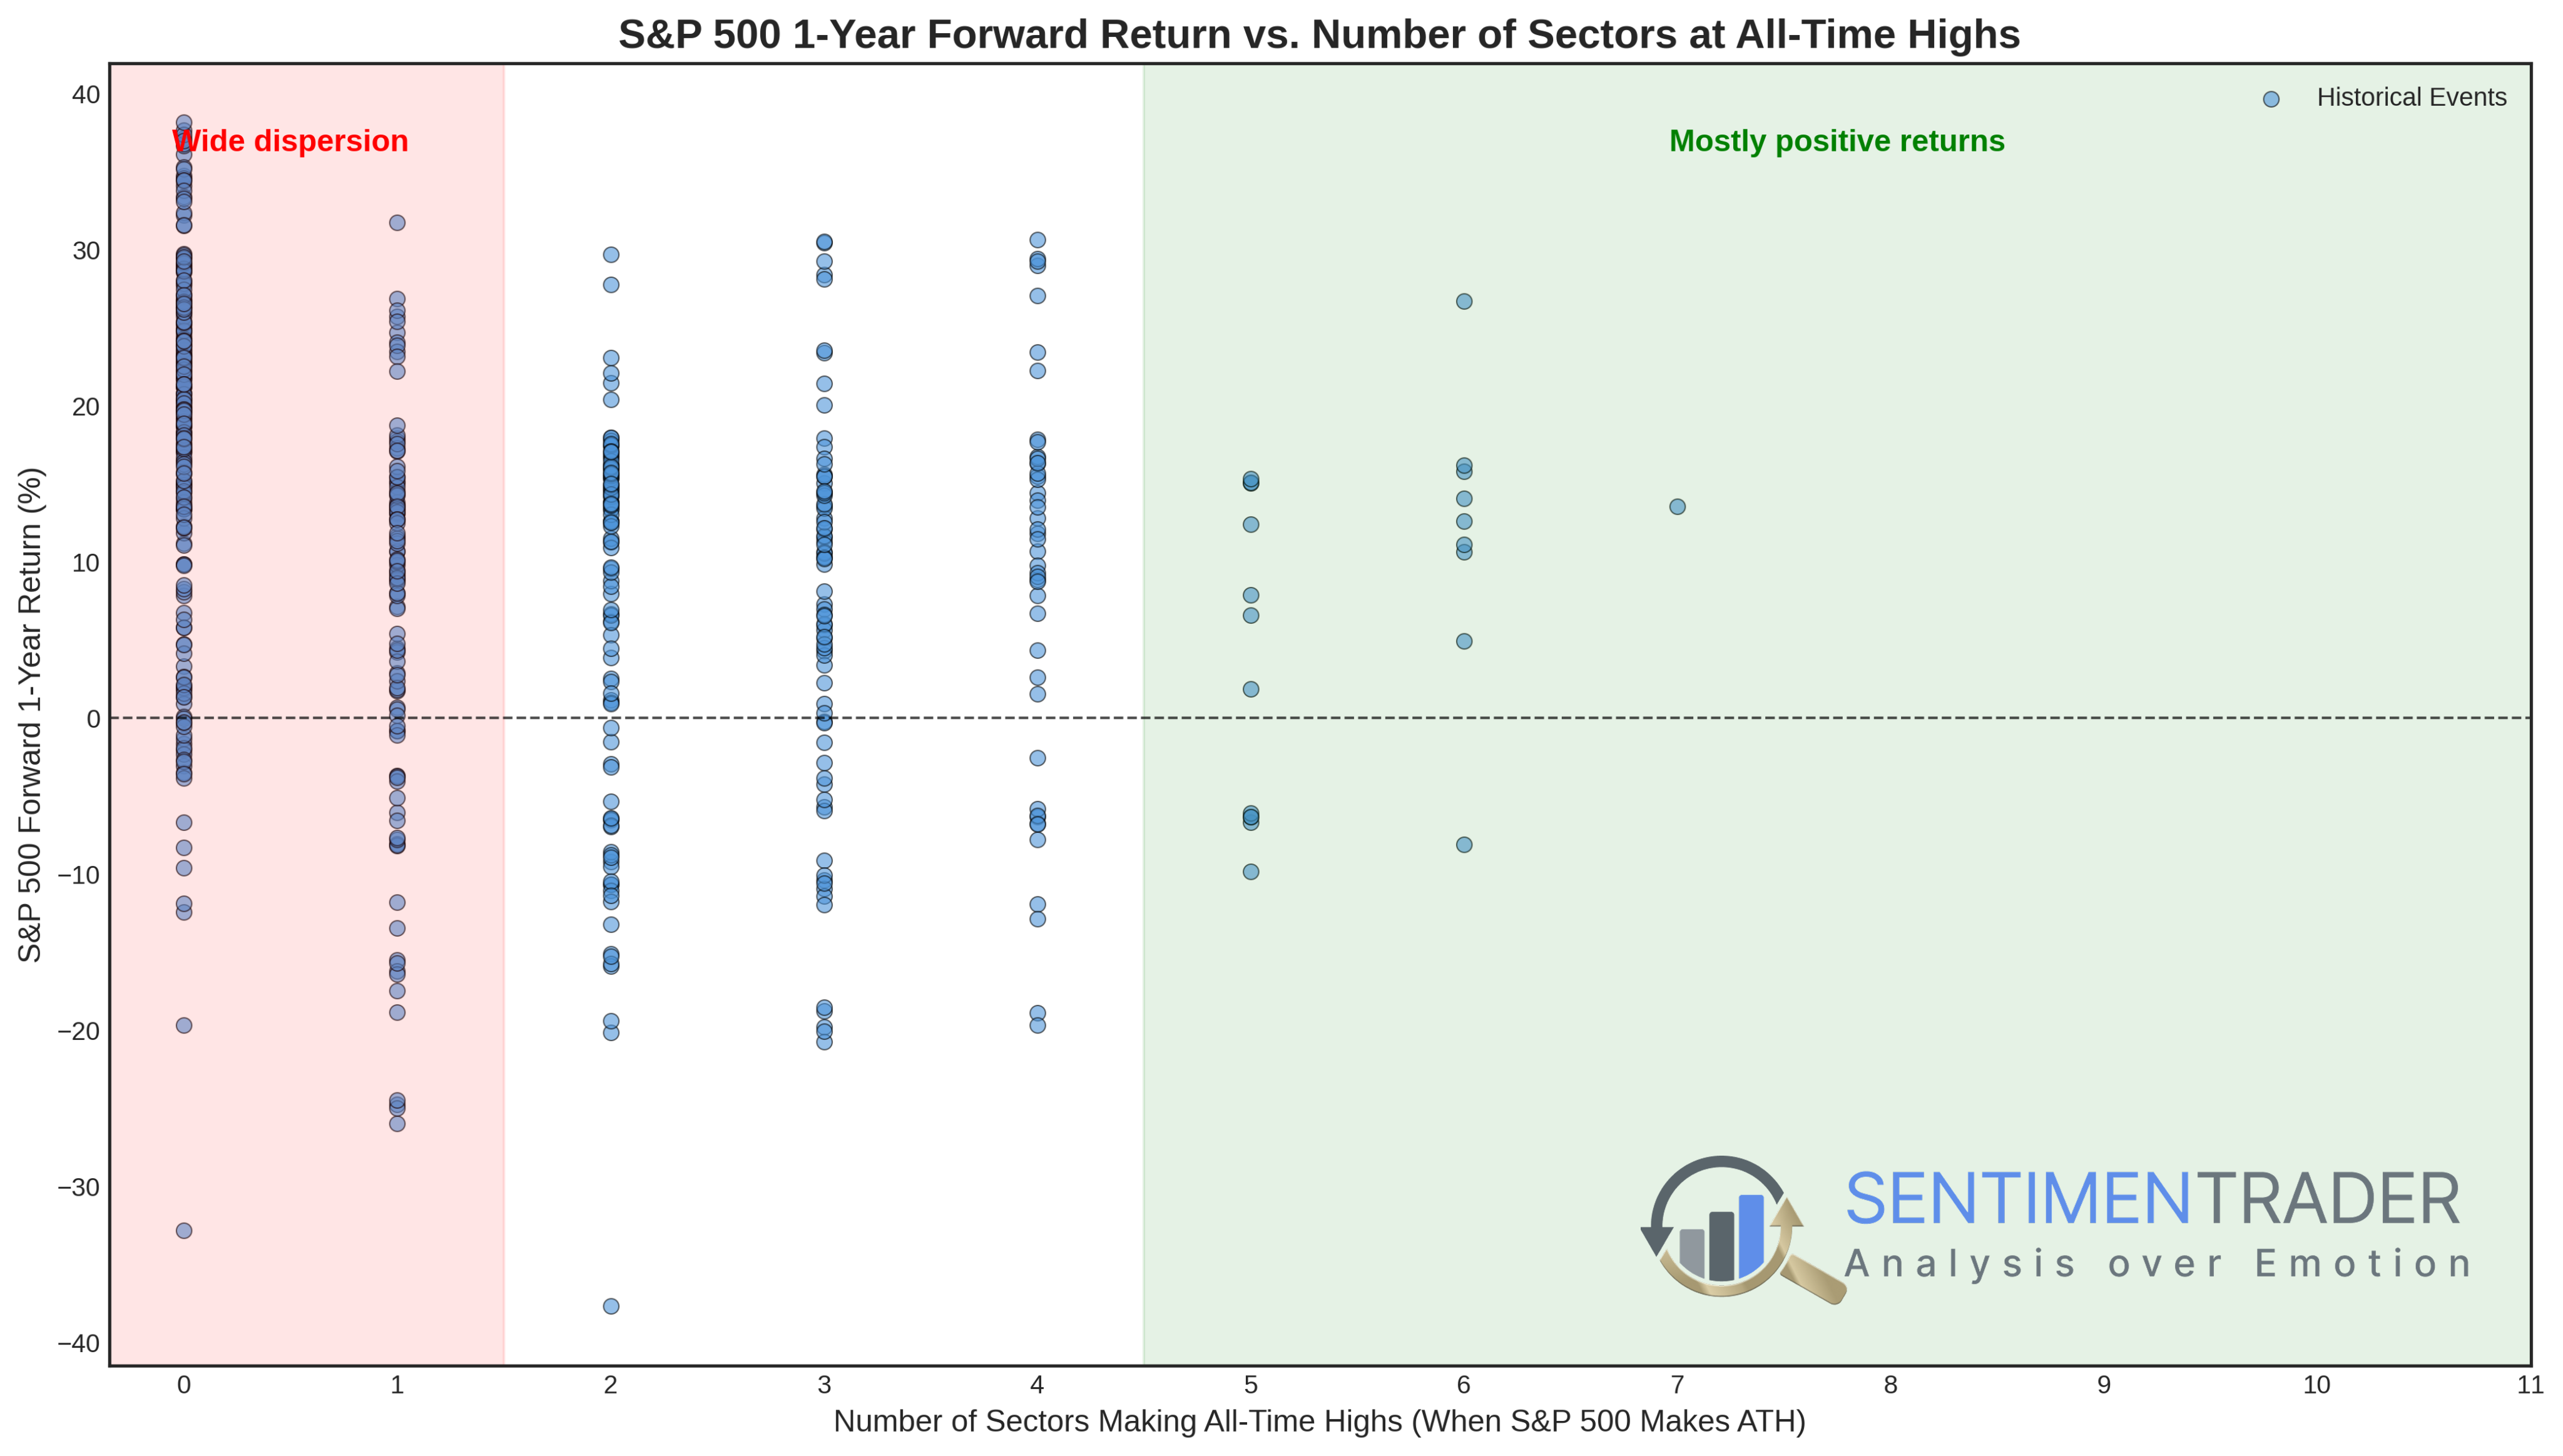
Observations link yesterday's breakthrough to a historical \"first decline, then rise\" trajectory. Yet data also flags a major risk: short-term (1-3 month) weakness and uncertainty.
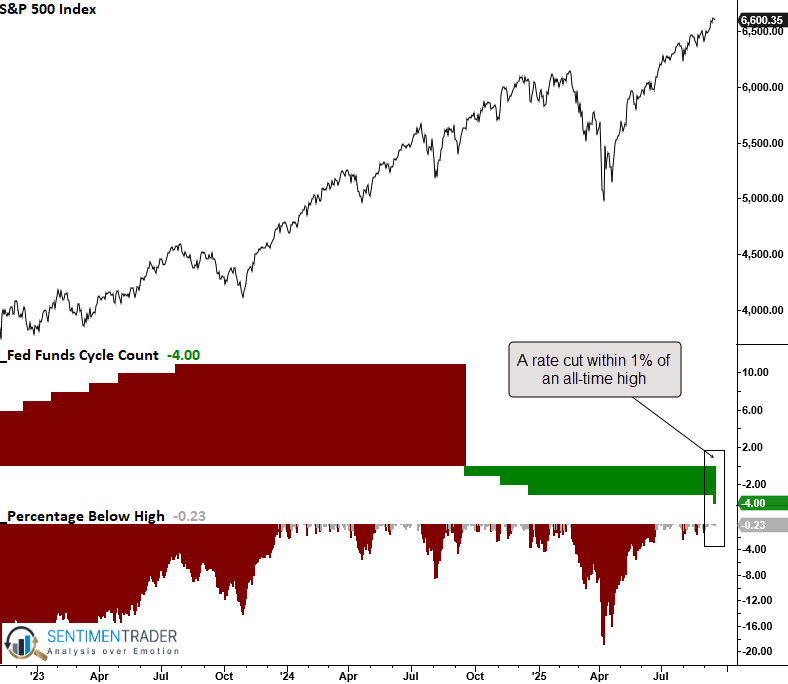
Implications of a Fed rate cut near record highs
On Wednesday, the Federal Reserve cut its target interest rate while the S&P 500 traded within 1% of its record high. The proximity of the market to all-time highs suggests that this rate cut is likely non-recessionary in nature, aimed more at supporting continued economic growth rather than countering a downturn.
Whenever the Federal Reserve lowered its target rate and the S&P 500 traded less than 1% shy of a record high, the world's most benchmarked advanced over the subsequent year every time.
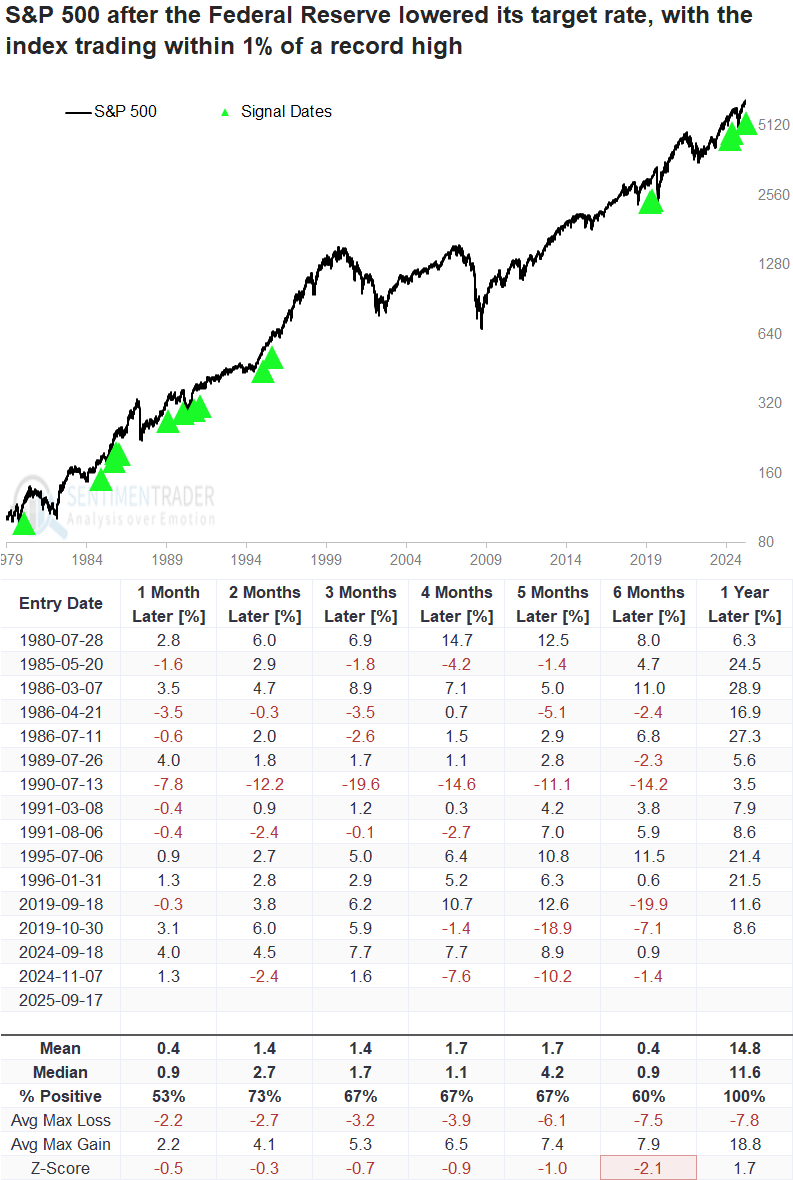
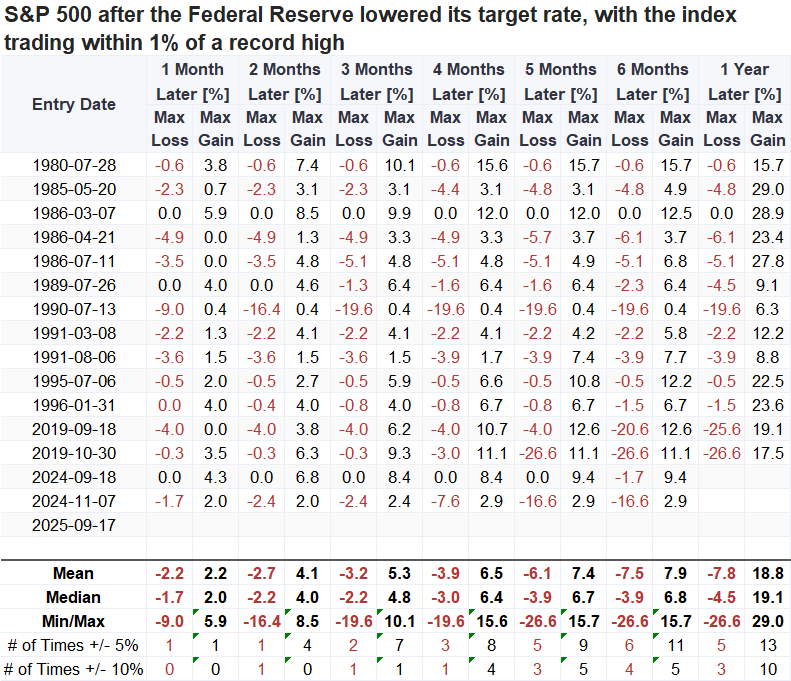
Over the course of the following year, the S&P 500 fell by more than 10% three times. Still, it gained over 10% on ten separate occasions, suggesting a favorable risk/reward dynamic.
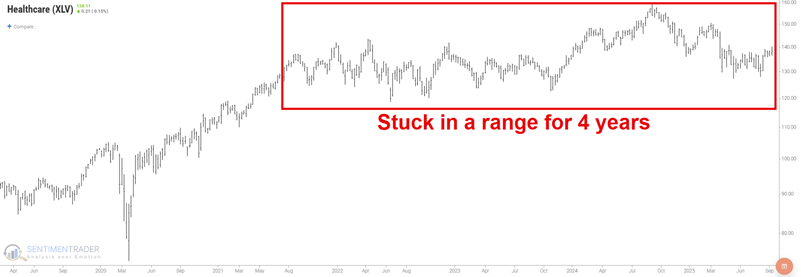
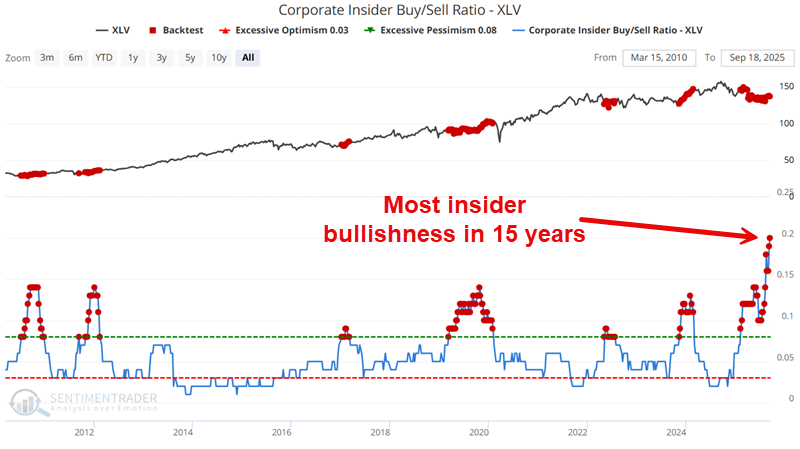
Healthcare insiders turn bullish but seasonal weakness suggests waiting
The healthcare sector has been a conspicuous laggard in recent years. While the S&P 500 and most other sectors have advanced, healthcare has remained mired in a long, drawn-out trading range.
Combining these two factors generates our Corporate Insider Buy/Sell Ratio-XLV indicator. As you can see below, the current confluence of increased buying and dissipation of selling indicates that healthcare insiders are presently more bullish than at any time in the past fifteen years.
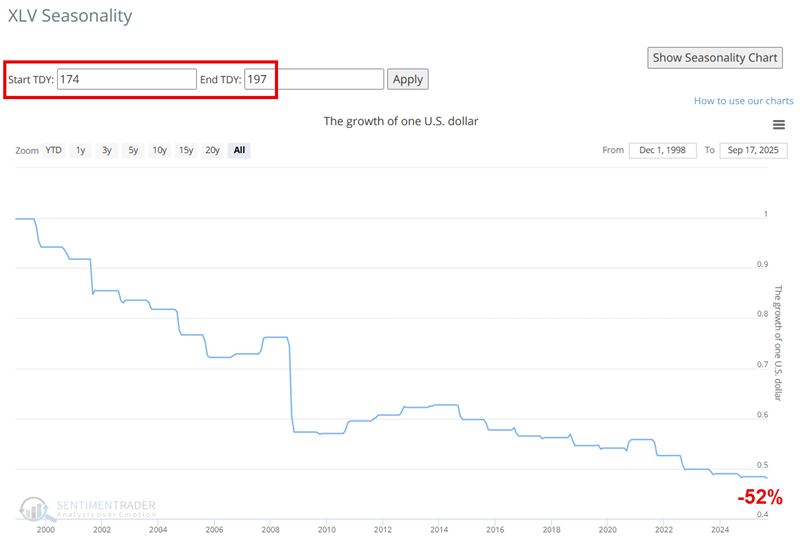
The chart below displays the hypothetical growth of $1 invested in XLV only during this particular period every year since 1999. XLV has declined 19 times and advanced only 7 times during this period. This persistent weakness has resulted in a cumulative loss of 52%.
About TradingEdge Weekly...
The goal of TradingEdge Weekly is to summarize some of the research published to SentimenTrader over the past week. Sometimes there is a lot to digest, and this summary highlights the highest conviction or most compelling ideas we discussed. This is NOT the published research; rather, it pulls out some of the most relevant parts. It includes links to the published research for convenience, and if you don't subscribe to those products, it will present the options for access.