
TradingEdge Weekly for Sep 12 - Platinum countertrend setup, bond ETFs strength, metal ratios in easing cycle, sentiment signals, S&P 500 highs, converging CDX signals

Key points:
- Platinum shows potential for short-term countertrend trading despite long-term bullish breakout
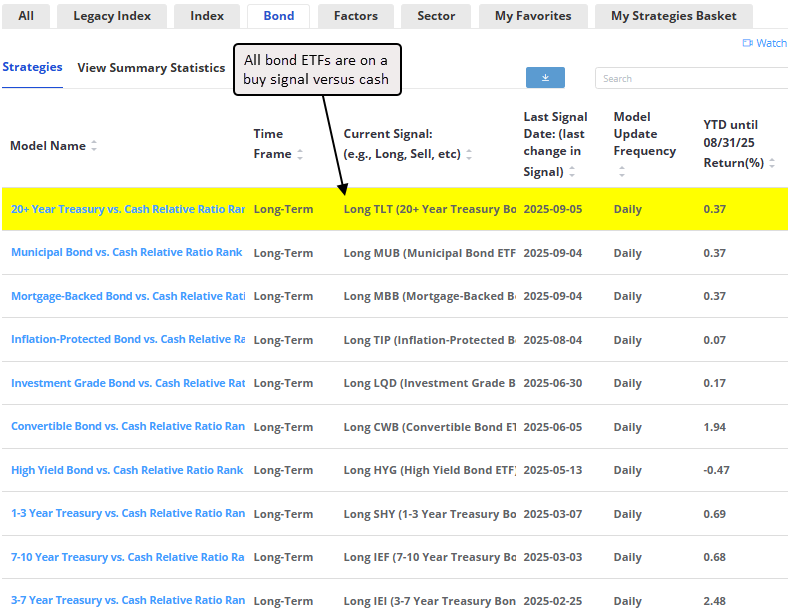
- All bond ETFs now favor bonds over cash, historically leading to bond and equity rallies
- Copper-gold and silver-copper ratios signal liquidity-driven market with growth sector leadership
- Advisor and Investor Model sentiment shift suggests strong future S&P 500 performance
- S&P 500 new highs occur alongside skeptical AAII sentiment, presenting mixed implications
- Credit market signals warn of potential mid-term correction despite short-term resilience
House view:
- Stocks:
- Short-term: Modestly bearish. The S&P 500 and Nasdaq recently reached new highs, buoyed by easing inflation concerns that reinforced rate-cut expectations. However, the VIX index remains in a historically calm range, a condition that has often preceded short-term pullbacks due to market complacency . While earnings season has seen widespread beats relative to forecasts, stock prices have shown limited reaction to positive results pattern consistent with "buy the rumor, sell the news" behavior at extended valuations . The rally has been led by a narrow group of large-cap stocks, with broader market participation lagging behind index gains, creating a fragile technical backdrop. Speculative activity in equity options has reached extremes, further signaling potential overoptimism. Time frame: 1-4 weeks.
- Intermediate-term: No view. Valuations remain elevated compared to historical averages, with long-term metrics hovering near multi-decade highs . This is offset by growing expectations for Federal Reserve rate cuts, which have historically provided support for risk assets . Market leadership remains concentrated in technology and growth sectors, while smaller companies have underperformed, reflecting investor caution about economic breadth. However, short-term momentum indicators show broad participation in the rally, with most stocks trading above their medium-term moving averages condition that has sometimes sustained gains despite valuation concerns. This creates a tug-of-war between technical strength and fundamental headwinds. Time frame: 1-5 months.
- Long-term: Bullish. The recovery from earlier volatility has been driven by economically sensitive sectors, a pattern typical of sustained expansions. Cyclical industries have shown stronger profitability compared to defensive sectors, indicating underlying economic resilience. Long-term breadth measures have improved, with most stocks maintaining uptrends above their long-term moving averages-a positive sign for sustained gains . Structural tailwinds from technological investment and impending monetary easing are likely to support growth over the coming quarters, outweighing near-term valuation concerns. This time frame covers 6-12 months.
- Cyclical momentum: Favors sectors tied to economic growth, which have historically outperformed in early easing cycles.
- Defensive resilience: Stable sectors offer lower volatility but limited upside in a recovering economy.
- Longer-term: Mean reversion tendencies suggest potential for smaller companies and equal-weight strategies to outperform after periods of mega-cap leadership.
- Bonds: Long-term cycles remain bearish. Historically, September has consistently been one of the weaker seasonal months for the S&P 500. Since the market landscape shifted in 2020, September's weakness has become even more pronounced, and this sluggish performance often carries over into October. In our analysis of analyst research, we have yet to see significant signs that this trend is changing.
- Commodities: Signs point to a probable secular bull market following multiple new highs. An effective commodity trend model is currently bullish. Gold (especially gold miners) and silver are extended and have a bad history of sustaining gains but gold continues to shake that off as it churns near its highs. Oil seasonality is weak for the next three months, and other factors like term structure suggest headwinds, but speculators are now pushing short bets to multi-year extremes, which have preceded rallies in recent years.
- Crypto: We follow several simple systems for bitcoin, which we consider the equivalent of the S&P 500 for crypto. Due to bitcoin's explosive growth over long periods, it's dangerous to equate neutral conditions with being bearish for some of these. However, if a system is "out," we consider it bearish for this summary.
- Triple 40: Bullish (barely)
- RSI Momentum: Bullish
- Trend and Relative Trend: Modestly Bullish
- PMI: Bearish
- M2 ROC: Bullish
Where we're at
Most investors have the most riding on equities. We feel that the most significant determinants of success for investors are whether to adjust their allocation to that asset class based on factors that have historically had a good record of preceding above- or below-random returns in the months ahead.
Those factors include the probability of a looming recession, sentiment, price action, volatility, breadth, and the bond market. The chart below summarizes the main indicators and composite models we watch for those factors, and they're mostly in bullish regimes. Valuations are not part of these factors since the relationship has been too inconsistent on time frames under one year.
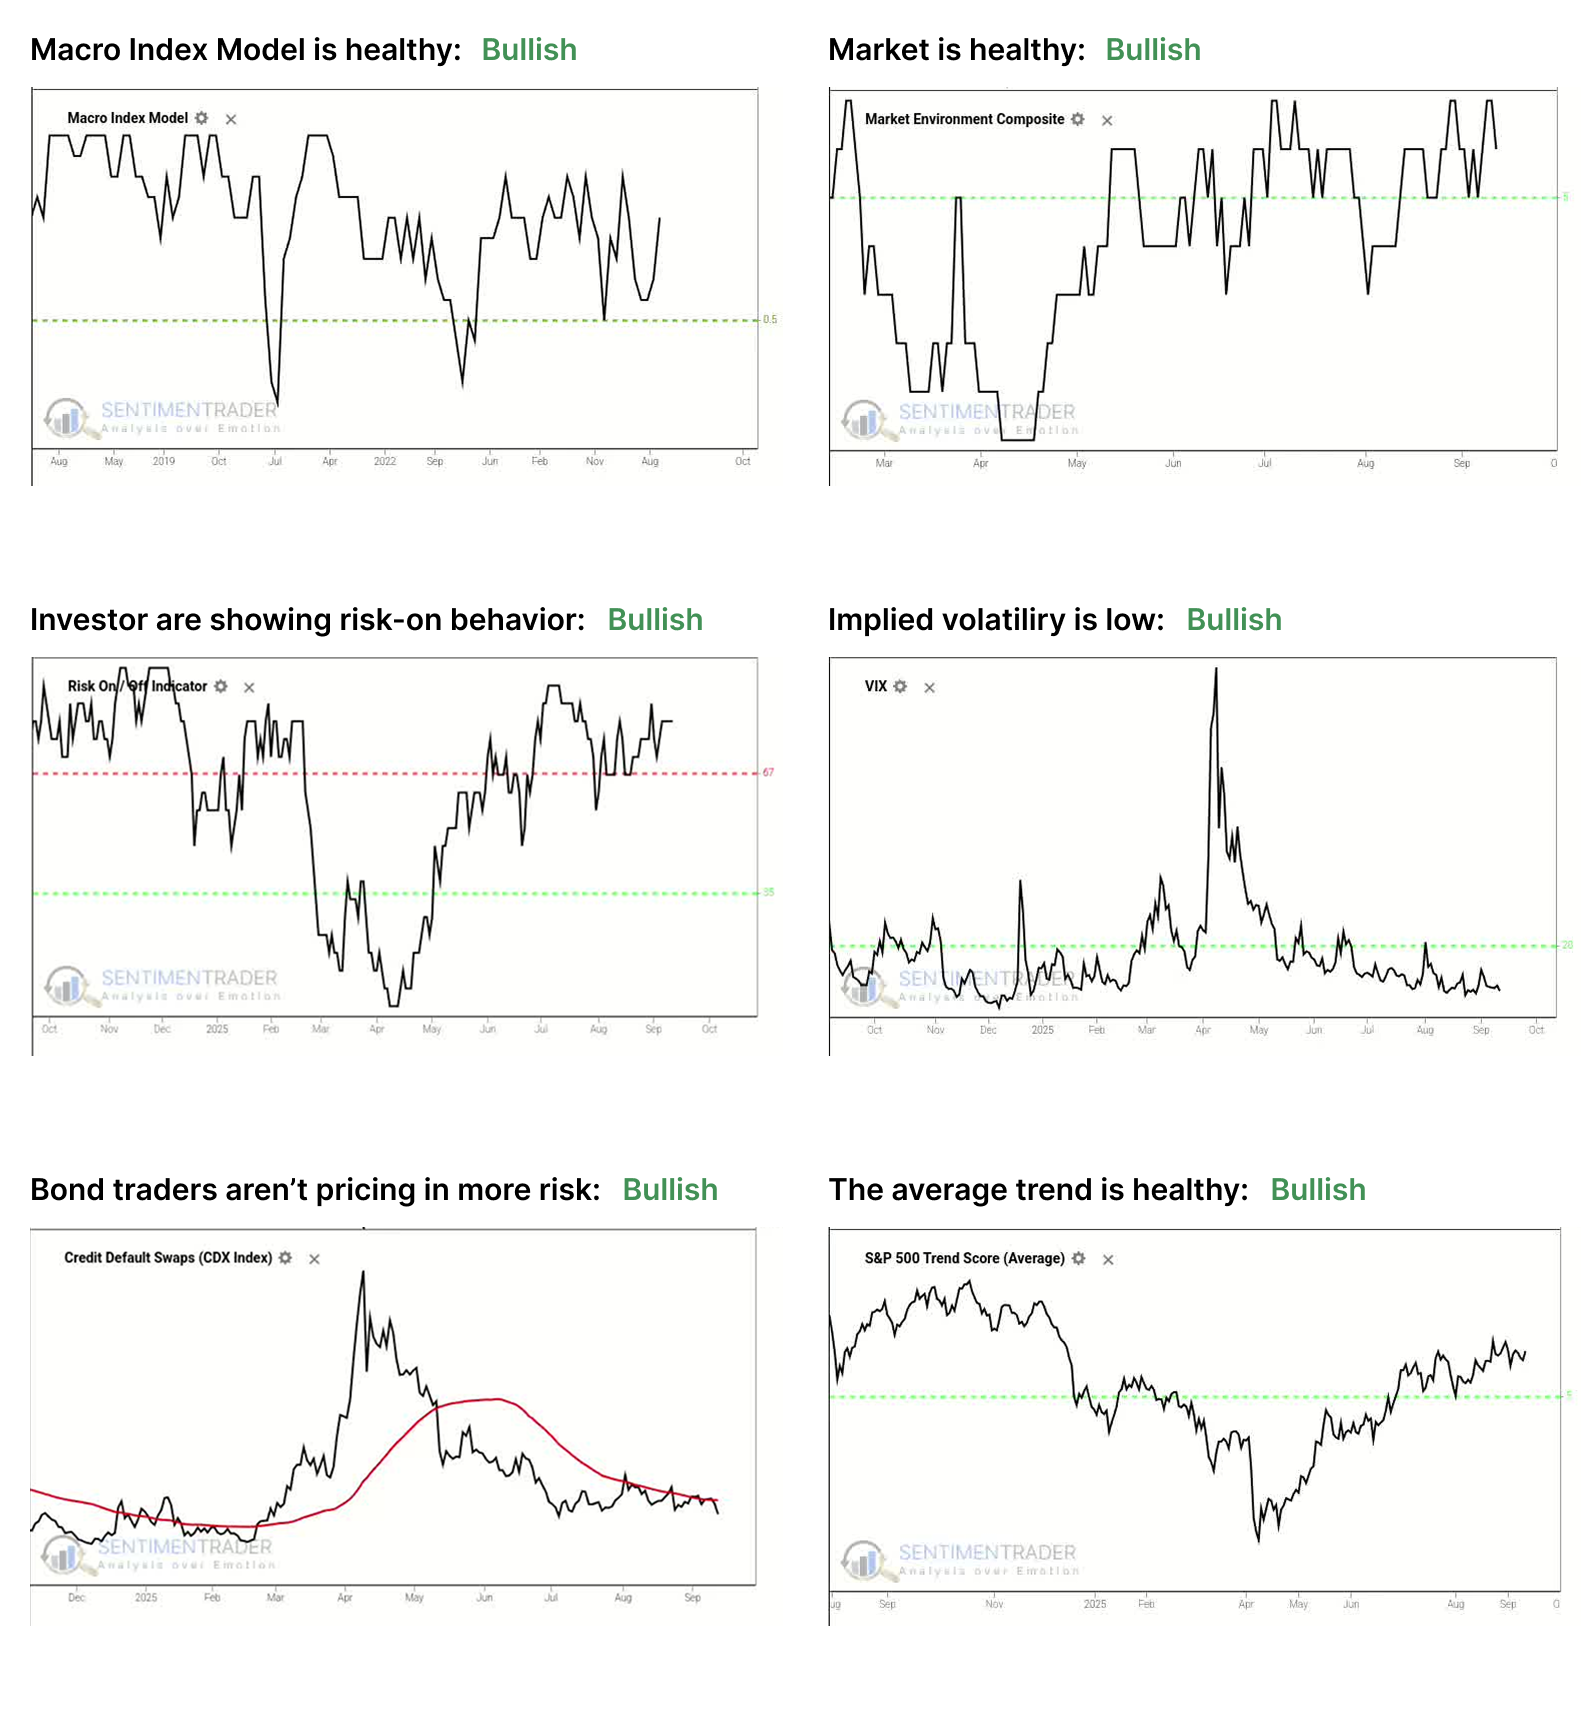
- The Macro Index Model is above the 50% threshold, which has been a vital level as outlined here.
- The Market Environment has been skittish since April, but is currently healthy. Future returns, especially for higher-beta indices, has been markedly better, with less risk, when the environment is healthy as outlined here.
- The Risk On / Off Indicator shows that investors are still in risk-on mode. This has been a good sign for future returns as outlined here.
- Implied volatility remains below 20, showing a calm environment. The S&P 500 has perfomed well when this is the case as outlined here.
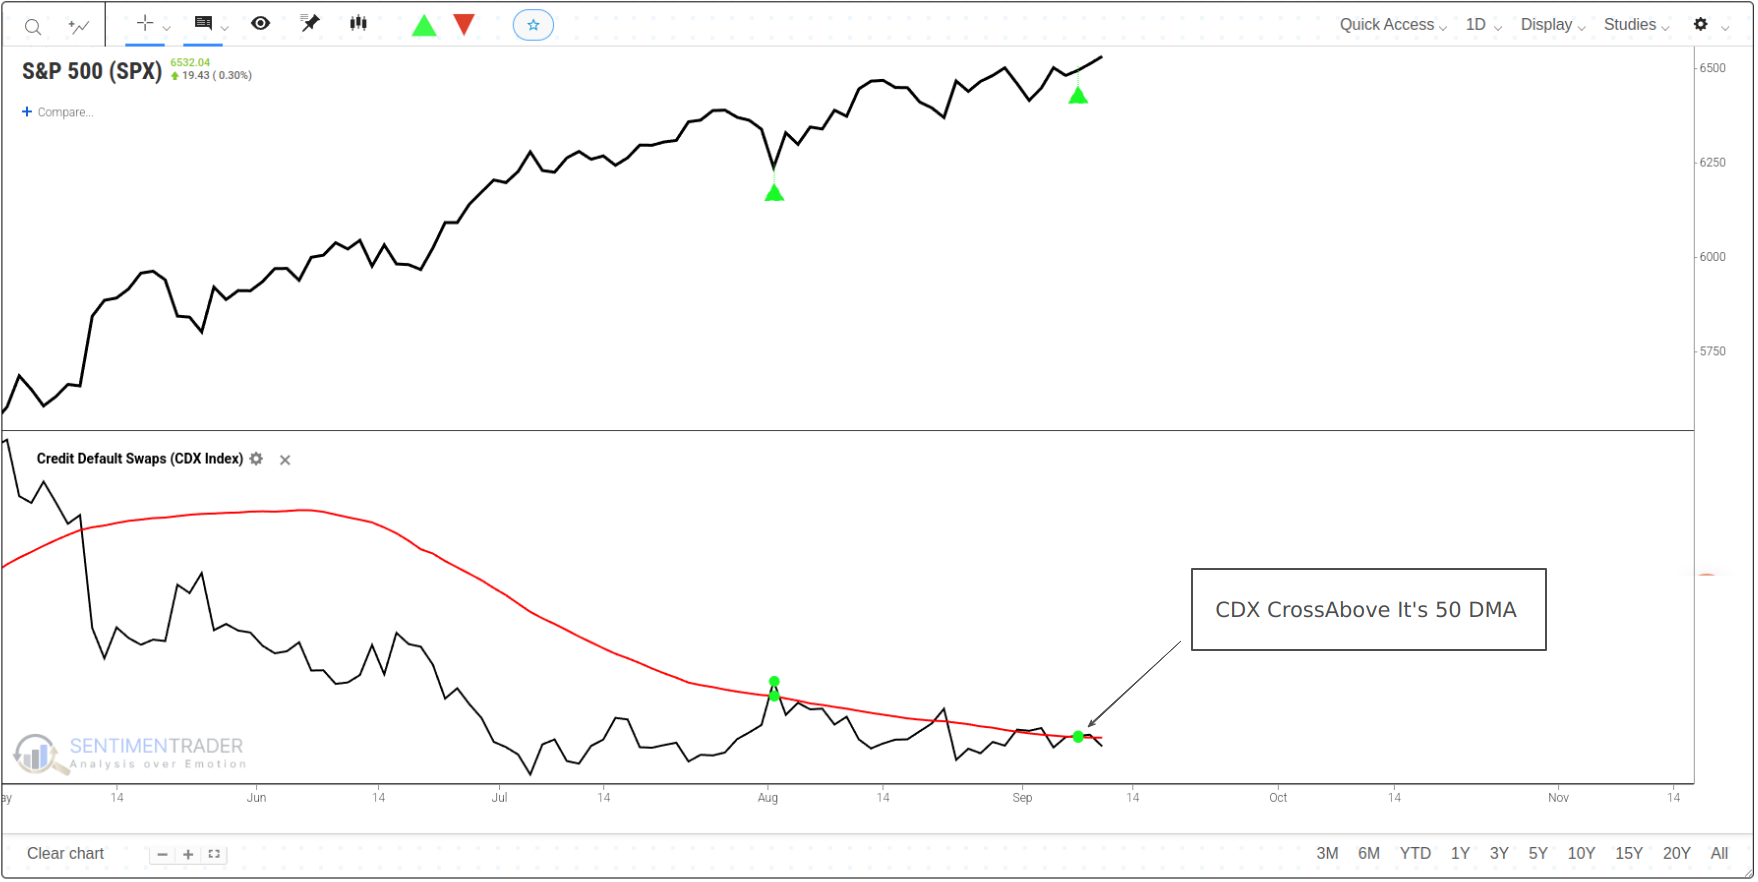
- Credit default swap spreads are below their 50-day moving average, which drastically improves stock returns as outlined here.
- A composite of trend measures in SPY and the average S&P 500 stock remain above 5, which show healthy trend conditions.
Since April, the most compelling studies have had a strongly bullish bias on longer time frames. You can follow these through the Active Studies page. From time to time, when the analysts' studies provide an overwhelming message, it will override the charts above, but there has been no consensus in the studies to suggest overriding the bullish environment.
Other major markets have been mostly rangebound for four months, and there is little among what we follow to suggest a compelling edge either way.
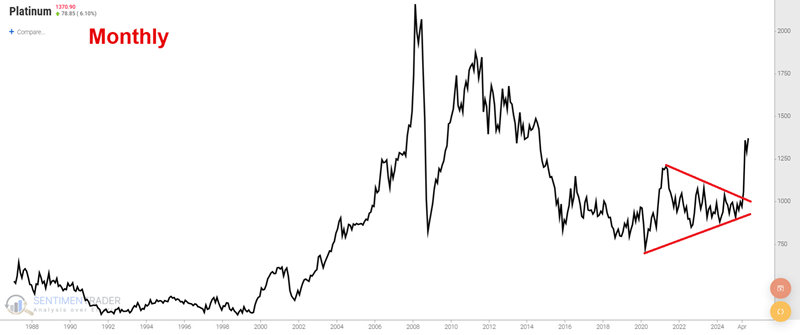
A countertrend setup in platinum
Platinum spent the better part of four years consolidating into an ever-tighter price range. Then, from April to July 2025, price exploded 60% higher.
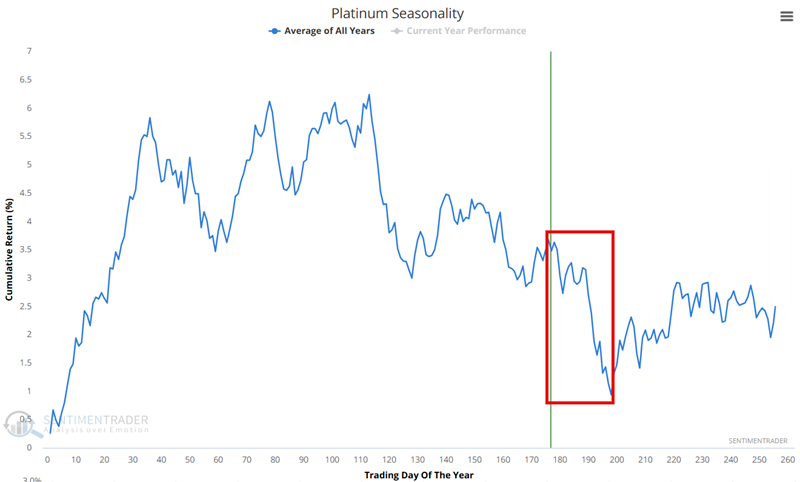
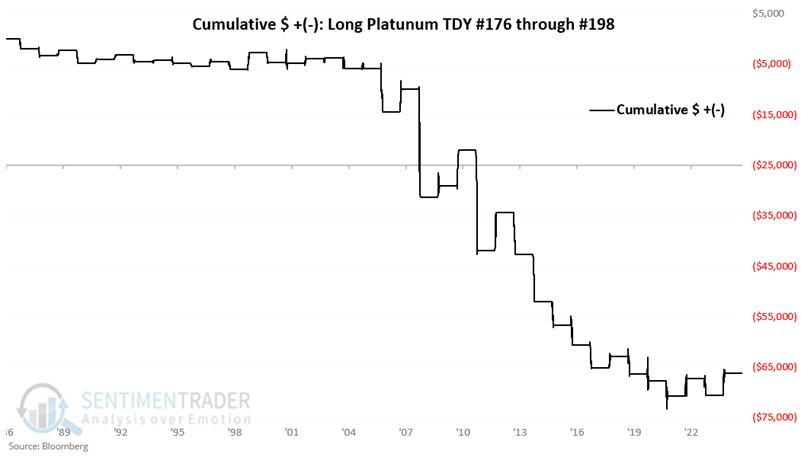
The chart below displays the Annual Seasonal Trend for the platinum futures and highlights the period extending from Trading Day of the Year (TDY) #176 through TDY #198. For 2025, this period extends from the close on September 4th through October 6th.
Cash is trash
Last week's soft employment report triggered a sharp move in Treasuries, sending yields across the curve plunging as investors quickly priced in a more dovish Fed policy outlook.
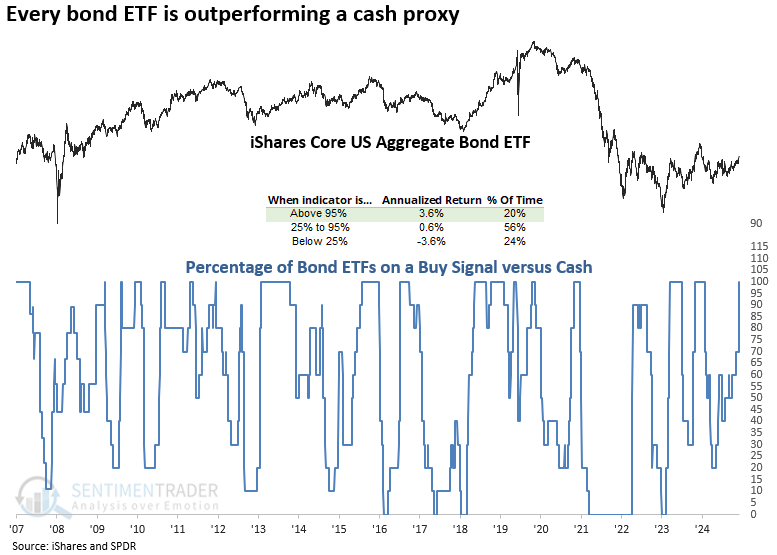
As shown in the chart below, when all bond systems remained on a buy signal versus cash, the iShares Aggregate Bond ETF (AGG) delivered an annualized return of 3.6%, notably outperforming periods when fewer systems were aligned.
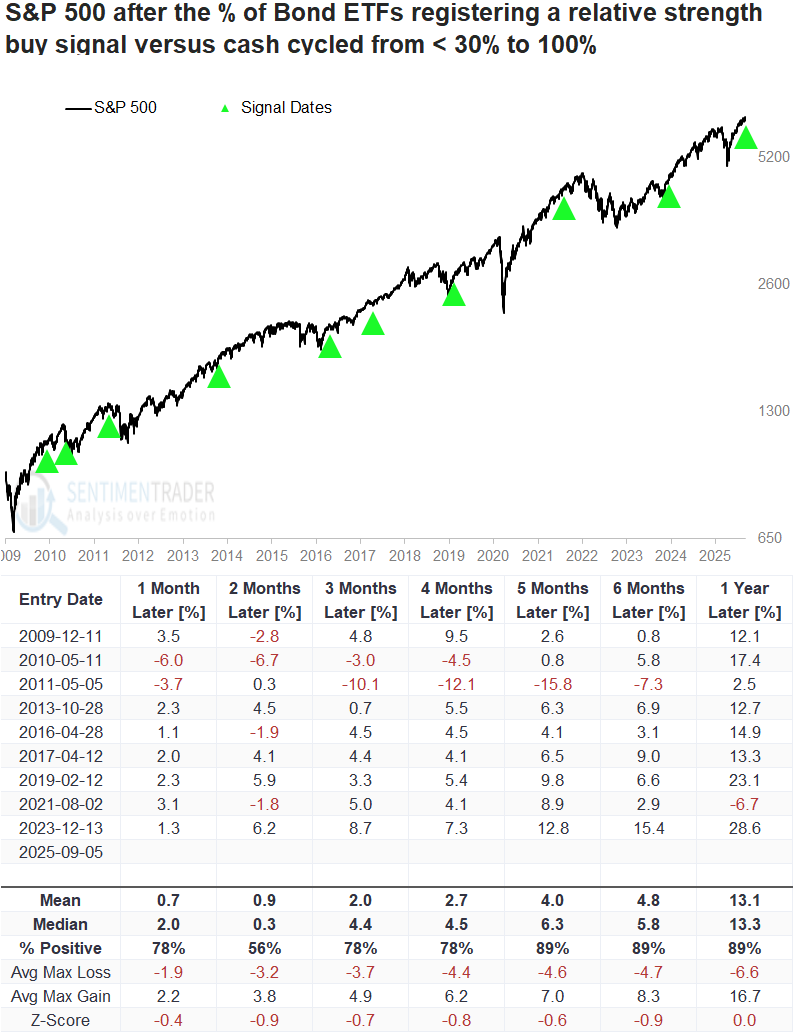
In nearly every instance, the S&P 500 rallied over the subsequent five, six, and twelve months when bonds outperformed cash. The sole exception was 2011, when the European debt crisis triggered a pronounced drawdown.
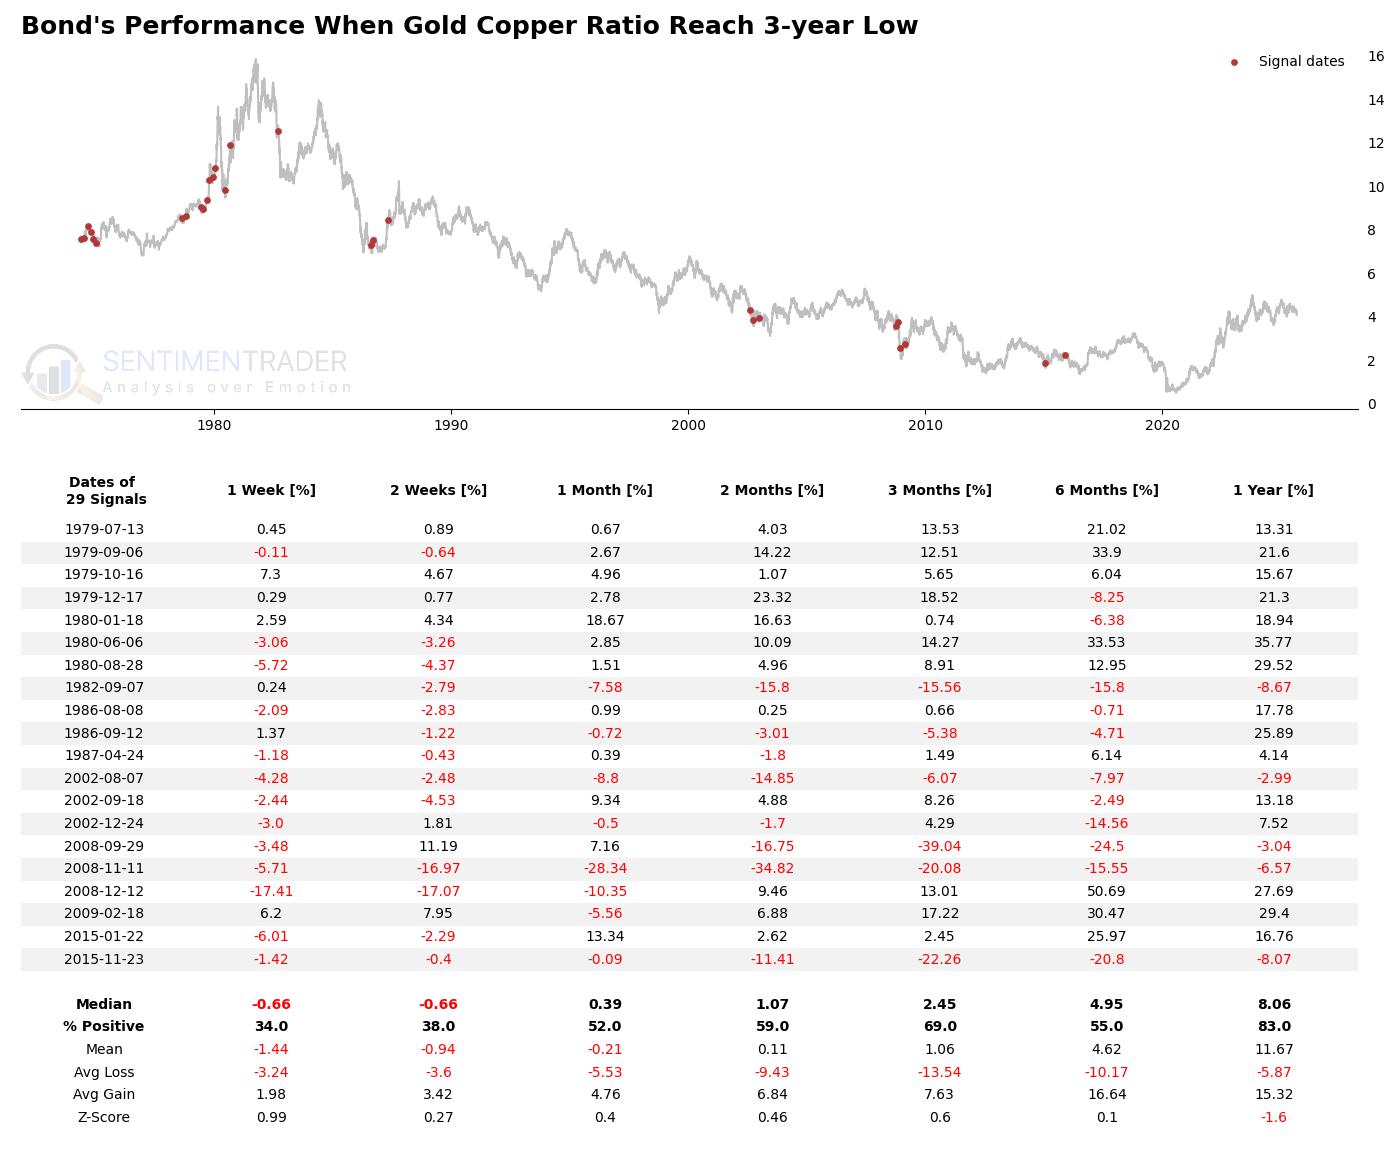
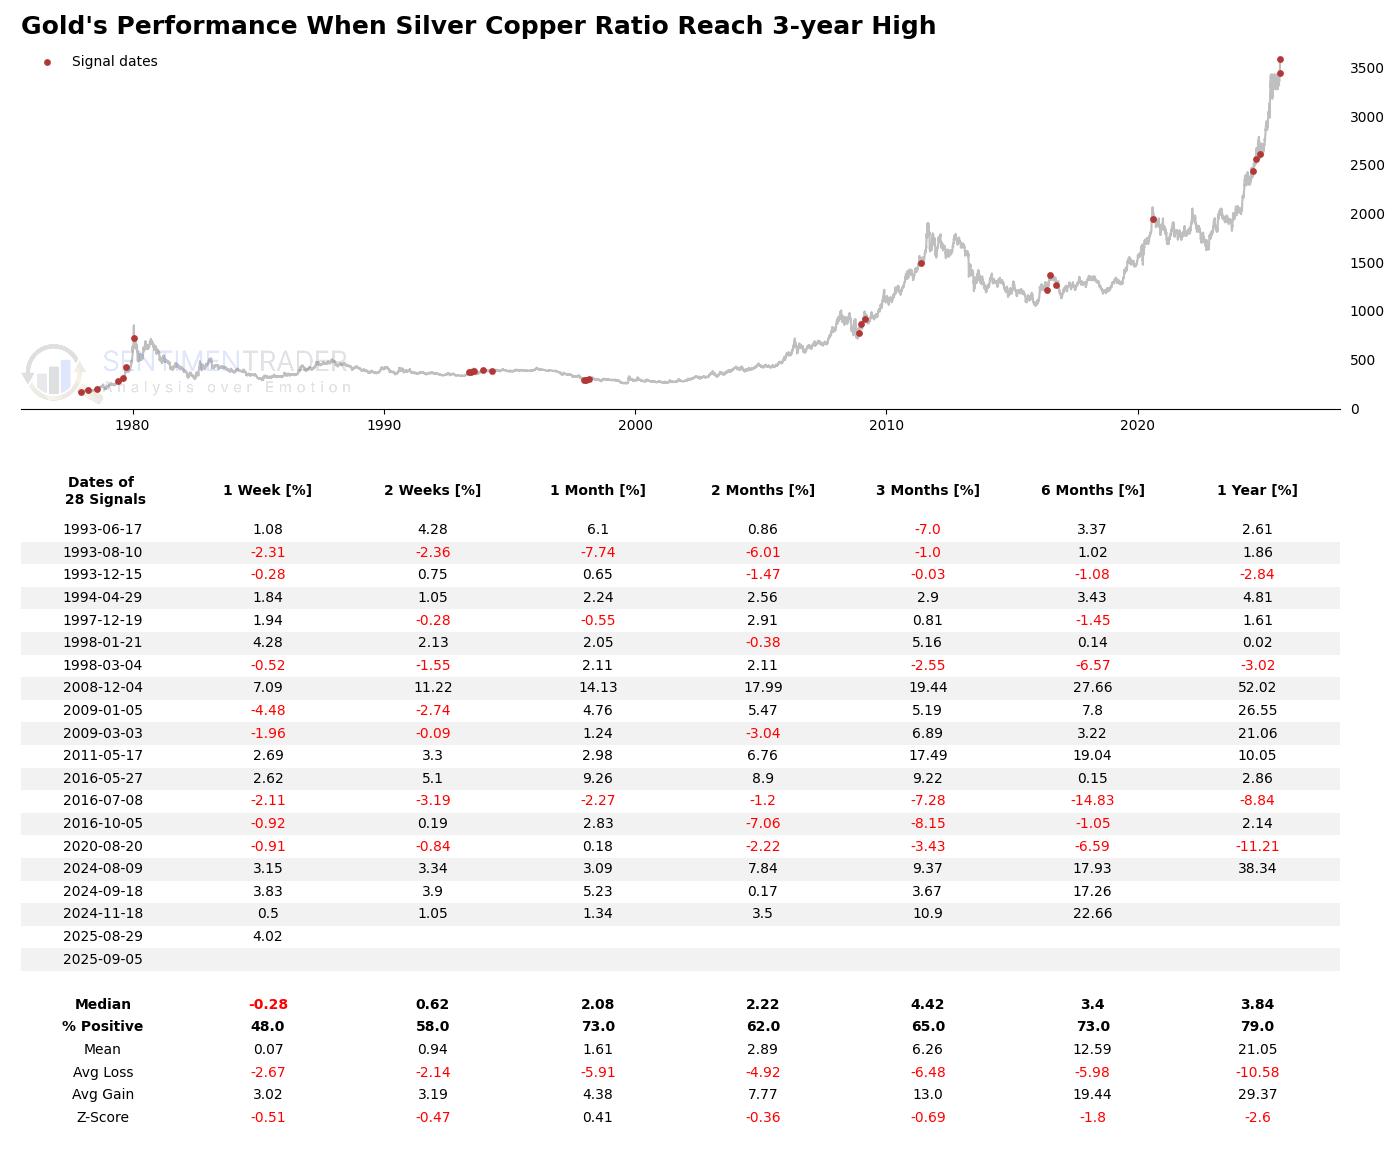
Uncovering Market Potential from Metal Ratios in a Monetary Easing Cycle
After a signal triggers from a low in the Copper/Gold ratio, the S&P 500 may indeed experience some short-term turbulence, but its long-term resilience is astonishing. One year after a signal, the index's probability of a gain is as high as 91%, with a robust median return of 15.7%.
Unsurprisingly, gold's performance is exceptional. After the signal, gold posts strong positive returns across almost all time horizons, with an average one-year return as high as 21.05%, indicating its performance is far above its historical average.
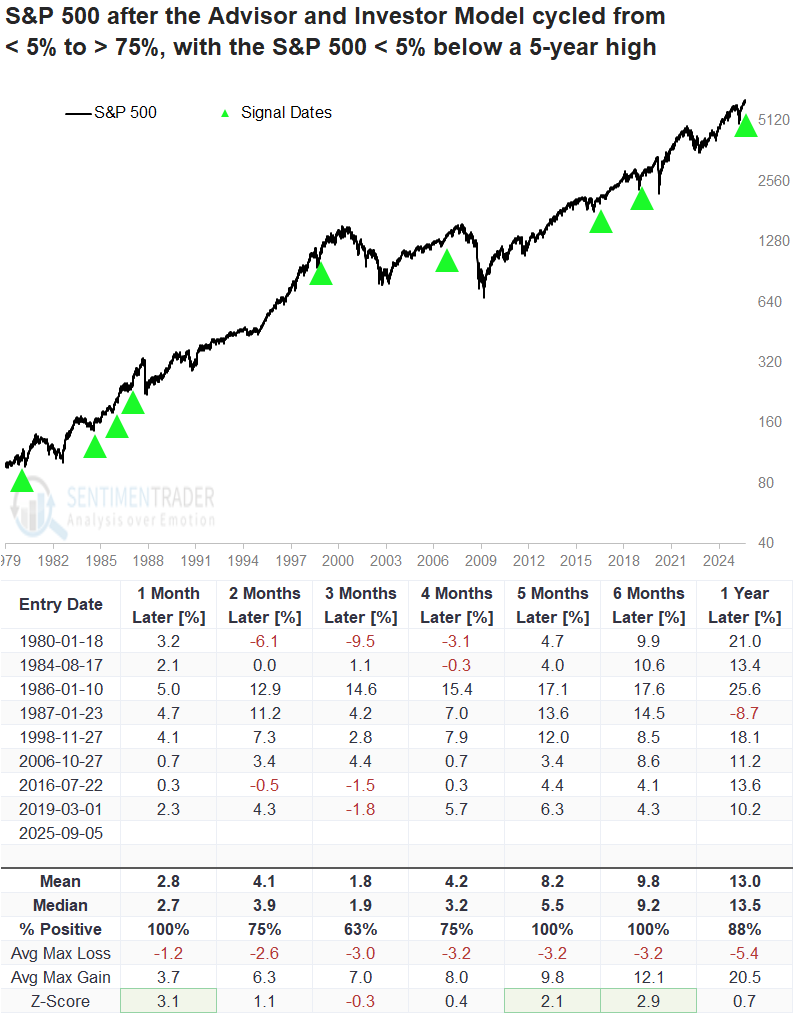
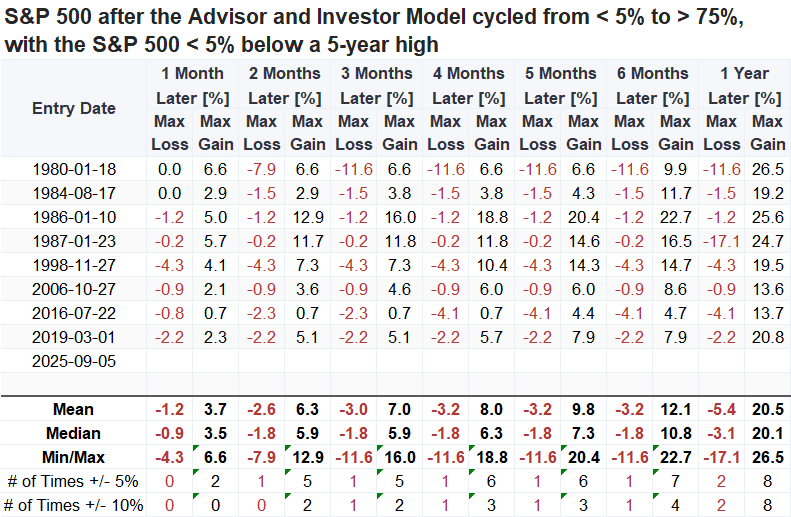
A sentiment signal with a perfect record just triggered
The Advisor and Investor Model, a composite sentiment gauge that blends several measures, has staged a dramatic rebound in recent months. From registering just 1% at the depths of the April low, a level reflecting near-universal pessimism, the model ticked above 75% by the end of last week.
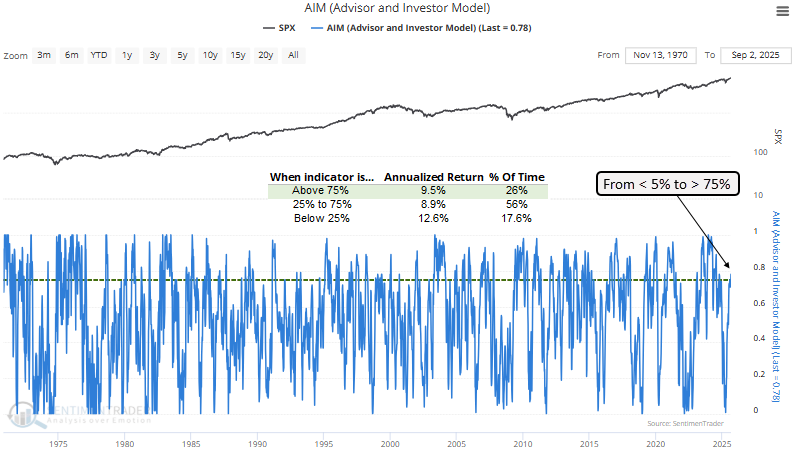
Whenever the AIM indicator rose from below 5% to over 75% and the S&P 500 traded less than 5% shy of a five-year high, the S&P 500 advanced without fail over several horizons.
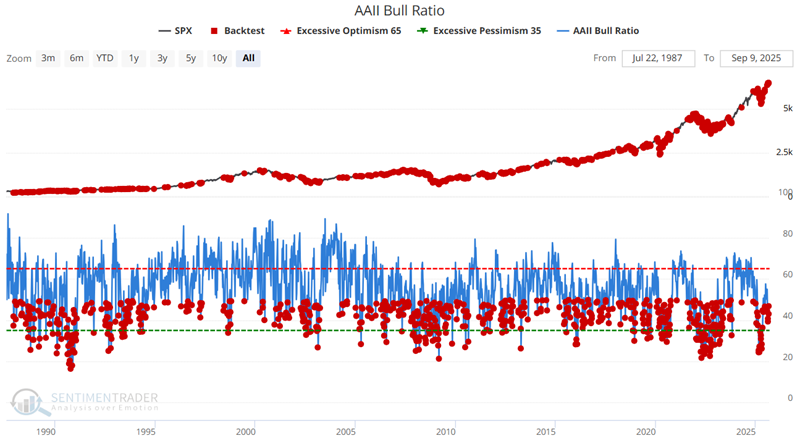
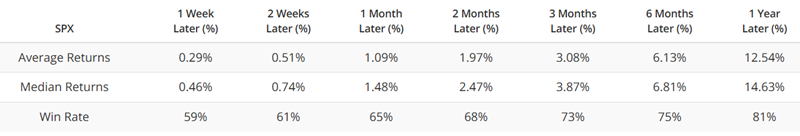
S&P 500 52-week highs and the AAII Bull Ratio
The AAII Bull Ratio measures the percentage of bullish respondents in the American Association of Individual Investors (AAII) weekly survey compared to Bulls + Bears. Technically, stocks have had a slight historical advantage when the ratio is below 50%.
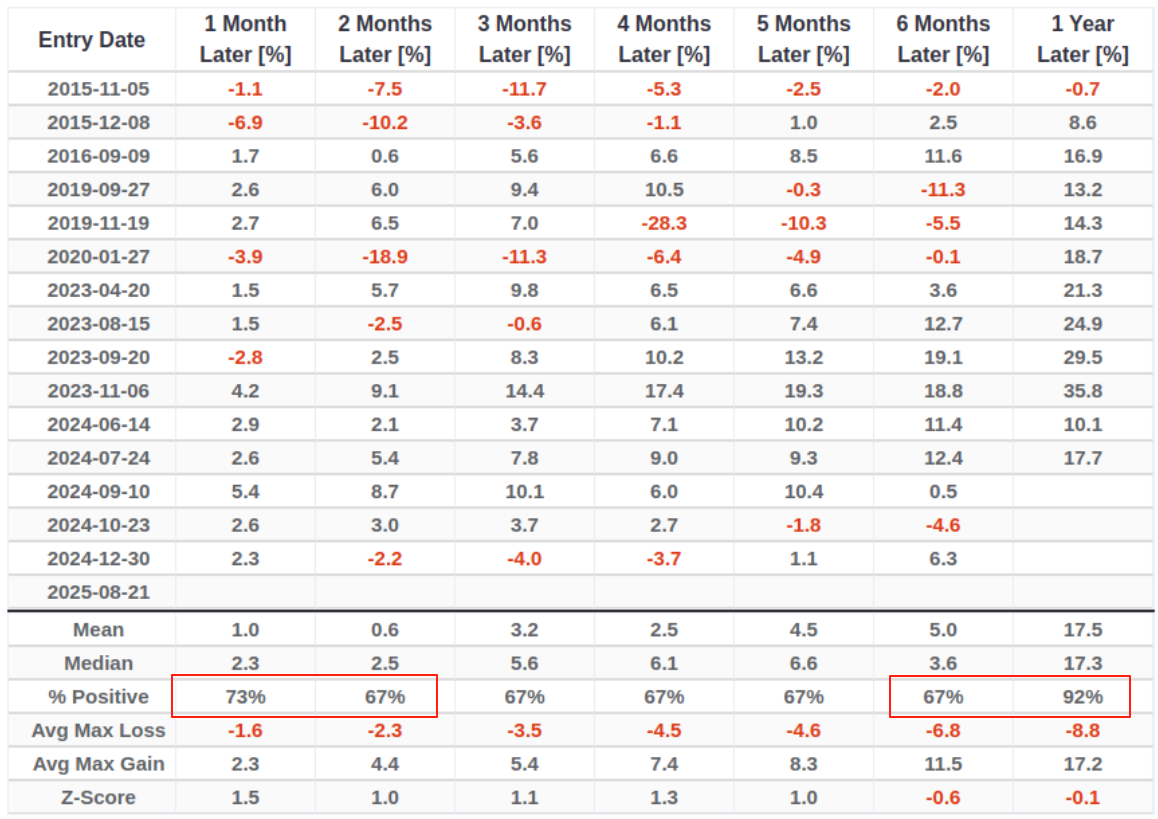
Are Converging Signals Pointing to a \"Pre-Storm\" Phase?
Recently, a notable phenomenon has emerged: the CDX index has been fluctuating around its 50-day moving average, indicating unusually intense bull-bear battles within the credit market.
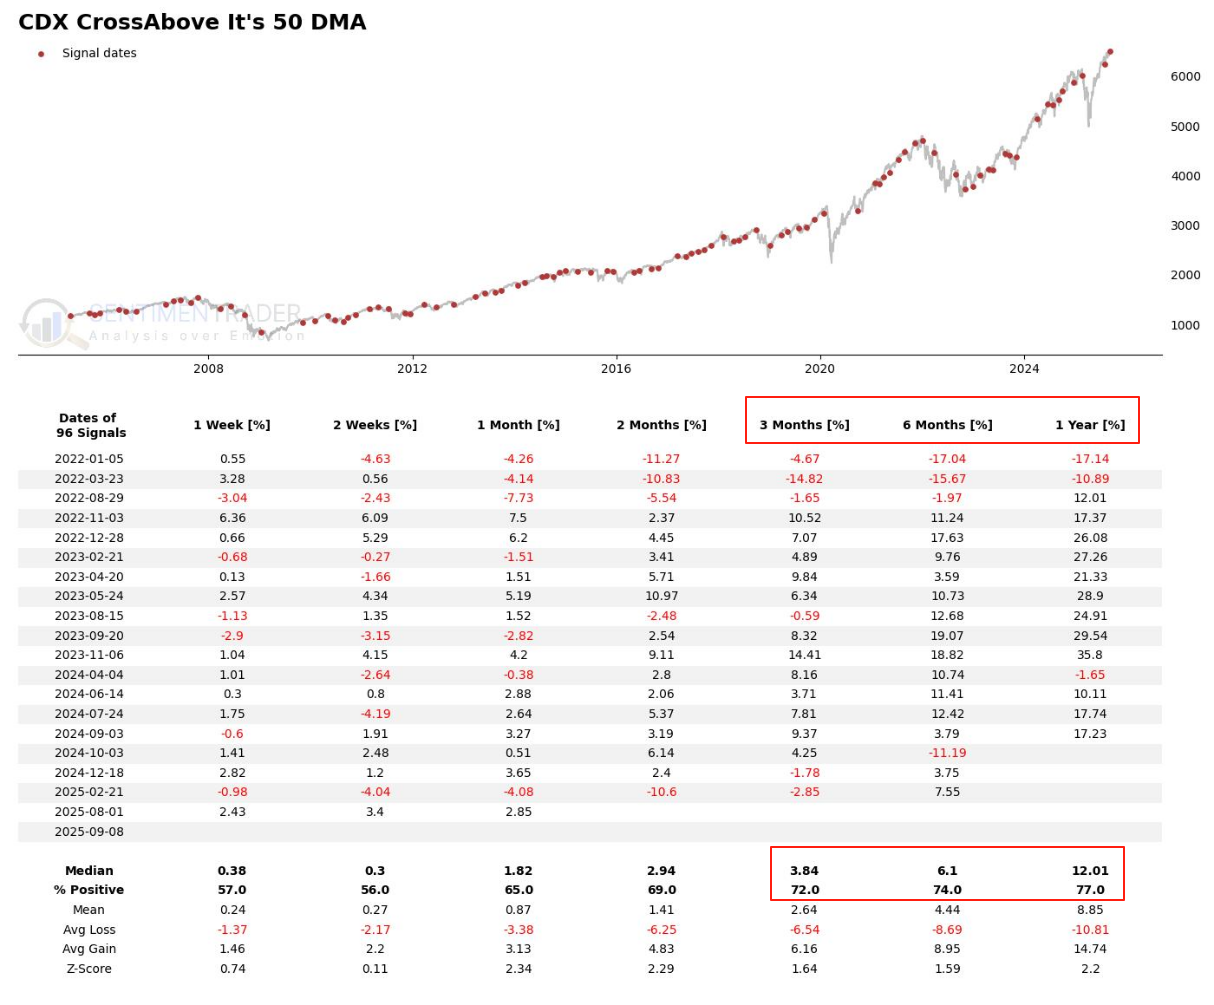
Under current filtered conditions (VIX < 20, PMI < 50, SPX > 252d MA), historical data reveals a deceptive pattern. The market initially appears strong (73% 1-month upside probability) but becomes highly vulnerable to sharp, double-digit pullbacks in the mid-term (2-6 months), before showing a strong recovery (92% 1-year upside probability).
About TradingEdge Weekly...
The goal of TradingEdge Weekly is to summarize some of the research published to SentimenTrader over the past week. Sometimes there is a lot to digest, and this summary highlights the highest conviction or most compelling ideas we discussed. This is NOT the published research; rather, it pulls out some of the most relevant parts. It includes links to the published research for convenience, and if you don't subscribe to those products, it will present the options for access.