
TradingEdge Weekly for Oct 31 - Gold and Dollar cycle, S&P 500 breadth, High-yield bond signals, Semiconductor sentiment, Investment strategies, Technology-energy divergence

Key points:
- Gold and U.S. Dollar exhibit strong inverse correlation with an 8-year cycle favoring gold in first 4 years
- S&P 500 reaches new highs with Technology, Industrials, and Communication Services sectors showing broad participation
- High-yield bond market presents conflicting signals between panic capitulation and long-term exuberance
- Semiconductor stocks show counterintuitive bullish signal combined with favorable seasonality
- Two long-term investment strategies (Aggregate Signal Model and High-Yield Golden Cross) currently favor bullish stance
- Market shows divergence between strong technology momentum and weakening crude oil prices
House View:
- Stocks:
- Short-term: Modestly bearish. Major equity benchmarks have pulled back from recent record highs, even as some sectors delivered strong earnings results. The Federal Reserve's "hawkish cut" has continued to dampen market sentiment, with policymakers stressing that additional rate reductions are not guaranteed in the near term. Tech leaders face ongoing pressure as investors focus on the significant, sustained costs of expanding artificial intelligence (AI) infrastructure, driving a shift toward more defensive assets. Market breadth has narrowed further, signaling that the earlier rally to new highs lacked broad participation and that near-term momentum is fragile. This time frame covers 1 - 4 weeks.
- Intermediate-term: No view. Positive earnings from key market heavyweights have failed to generate sustained upside for the broader market, as enthusiasm for AI-driven growth is increasingly balanced against concerns over elevated valuations. Internal divisions within the Fed on the future path of interest rates, combined with a prolonged government shutdown that has created gaps in critical economic data, have pushed volatility higher. A persistent tug-of-war remains between solid corporate fundamentals and lingering macroeconomic uncertainty, with sharp sector divergence cyclicals fluctuate with bets on economic trends, while defensives draw in cautious capital. This time frame covers 1-5 months.
- Long-term: Bullish. The Fed's formal shift into an easing cycle, even with its hawkish rhetoric, remains a powerful long-term tailwind for equities, aligning with historical patterns of market strength following policy pivots. Economically sensitive sectors like industrials and healthcare have started to show leadership traits, a sign of maturing market breadth that typically precedes extended upward moves. The market's resilience through recent geopolitical and policy-driven volatility further supports the constructive long-term outlook. This time frame covers 6-12 months.
- Cyclical momentum favors sectors such as financials and industrials, which are poised to benefit from a potential economic recovery.
- Defensive sectors including healthcare offer a balanced risk-return profile, supported by steady demand fundamentals.
- Very long-term (one year+) trends point to mean reversion for small-caps and underperforming value segments, which have lagged large-cap growth stocks during the recent tech-led rally.
- Bonds: Long-term cycles remain bearish. Treasury prices faced renewed pressure following the Fed's latest commentary, as markets focused on policymakers' lingering concerns about inflation rather than the recent rate cut. This has reinforced upward pressure on yields, with institutional demand continuing to concentrate in shorter-dated securities amid policy uncertainty. No clear signals from cyclical indicators suggest an imminent reversal of the long-term downward trend for bond prices. Cyclical indicators further confirm the structural headwinds for long-duration assets.
- Commodities: A divergent but potentially secular bullish trend persists across commodity sectors, with near-term headwinds easing for some assets. An effective commodity trend model now reflects cautious optimism. Gold has staged a modest rebound after recent pullbacks, supported by lingering geopolitical tensions and sustained expectations of future Fed easing though strength in the U.S. dollar continues to limit its upward momentum. Oil prices, by contrast, face ongoing pressure from persistent supply concerns, with seasonal weakness adding to fundamental headwinds. Related equities have begun to decouple slightly from underlying commodity prices, driven by sector-specific fundamentals.
- Crypto: We follow several simple systems for bitcoin, which we consider the equivalent of the S&P 500 for crypto. Due to bitcoin's explosive growth over long periods, it's dangerous to equate neutral conditions with being bearish for some of these. However, if a system is "out," we consider it bearish for this summary.
- Triple 40:Bearish
- RSI Momentum: Bullish
- Trend and Relative Trend: Bearish
- PMI: Bearish
- M2 ROC: Bullish
Where we're at
Most investors have the most riding on equities. We feel that the most significant determinants of success for investors are whether to adjust their allocation to that asset class based on factors that have historically had a good record of preceding above- or below-random returns in the months ahead.
Those factors include the probability of a looming recession, sentiment, price action, volatility, breadth, and the bond market. The chart below summarizes the main indicators and composite models we watch for those factors, and they're mostly in bullish regimes. Valuations are not part of these factors since the relationship has been too inconsistent on time frames under one year.
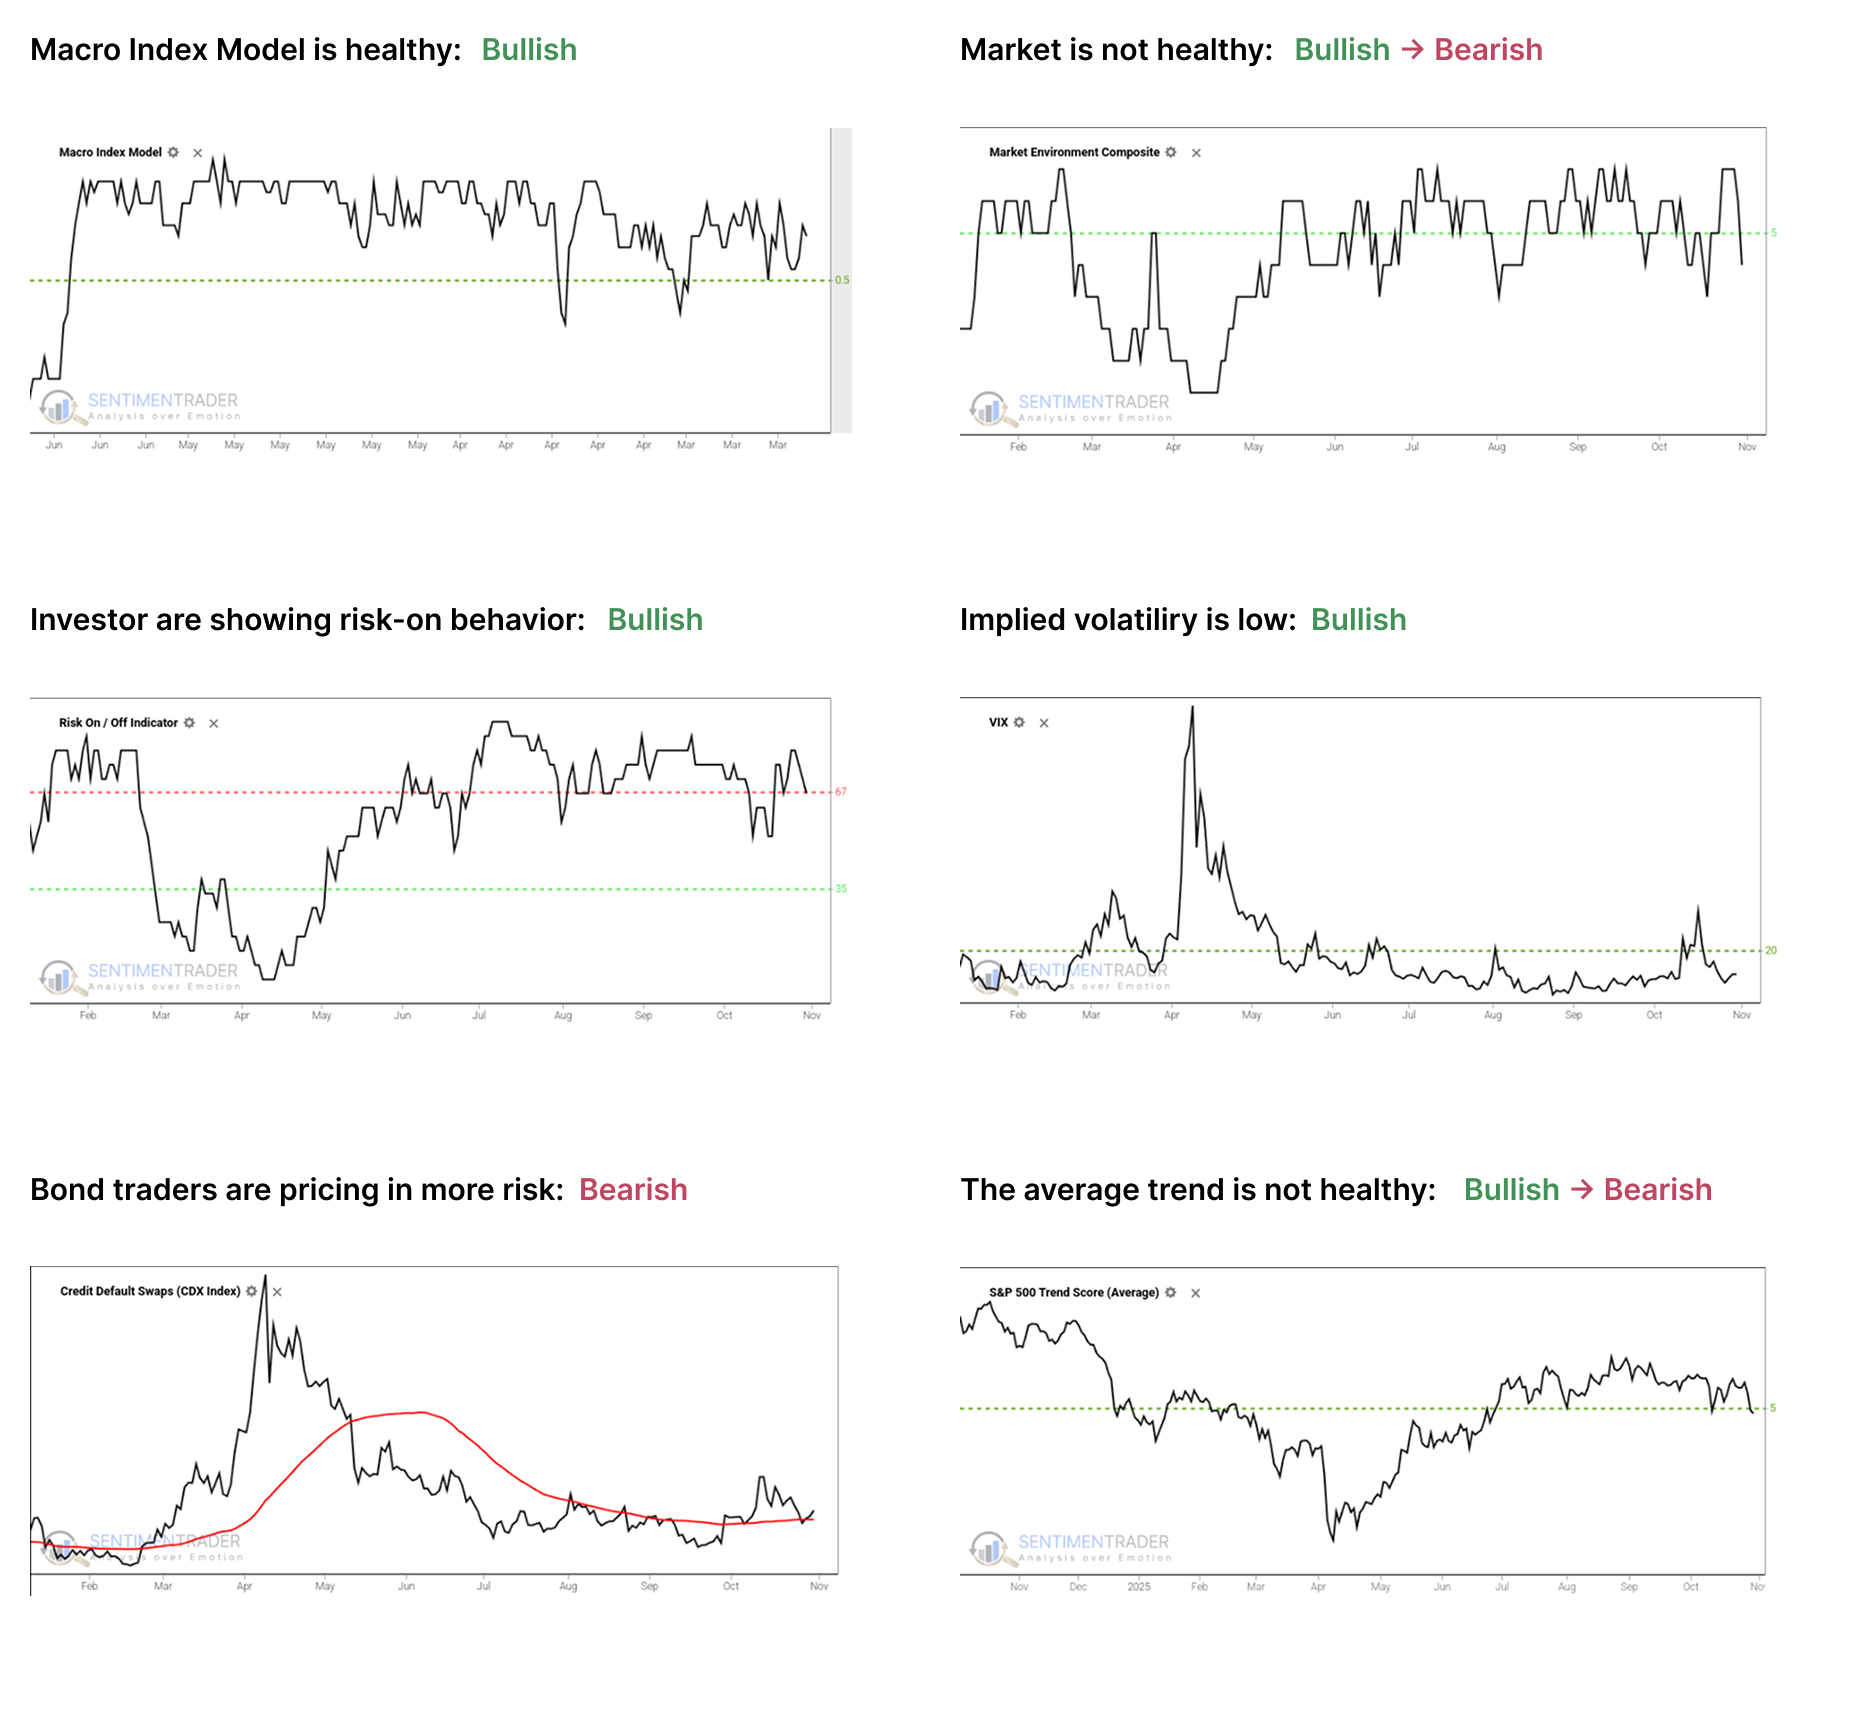
- The Macro Index Model is above the 50% threshold, which has been a vital level as outlined here.
- The Market Environment has been skittish since April, and has slipped into an unhealthy condition. Future returns, especially for higher-beta indices, have historically been notably weaker, with greater risk, when the environment is unhealthy as outlined here.
- The Risk On / Off Indicator shows that investors are still in risk-on mode. This has been a good sign for future returns as outlined here.
- Implied volatility remains below 20, showing a calm environment. The S&P 500 has perfomed well when this is the case as outlined here.
- Credit default swap spreads are above their 50-day moving average, which is modestly concerning as outlined here.
- A composite of trend measures in SPY and the average S&P 500 stock remain below 5, which show unhealthy trend conditions.
Since April, the most compelling studies have had a strongly bullish bias on longer time frames. You can follow these through the Active Studies page. From time to time, when the analysts' studies provide an overwhelming message, it will override the charts above, but there has been no consensus in the studies to suggest overriding the bullish environment.
Other major markets have been mostly rangebound for four months, and there is little among what we follow to suggest a compelling edge either way.
Gold and the U.S. Dollar's 8-year cycle
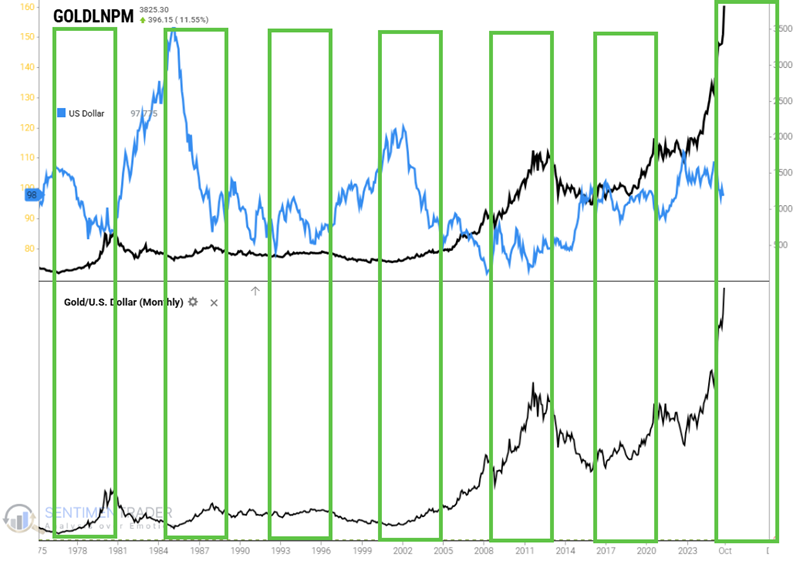
Gold and the U.S. Dollar have a long history of being inversely correlated in terms of price movement. Also, there has long been an 8-year cycle in terms of gold and dollar price movement. Despite the massive rally in gold so far in 2025, we are still early in the latest favorable portion of the 8-year cycle for gold.
The 8-year cycles we will examine include:
- 1976 through 1984
- 1984 through 1992
- 1992 through 2000
- 2000 through 2008
- 2008 through 2016
- 2016 through 2024
The latest cycle began at the end of 2024 and will extend through 2032. We also break each 8-year cycle into two halves:
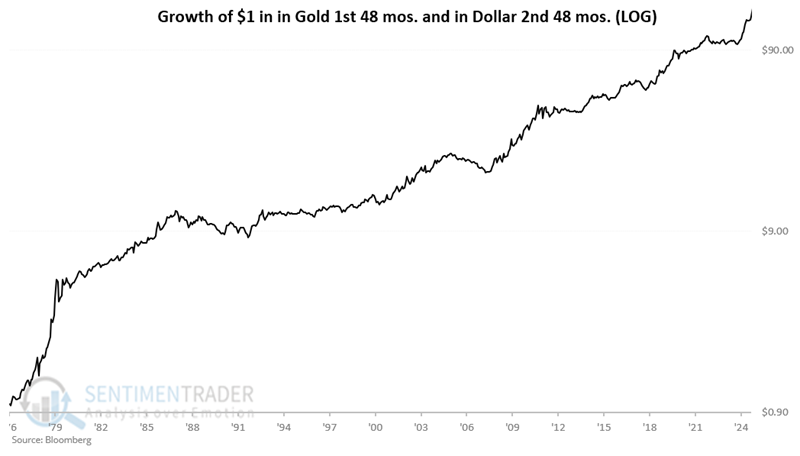
- Months 1 through 48 tend to favor Gold
- Months 49 through 98 tend to favor the U.S. Dollar
Strategy #1: Holds Gold during the first 48 months and the Dollar during the last 48 months showed hypothetical growth of $1 to $152.82, or +15,182.2%.
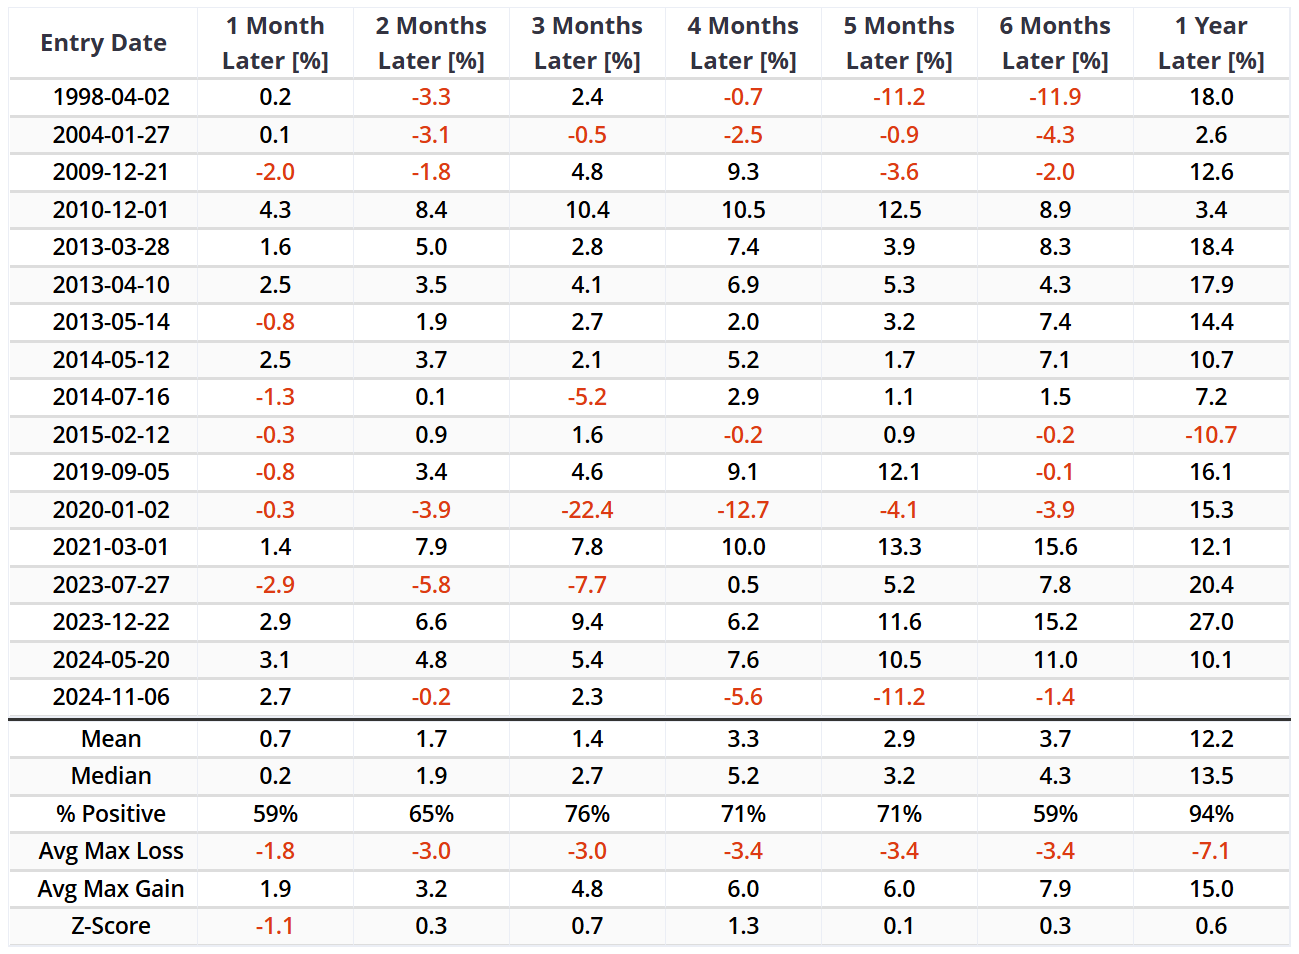
S&P 500 reaches new highs with strong sector participation
As the S&P 500 reached a new high, over 12% of stocks in the Technology, Industrials, and Communication Services sectors simultaneously registered a 52-week high. The S&P 500 Trend Score reached a perfect 10, further validating this bullish internal picture.
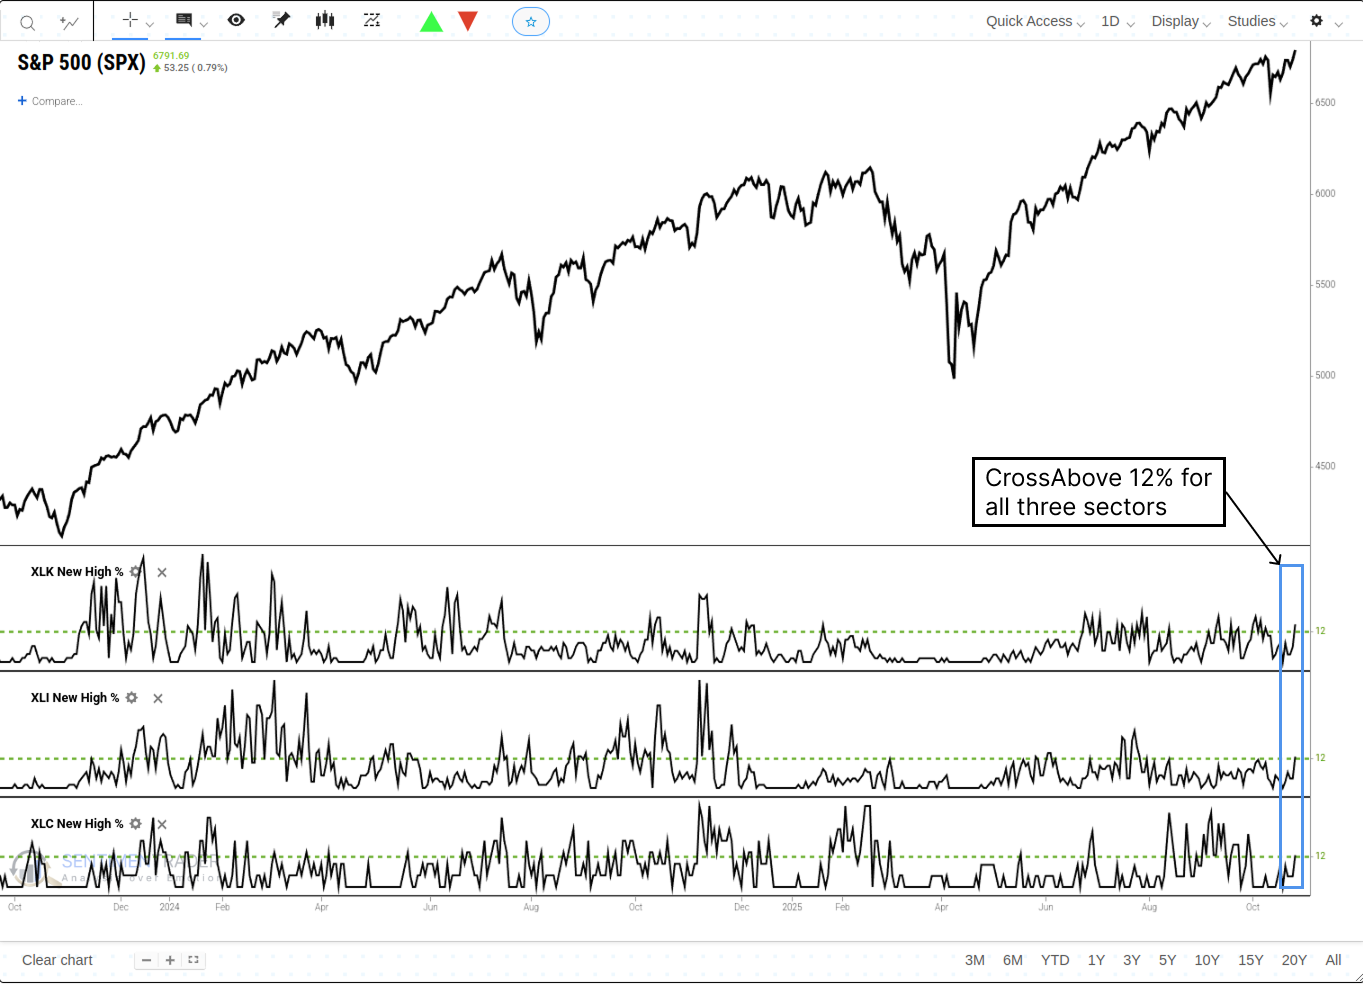
The standout result is clearly the one-year forward performance. Following these signals, the S&P 500 was higher 94% of the time one year later, with a strong median return of +13.5%.
High-yield bond market shows conflicting signals
The core issue in the current market lies in the simultaneous activation of two rare signals with small sample sizes. One is the 'panic capitulation' signal triggered on October 10. The other is the 'long-term exuberance' signal that has persisted for 116 days.
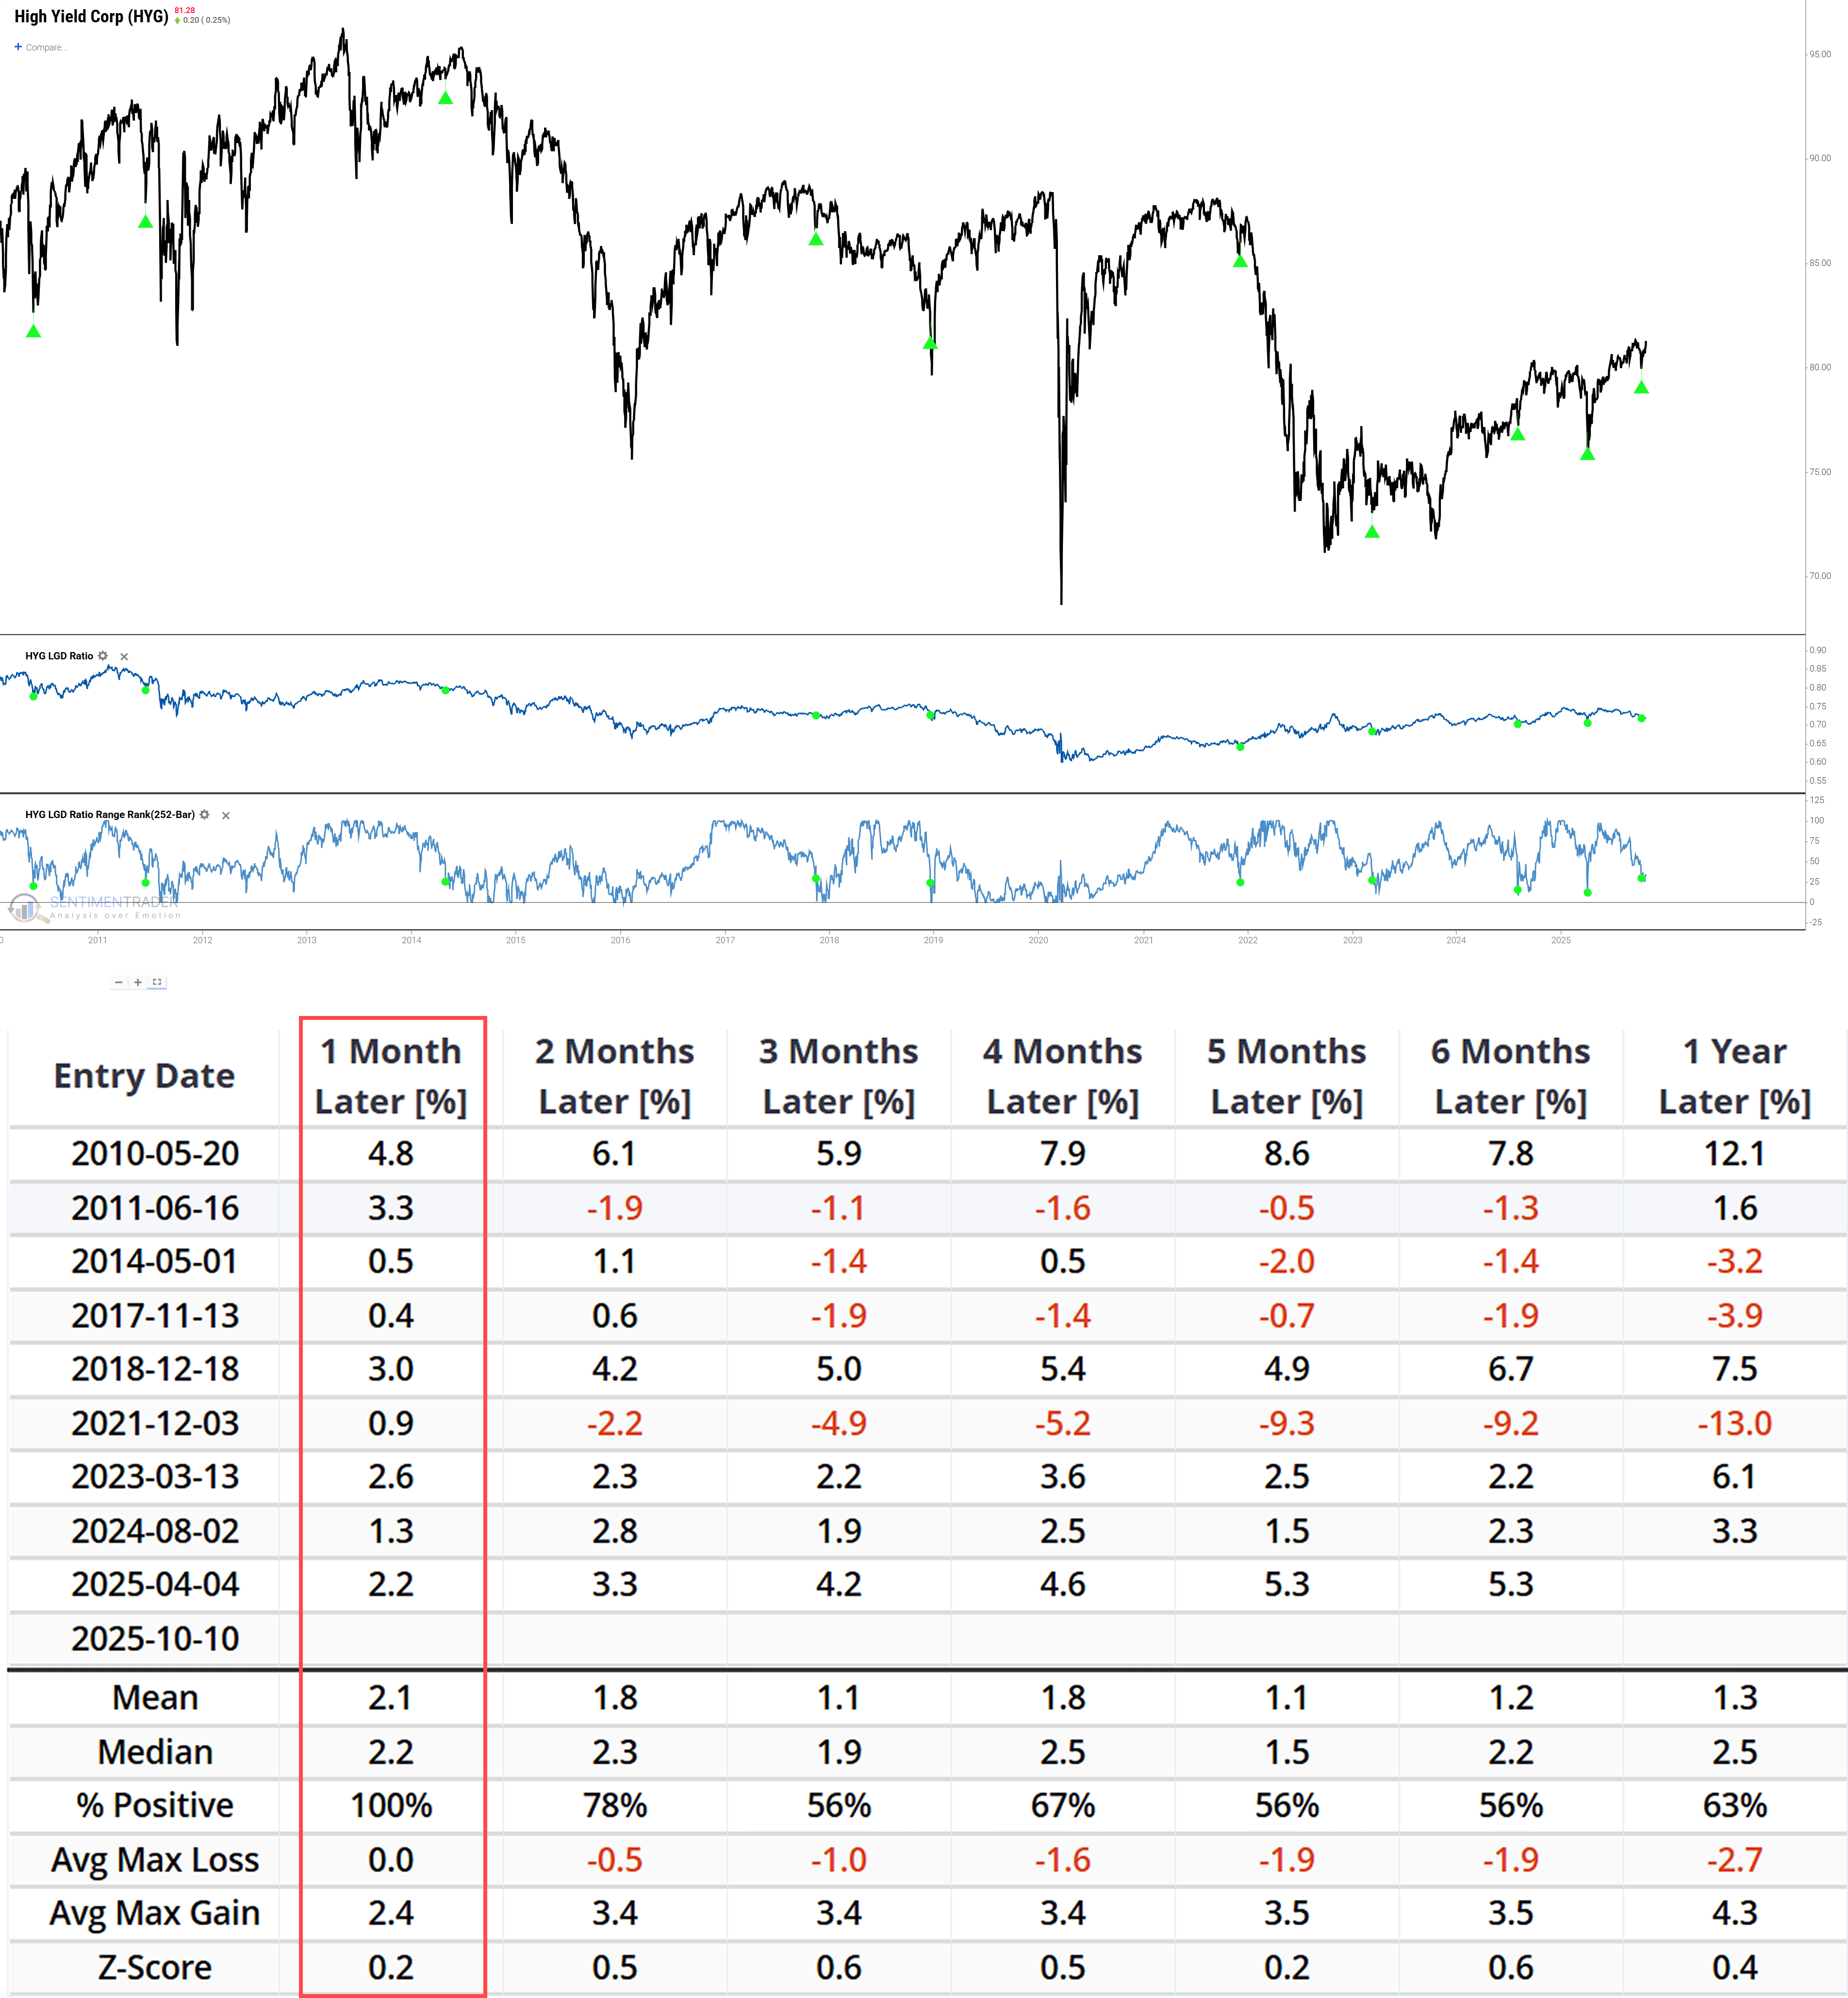
From the trigger of the October signals to the present, the movement of the high-yield bond market has centered around the 'signal conflict': the bullish signal has not expired, yet the market movement fails to keep up.
Semiconductors show counterintuitive bullish signal
A counterintuitive sentiment signal has triggered: the SMH Optix 3-day average crossed above 80% while the ETF is in a long-term uptrend. The semiconductor sector (SMH) is also entering its most favorable seasonal period of the year.
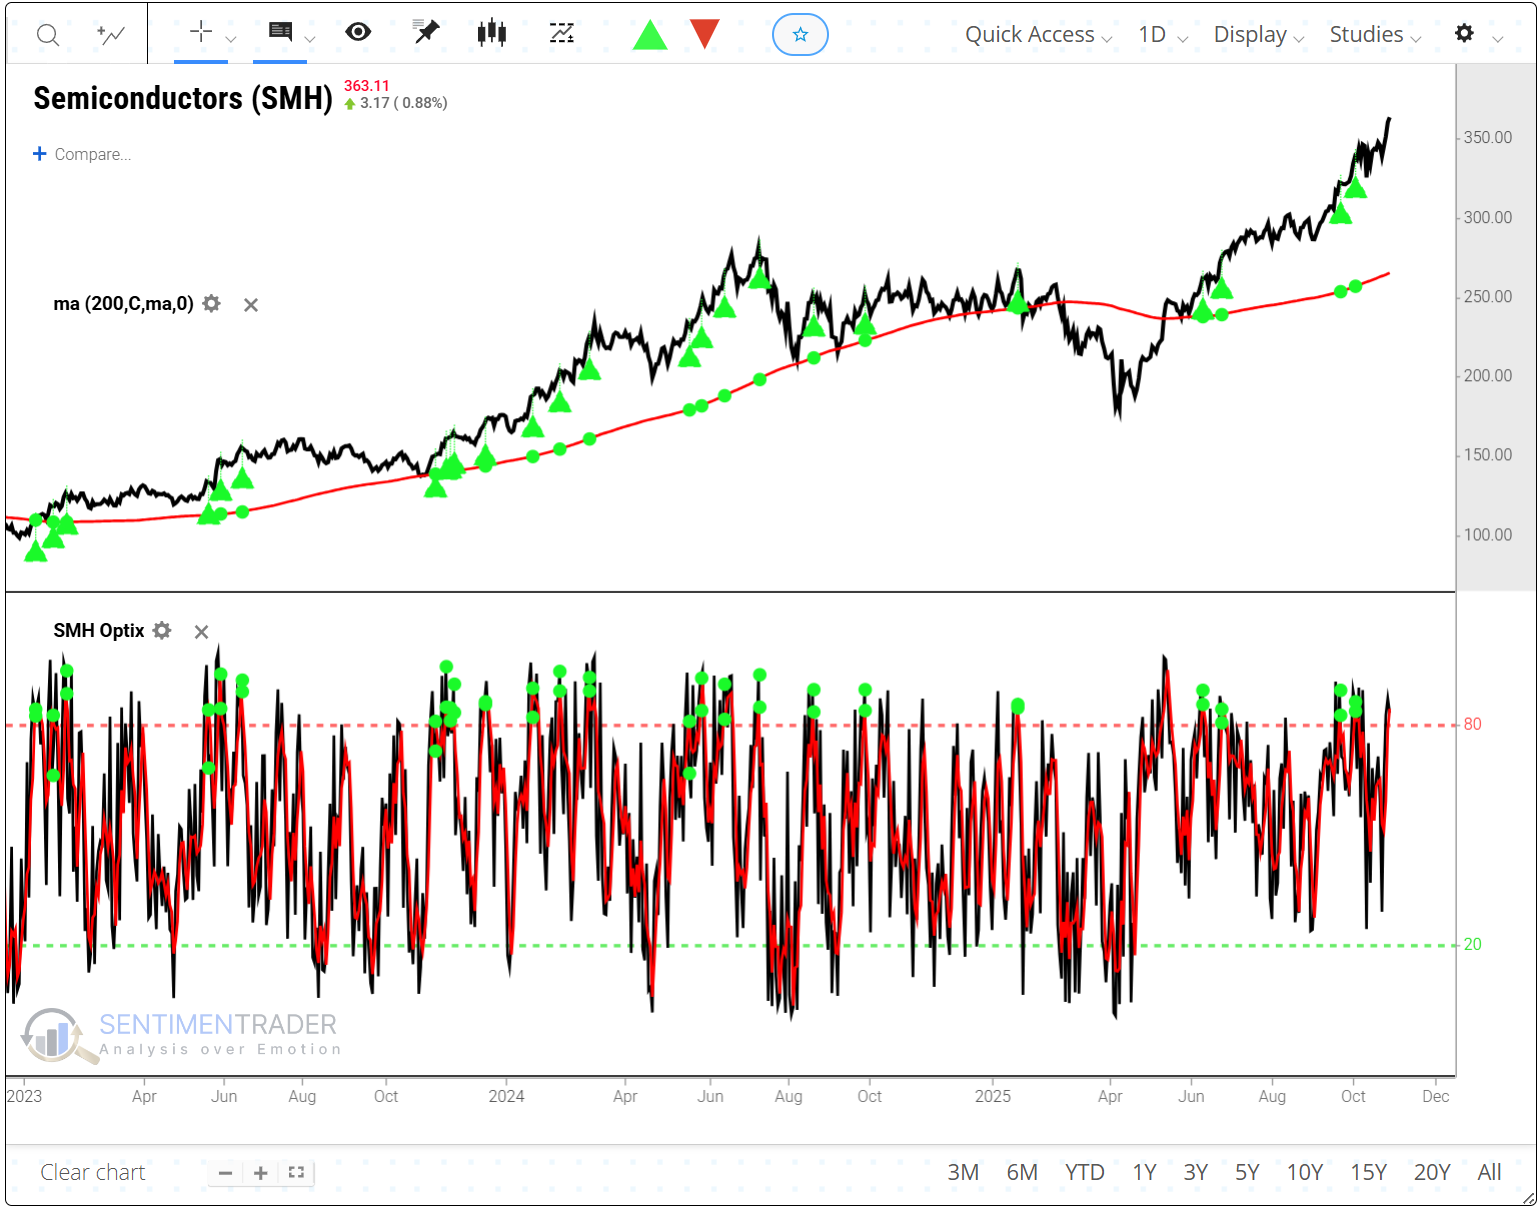
The six- and twelve-month results are compelling, with Win Rates of 82% and 92%, respectively, and Median Returns of +15.5% for six months and +36.1% for twelve months.
Long-term investment strategies suggest bullish outlook
Our Aggregate Signal Model is based on the number of our strategies that are favorable at any given point in time. The High Yield Bond Cumulative A/D Line indicator tracks the cumulative advance/decline line for the high-yield bond market.
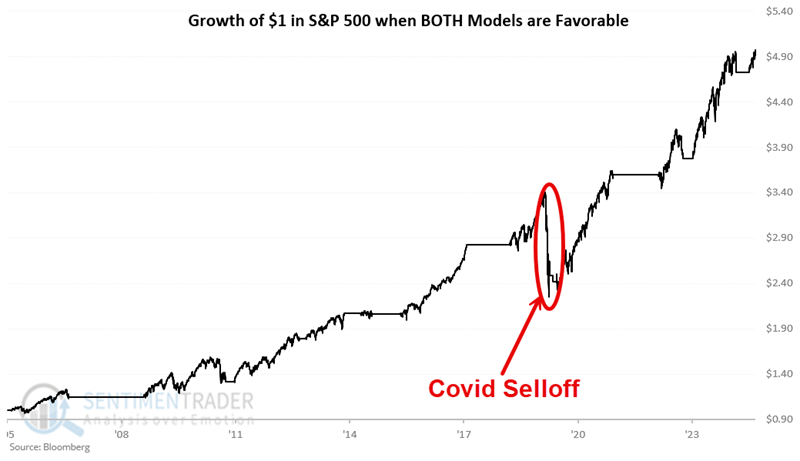
While nothing is ever guaranteed in the stock market, history suggests that when both of the highlighted models show 'Long SPY (S&P 500 ETF)' as their position, the odds favor the bulls.
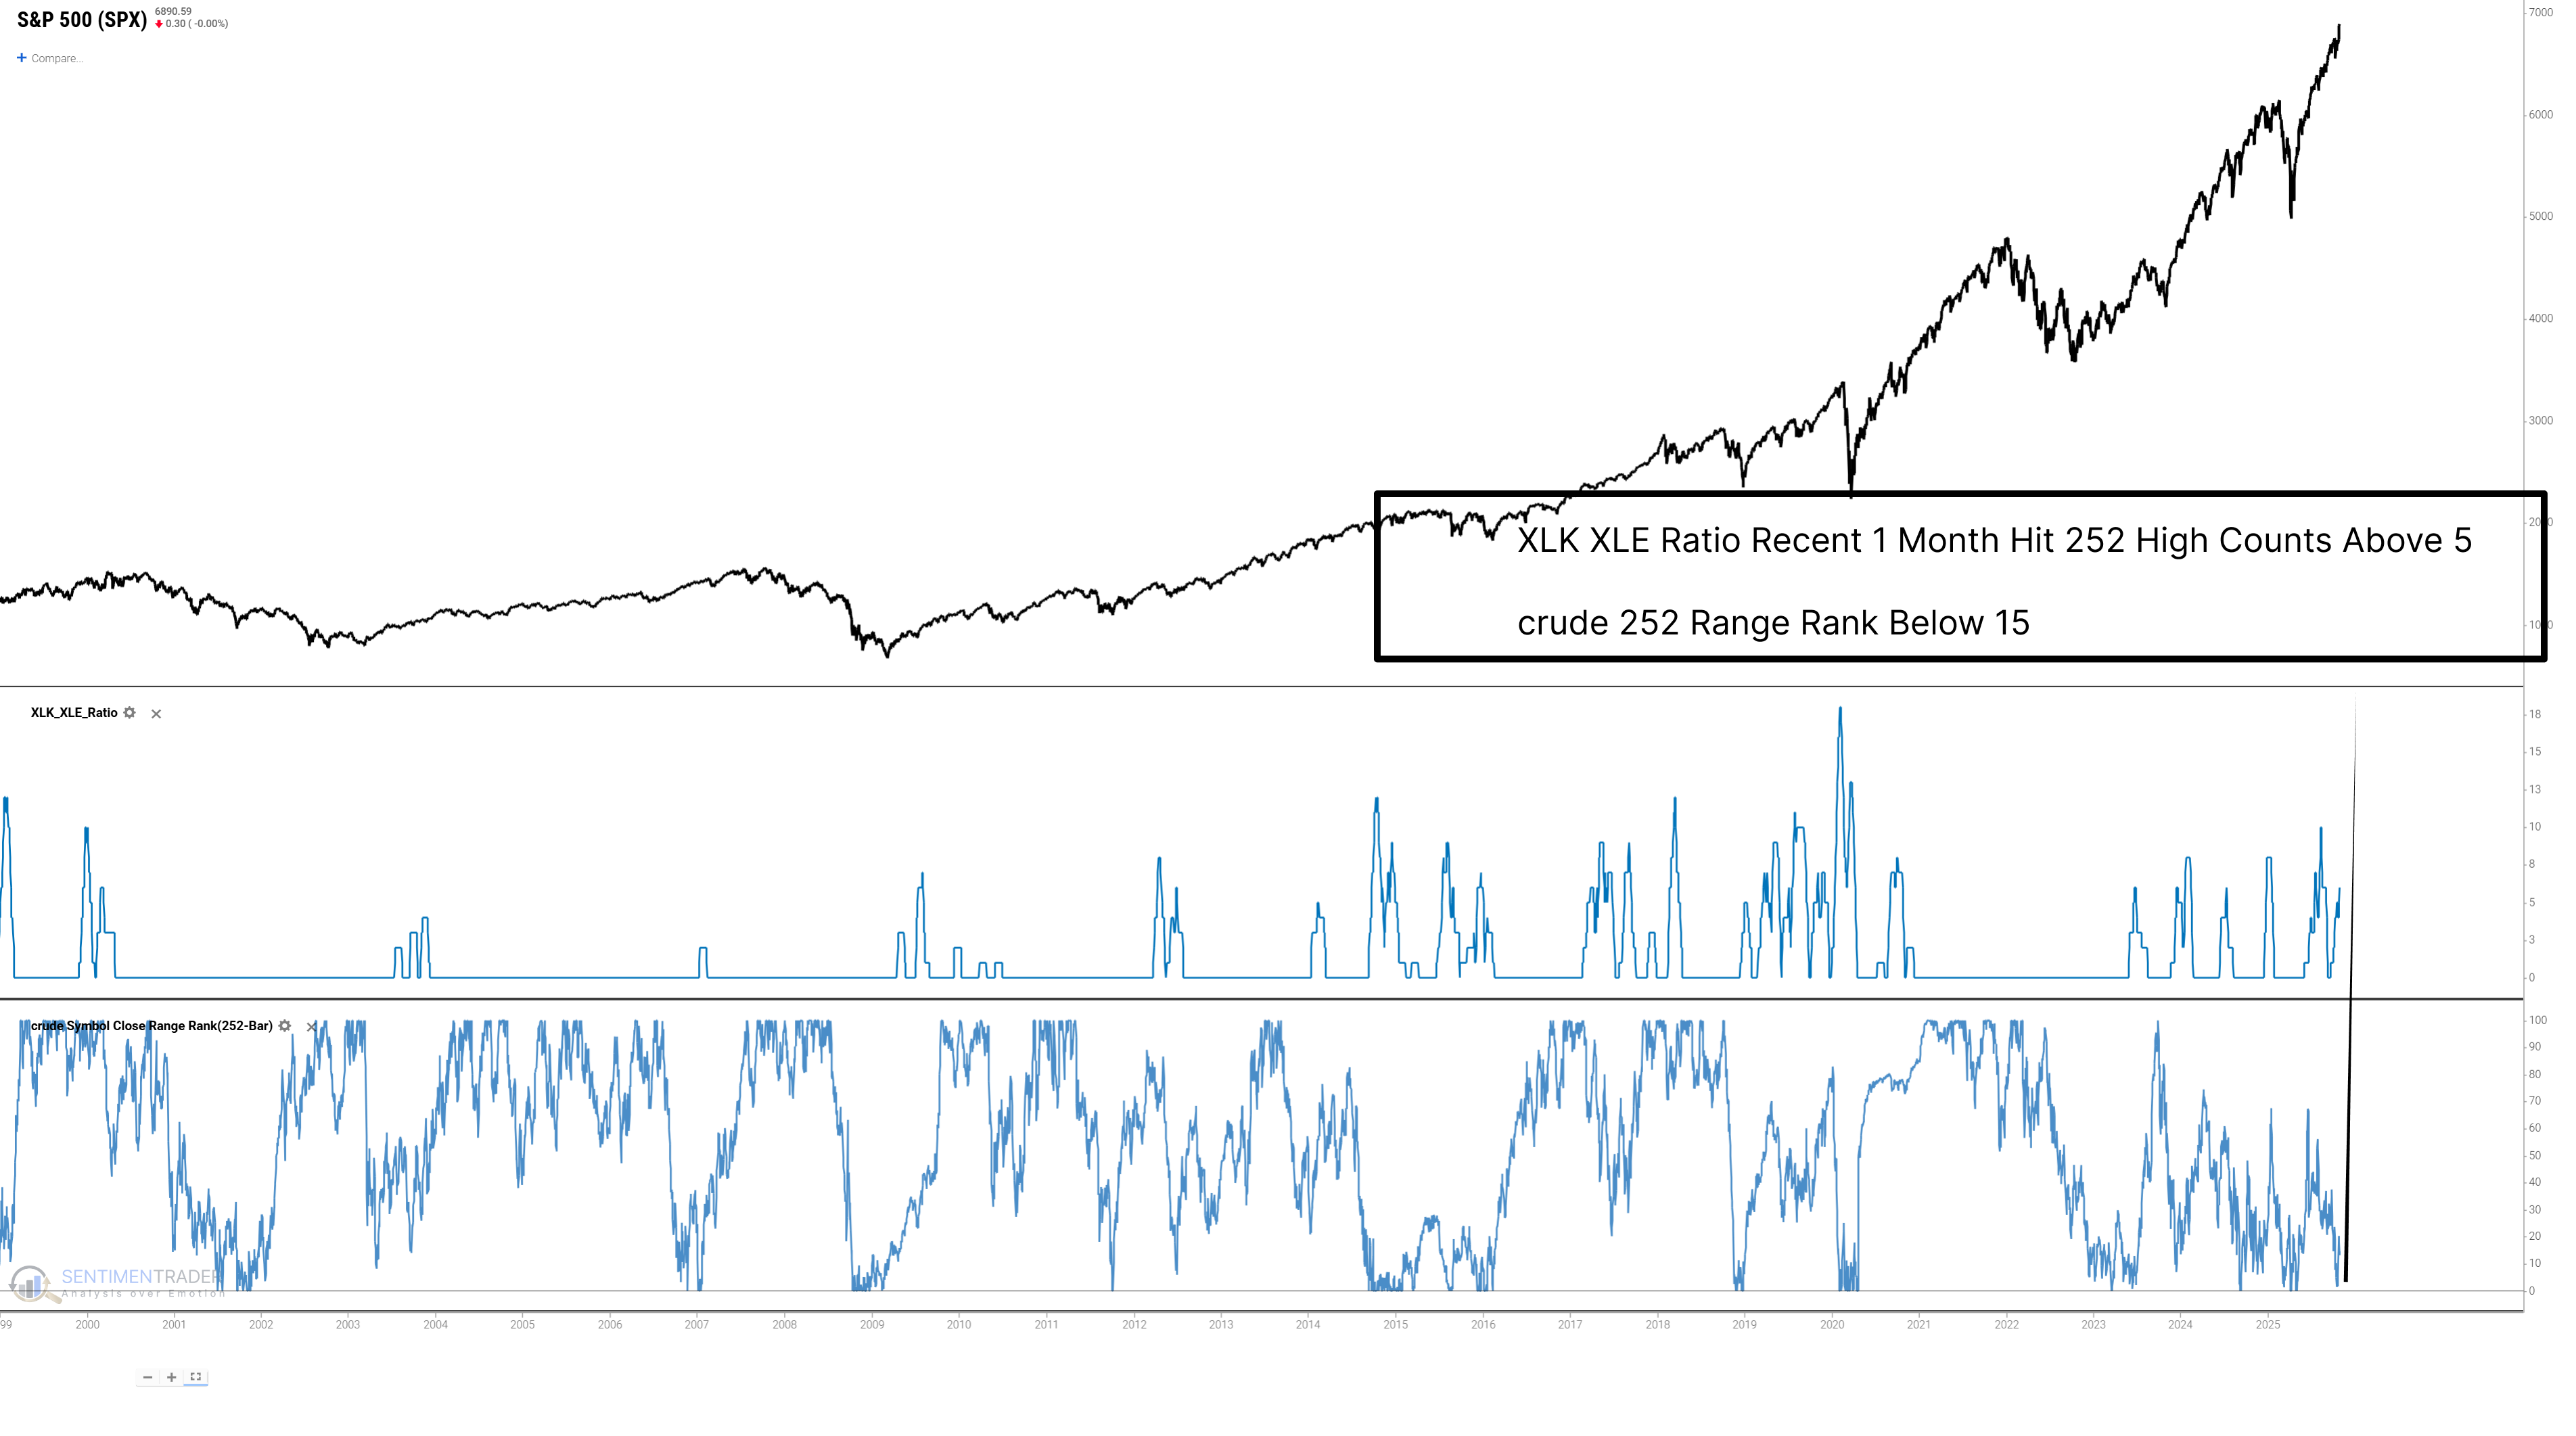
Technology momentum coincides with weakening crude oil prices
Recent market observations reveal a pronounced divergence. On one hand, the Technology/Energy (XLK/XLE) ratio has repeatedly hit annual highs (>5 times) over the past month. On the other hand, a key economic cycle input-crude oil prices-is currently at the lowest 15th percentile of its annual range.
Data shows that classic defensive sectors demonstrated the strongest short-term resilience. Utilities (XLU) (+2.2%) and Consumer Staples (XLP) (+1.4%) were among the sectors with the highest median returns after one month.
About TradingEdge Weekly...
The goal of TradingEdge Weekly is to summarize some of the research published to SentimenTrader over the past week. Sometimes there is a lot to digest, and this summary highlights the highest conviction or most compelling ideas we discussed. This is NOT the published research; rather, it pulls out some of the most relevant parts. It includes links to the published research for convenience, and if you don't subscribe to those products, it will present the options for access.