
TradingEdge Weekly for Oct 3 - Materials sector bullish signals, Crude Oil caution, S&P 500 momentum, Copper-to-AI ratio warnings

Key points:
- Materials sector shows bullish insider activity and favorable seasonality
- Crude Oil enters weakest seasonal period with bearish trend
- S&P 500 demonstrates strong momentum with five consecutive up months
- Copper-to-AI ratio reaches historically dangerous extreme
- Communication Services sector shows breadth thrust signal
- Market sentiment shifts to 'Returning Confidence' phase
House view:
- Stocks:
- Short-term:Modestly bullish. U.S. major stock indices have maintained an upward trajectory recently, with market momentum primarily fueled by the tech sector. Chipmakers have been a key driver of the rally: industry leaders have seen sustained gains amid positive signals from the semiconductor supply chain, including reports that OpenAI's "Stargate" project has secured large-scale wafer supplies from major manufacturers . Meanwhile, Tesla's stock has seen adjustments following the release of its Q3 delivery data, as the market weighs concerns over potential changes to U.S. EV subsidy policies . Broader market sentiment has been buoyed by expectations that any potential U.S. government shutdown may be short-lived, which has helped ease earlier caution . Market breadth has shown improvement, with advancing stocks outnumbering decliners, and Chinese concept stocks (e.g., Alibaba) have performed relatively well, supported by institutional rating upgrades . Seasonal factors typically favorable for Q4 have started to manifest, overriding the cautious tone seen in late September .Time frame: 1-4 weeks.
- Intermediate-term: No view. Valuations remain elevated relative to historical averages, but this is offset by two key supports: 1) Fed officials (e.g., 2026 voter Logan) have emphasized a "cautious easing" stance, ruling out aggressive rate hikes while maintaining relatively loose liquidity conditions ; 2) Spending on AI infrastructure continues to drive profit growth in tech and semiconductor sectors, with market attention focused on valuation trends of leading AI-related firms . However, significant divergence persists across sectors: defensive sectors (e.g., energy) have lagged amid concerns over demand fundamentals, signaling investor skepticism about the breadth of economic growth . While most stocks remain above their medium-term moving averages, uncertainty around earnings in consumer and industrial sectors has created tension between technical strength and fundamental conditions .Time frame: 1-5 months.
- Long-term: Bullish. The economic recovery is increasingly anchored by technological innovation companies tied to AI (e.g., chipmakers), cloud computing, and digital transformation have delivered outsized profitability . Long-term breadth measures have improved, with a significant share of S&P 500 components maintaining upward trends above their 200-day moving averages, a signal of sustained market expansion . Structural tailwinds, including the Fed's easing cycle and global investment in AI, are expected to outweigh near-term valuation pressures .This time frame covers 6-12 months.
- Cyclical momentum: Favors tech, semiconductors, and AI infrastructure sectors, which have historically outperformed in liquidity-driven rallies .
- Defensive resilience: Utilities and consumer staples offer potential hedges against volatility but face limited upside amid tech-led growth .
- Longer-term: Small-cap stocks may benefit from seasonal capital flows in Q4, though mega-cap tech is likely to retain leadership until AI spending peaks .
- Bonds: Long-termcycles remain bearish, but short-termpressure has eased. The 10-year U.S. Treasury yield has declined recently to a multi-week low, with expectations for the release of delayed nonfarm payroll data helping reduce market uncertainty . While the Fed's "cautious easing" stance initially pushed yields lower, institutional selling of long-dated bonds persists amid concerns over fiscal deficits and increased Treasury issuance . The yield curve has steepened modestly, with short-term yields seeing slight upward movement, reflecting mixed market expectations for near-term monetary policy . Analyst research suggests structural headwinds (such as supply glut concerns) will linger, but short-term demand for safe-haven assets amid government shutdown risks may limit further yield rises .
- Commodities: Signs of a secular bull market are mixed,with significant divergence across subsectors. An effective commodity trend model remains cautiously bullish .
- Gold: Has pulled back slightly after a multi-day rally, as Fed "cautious" policy remarks dented rate-cut expectations. However, long-term support remains intact due to ongoing central bank buying and geopolitical uncertainty .
- Oil: Crude prices have declined to multi-month lows amid concerns over oversupply, offsetting warnings about potential price spikes from supply disruptions .
- Industrial metals: Copper prices have risen to near one-year highs, driven by robust demand from AI data centers and electric vehicle battery production .
- Crypto: We follow several simple systems for bitcoin, which we consider the equivalent of the S&P 500 for crypto. Due to bitcoin's explosive growth over long periods, it's dangerous to equate neutral conditions with being bearish for some of these. However, if a system is "out," we consider it bearish for this summary.
- Triple 40: Modestly Bullish
- RSI Momentum: Bullish
- Trend and Relative Trend: Bearish→ Modestly Bullish
- PMI: Bearish
- M2 ROC: Bullish
Where we're at
Most investors have the most riding on equities. We feel that the most significant determinants of success for investors are whether to adjust their allocation to that asset class based on factors that have historically had a good record of preceding above- or below-random returns in the months ahead.
Those factors include the probability of a looming recession, sentiment, price action, volatility, breadth, and the bond market. The chart below summarizes the main indicators and composite models we watch for those factors, and they're mostly in bullish regimes. Valuations are not part of these factors since the relationship has been too inconsistent on time frames under one year.
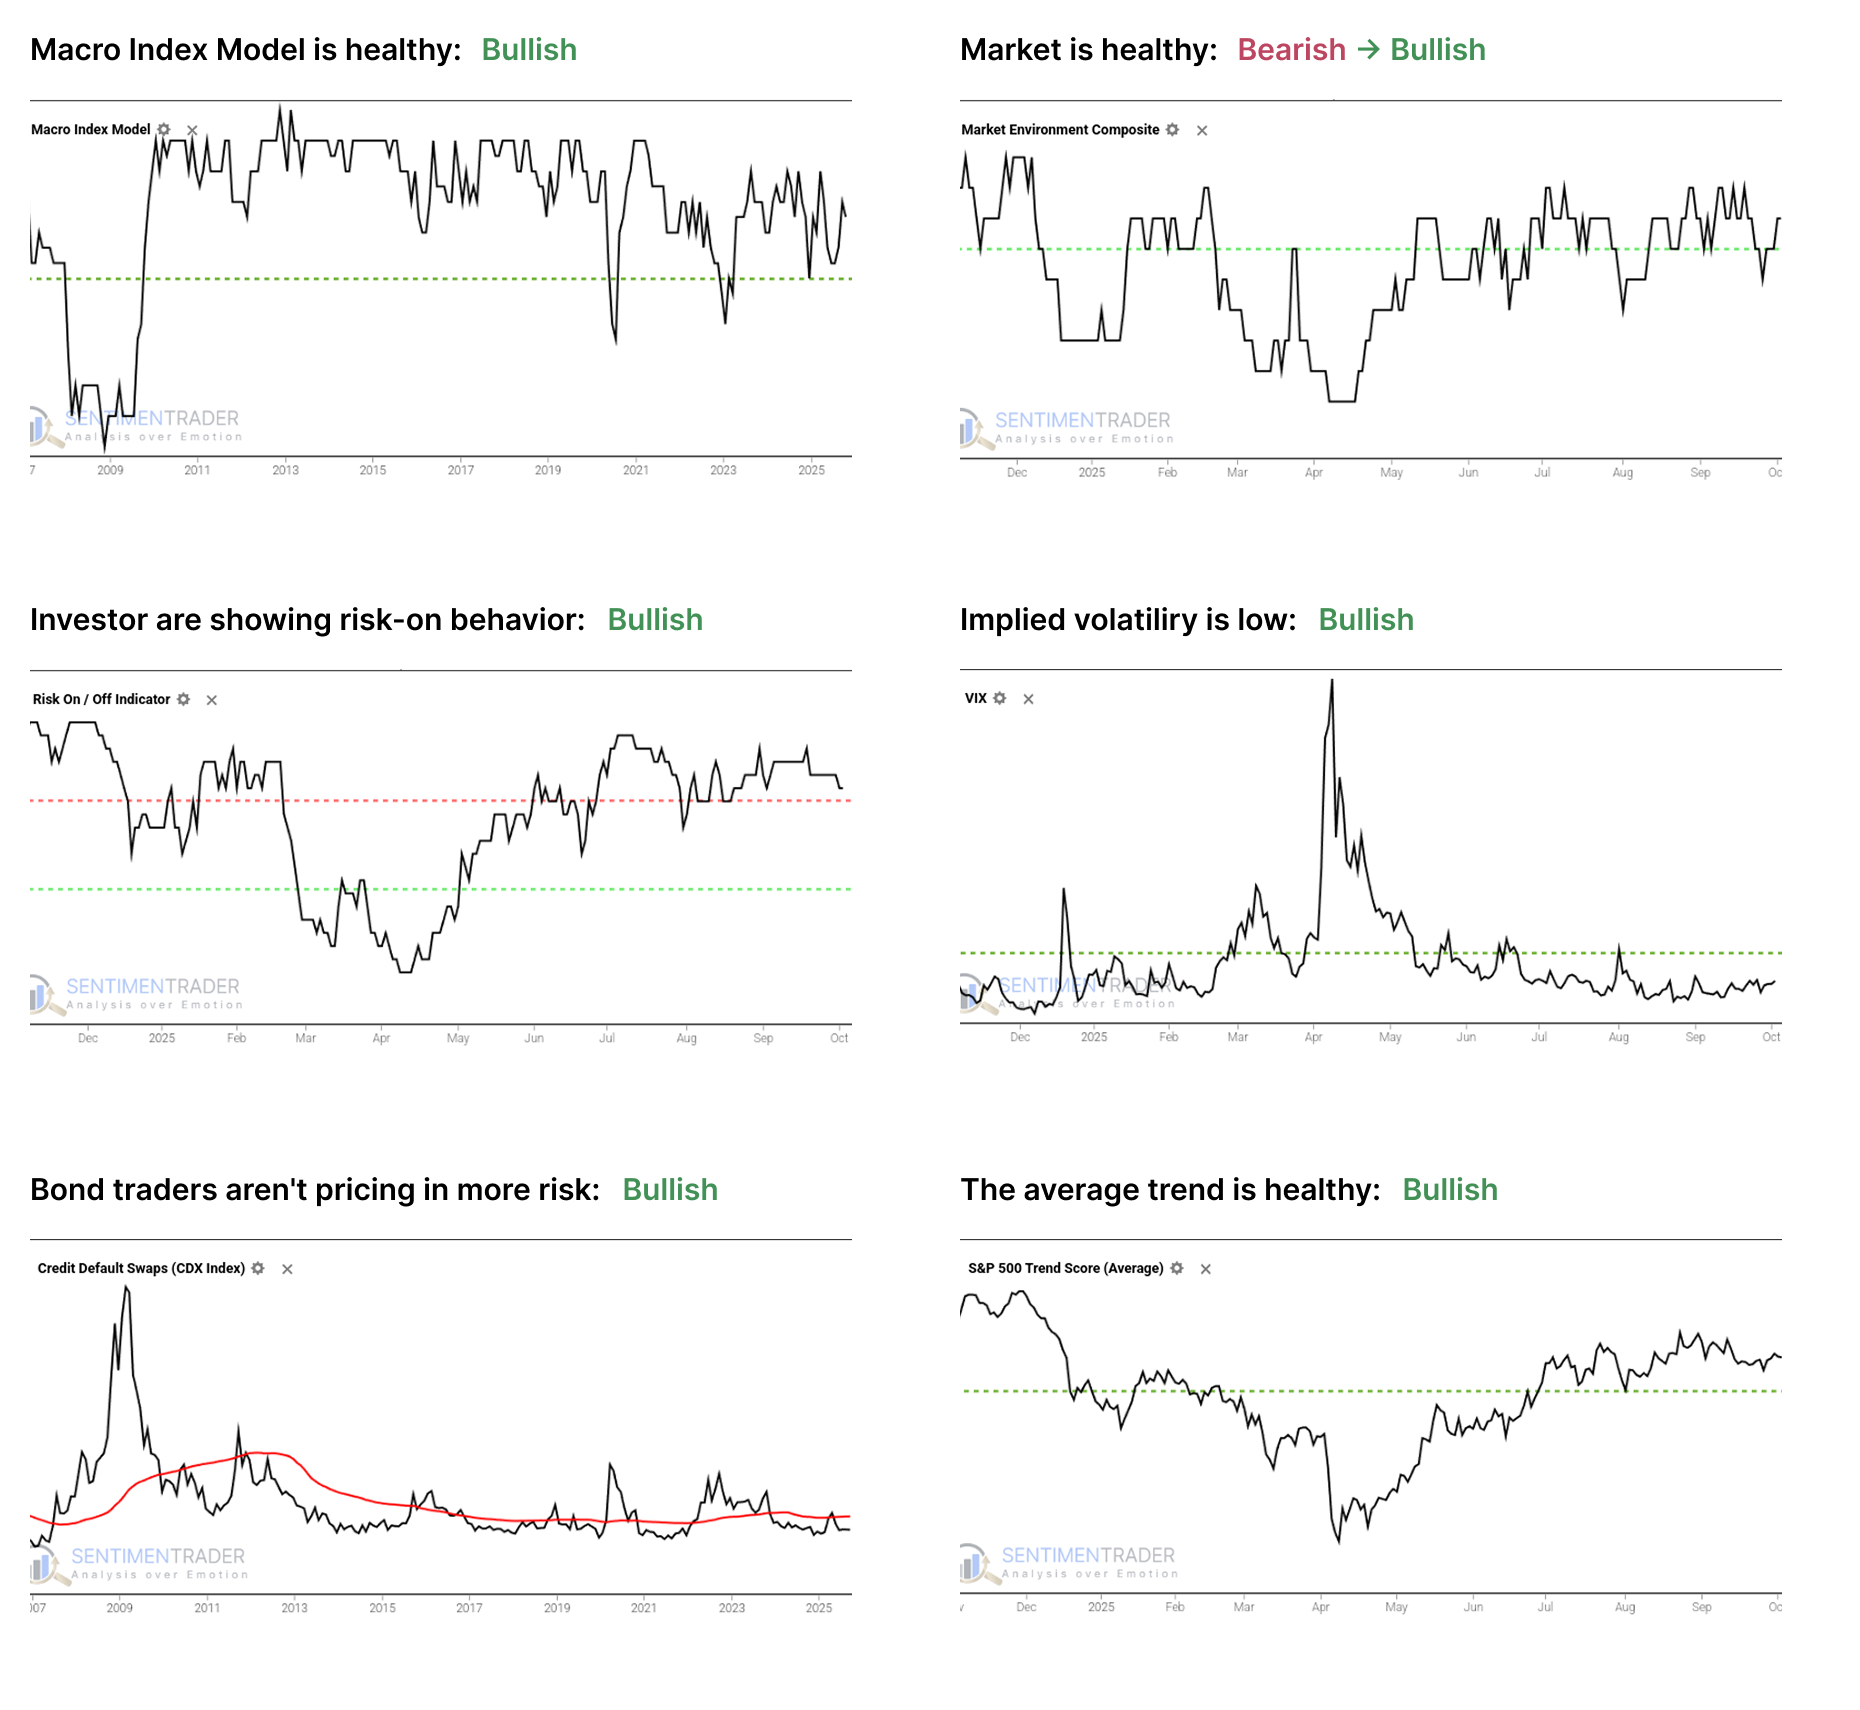
- The Macro Index Model is above the 50% threshold, which has been a vital level as outlined here.
- The Market Environment has been skittish since April, but is currently healthy. Future returns, especially for higher-beta indices, has been markedly better, with less risk, when the environment is healthy as outlined here.
- The Risk On / Off Indicator shows that investors are still in risk-on mode. This has been a good sign for future returns as outlined here.
- Implied volatility remains below 20, showing a calm environment. The S&P 500 has perfomed well when this is the case as outlined here.
- Credit default swap spreads are below their 50-day moving average, which drastically improves stock returns as outlined here.
- A composite of trend measures in SPY and the average S&P 500 stock remain above 5, which show healthy trend conditions.
Since April, the most compelling studies have had a strongly bullish bias on longer time frames. You can follow these through the Active Studies page. From time to time, when the analysts' studies provide an overwhelming message, it will override the charts above, but there has been no consensus in the studies to suggest overriding the bullish environment. Other major markets have been mostly rangebound for four months, and there is little among what we follow to suggest a compelling edge either way.
Materials sector insider activity remains bullish despite strong rally
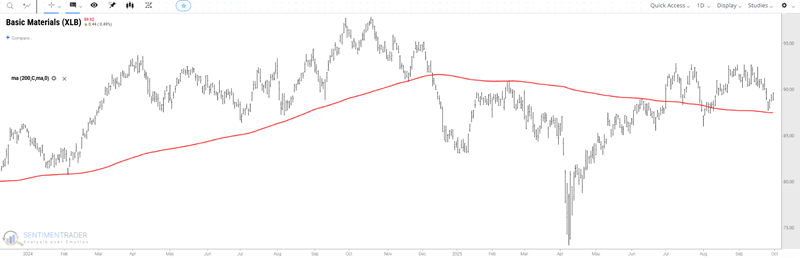
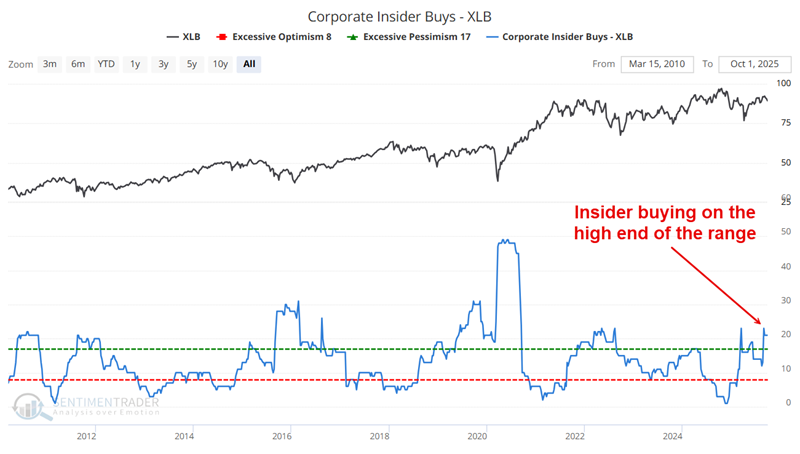
The Materials Select Sector SPDR Fund (XLB) has rebounded significantly off its April 2025 low and re-established an uptrend above its 200-day moving average. XLB recently retested the 200-day moving average and bounced off of it.
Although XLB has already rallied 25%, corporate sector insiders have only recently started to exhibit some bullish activity. The chart below highlights all weeks when the Corporate Insider Buy/Sell Ratio-XLB indicator was above 0.35. 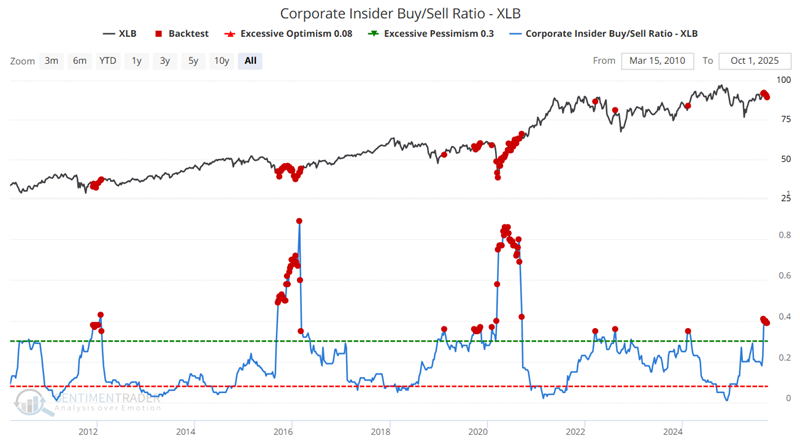
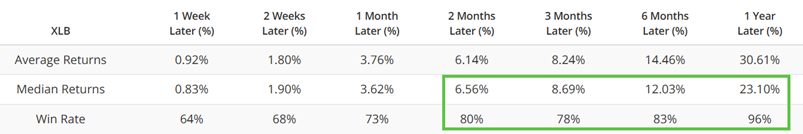
The table below summarizes subsequent XLB performance following the dates highlighted in the chart above.
Insider buying is presently in bullish territory as seen below.
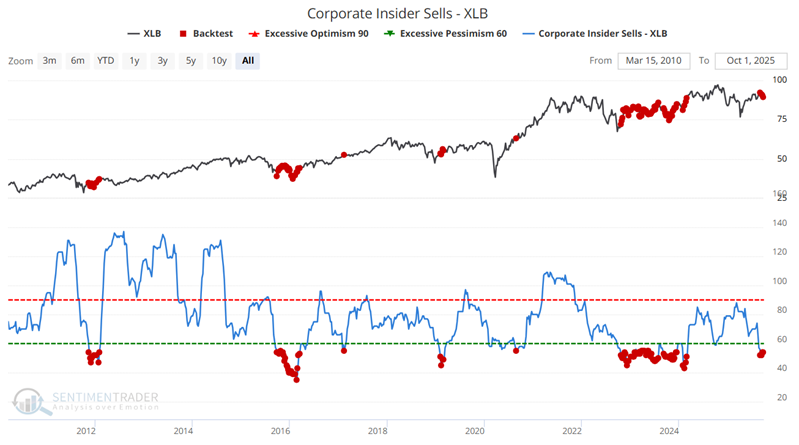
Still, the most notable aspect of recent activity is the plunge in sector insider selling. The chart below highlights all weeks when our Corporate Insider Sells - XLB indicator was below 56. Historically, this has been a good time to accumulate shares in this sector. The most recent signal occurred in late September.
The table below summarizes subsequent XLB performance.
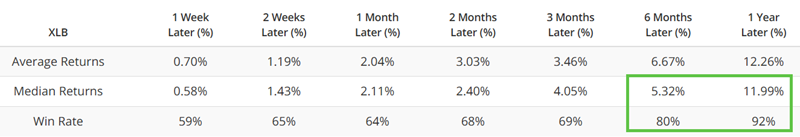
The good news is that recent insider activity strongly suggests higher prices for stocks in this sector over the coming twelve months.
Component correlation is another favorable factor for Materials
Our component correlation indicator measures the degree to which the sector index component stocks trade similarly. Typically, it is favorable when there is a high degree of correlation. The chart below highlights all dates when the XLB Component Correlation indicator was above 0.75.
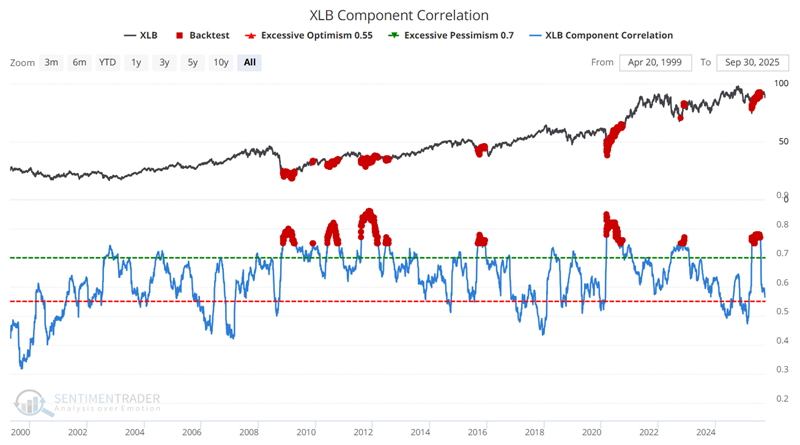
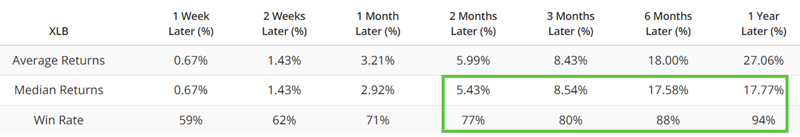
The table below summarizes XLB performance following the dates highlighted in the chart above. Most notable is the high Win Rates two months and out. This dovetails nicely with the insider action highlighted above.
Seasonality will soon be a favorable factor
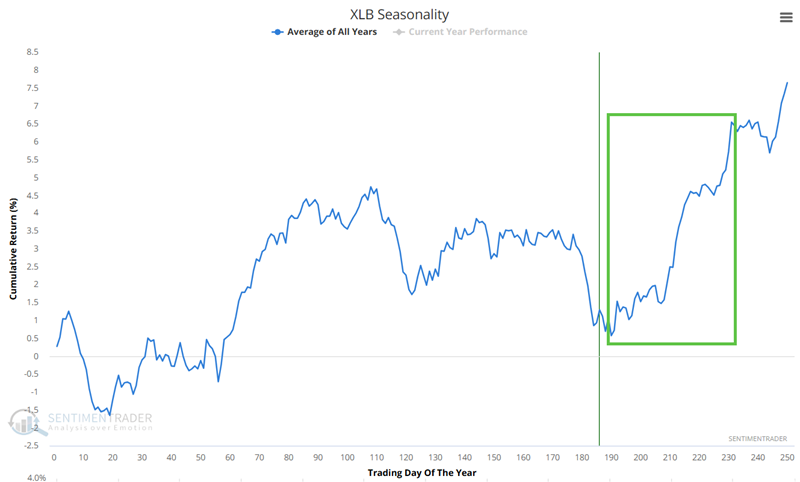
The chart below displays the Annual Seasonal Trend for ticker XLB. A strong seasonal period will begin soon, extending from Trading Day of Year (TDY) #190 through #231. For 2025, this period extends from the close on October 6th through December 3rd.,
The chart below shows the hypothetical growth of $1 invested in ticker XLB only during this period every year since 1999.
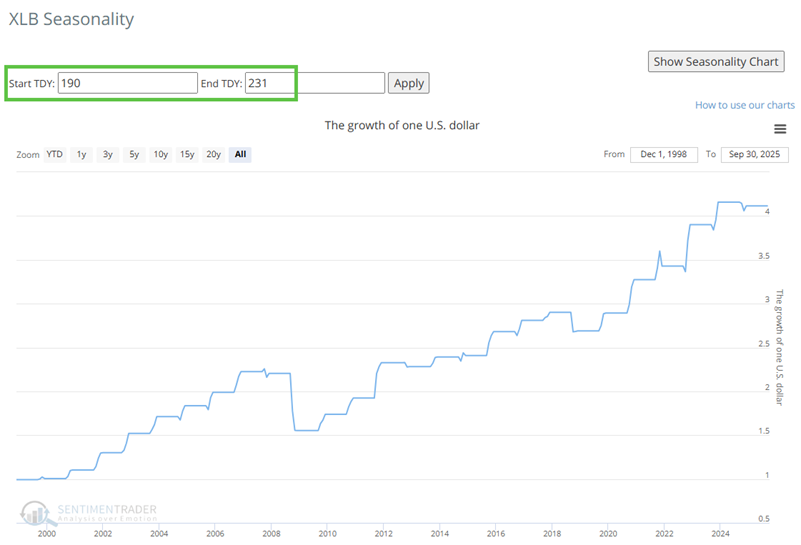
As always, seasonality is merely an average of the past and not a roadmap for the future. Nevertheless, it will soon rank as a favorable factor for the materials sector.
Price Action and Seasonality Suggest Caution in Crude Oil
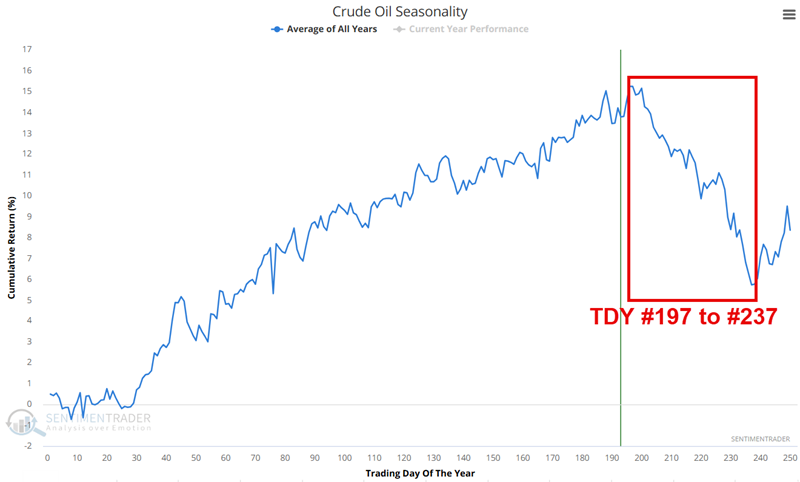
The chart below displays the annual seasonal trend for crude oil futures. Note the tendency for severe weakness between Trading Day of the Year (TDY) #197 and #237. For 2025, this period runs from the close on October 6th to December 1st.
The chart below displays the hypothetical equity achieved by holding a long position in crude oil only during this period every year since 1983.
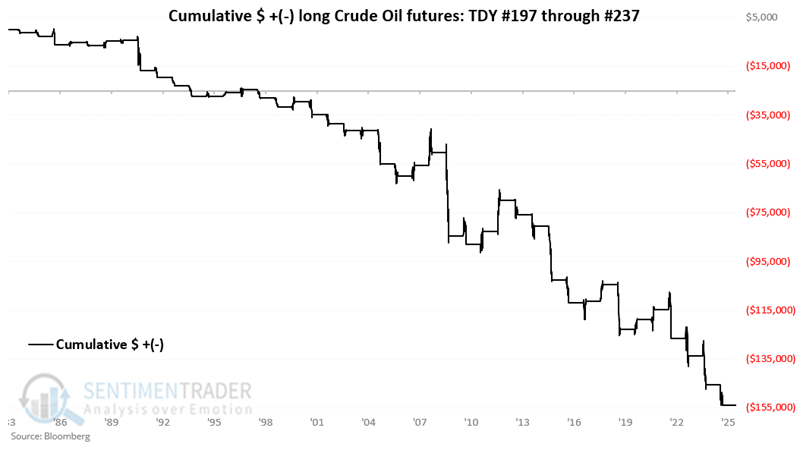
There is no guarantee that crude oil will decline during this period; however, it is clearly a dangerous time to try to play the long side. The table below summarizes crude oil futures performance during this period since 1983.
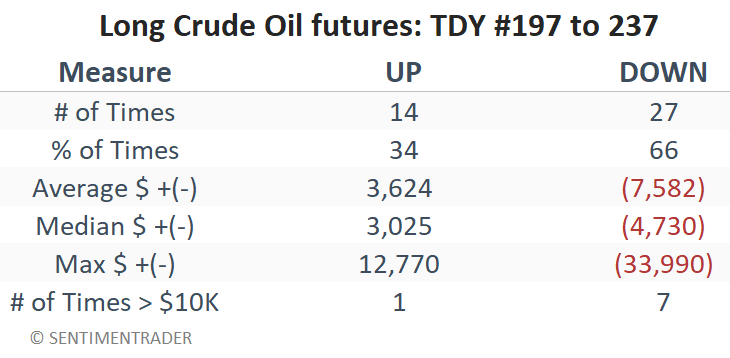
A price decline during this period is no sure thing, as roughly one out of every three years has seen crude oil advance during this period (34% Win Rate). However, note that losses during this period can be severe, and period moves exceeding $10K have skewed to the downside by a factor of 7-to-1.
Five Straight Up Months for the S&P 500
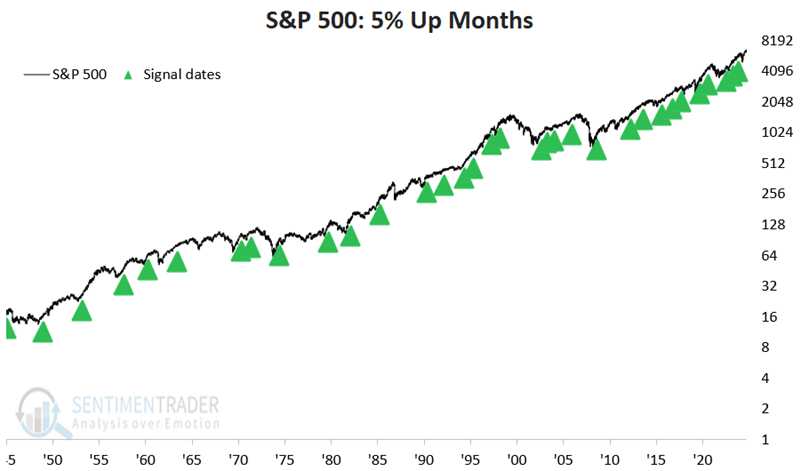
The S&P 500 registered a monthly loss during April 2025. As the end of September approaches, the index is on track to register its fifth consecutive higher monthly close. Intuitively, this causes many investors to presume that the market may \"already be up too much\" and/or that it is due for a pullback (which could be true). However, history suggests this event should fall on the favorable side of the \"weight of the evidence\" ledger.
The chart below highlights with a green arrow all months since 1945 when the S&P 500 closed higher for the fifth consecutive month, following a down month.
The table below displays the price performance for the S&P 500 following the dates highlighted in the chart above.
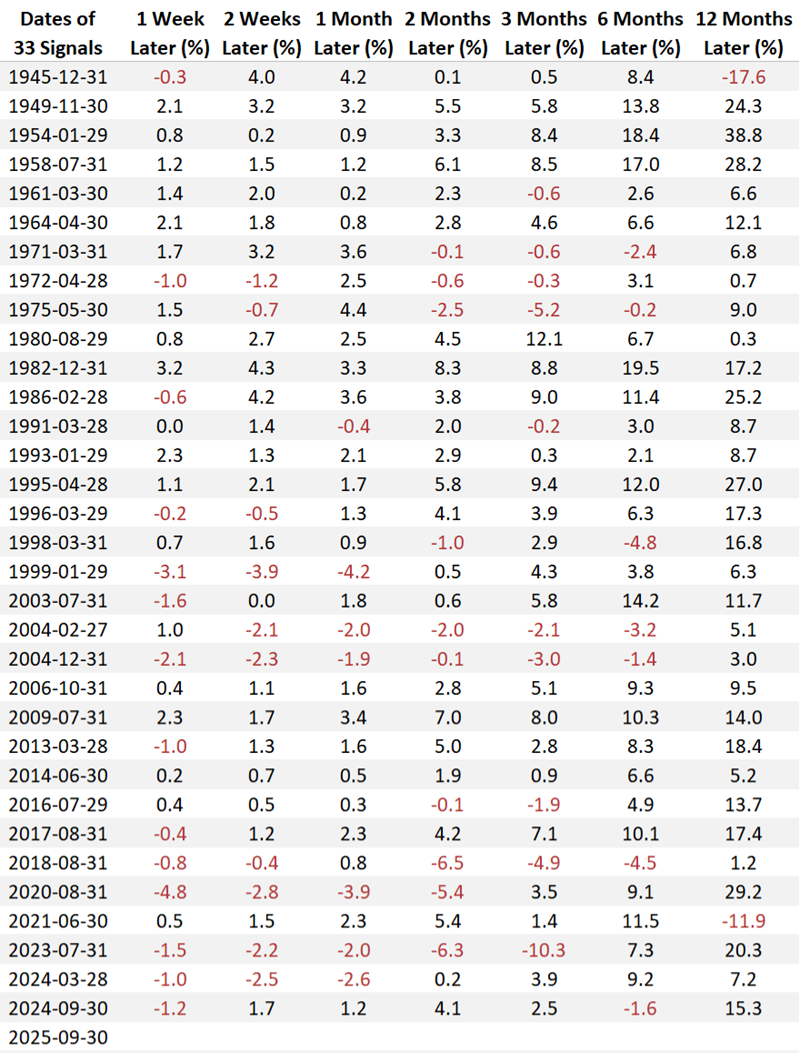
The table below summarizes S&P 500 performance during the periods highlighted in the chart and table above.
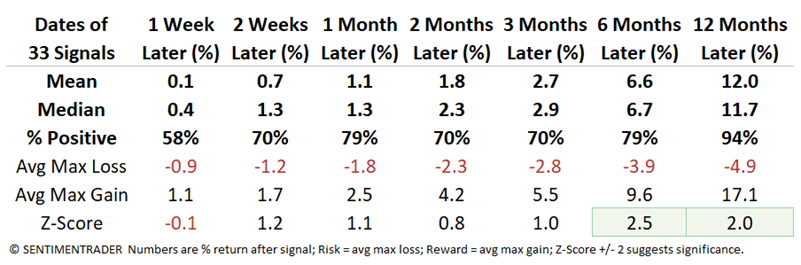
One caveat is that Median Returns are not spectacular. Nevertheless, the Win Rates (especially for six and twelve months) and decent z-scores again suggest that long-term investors continue to give the bullish case the benefit of the doubt for now.
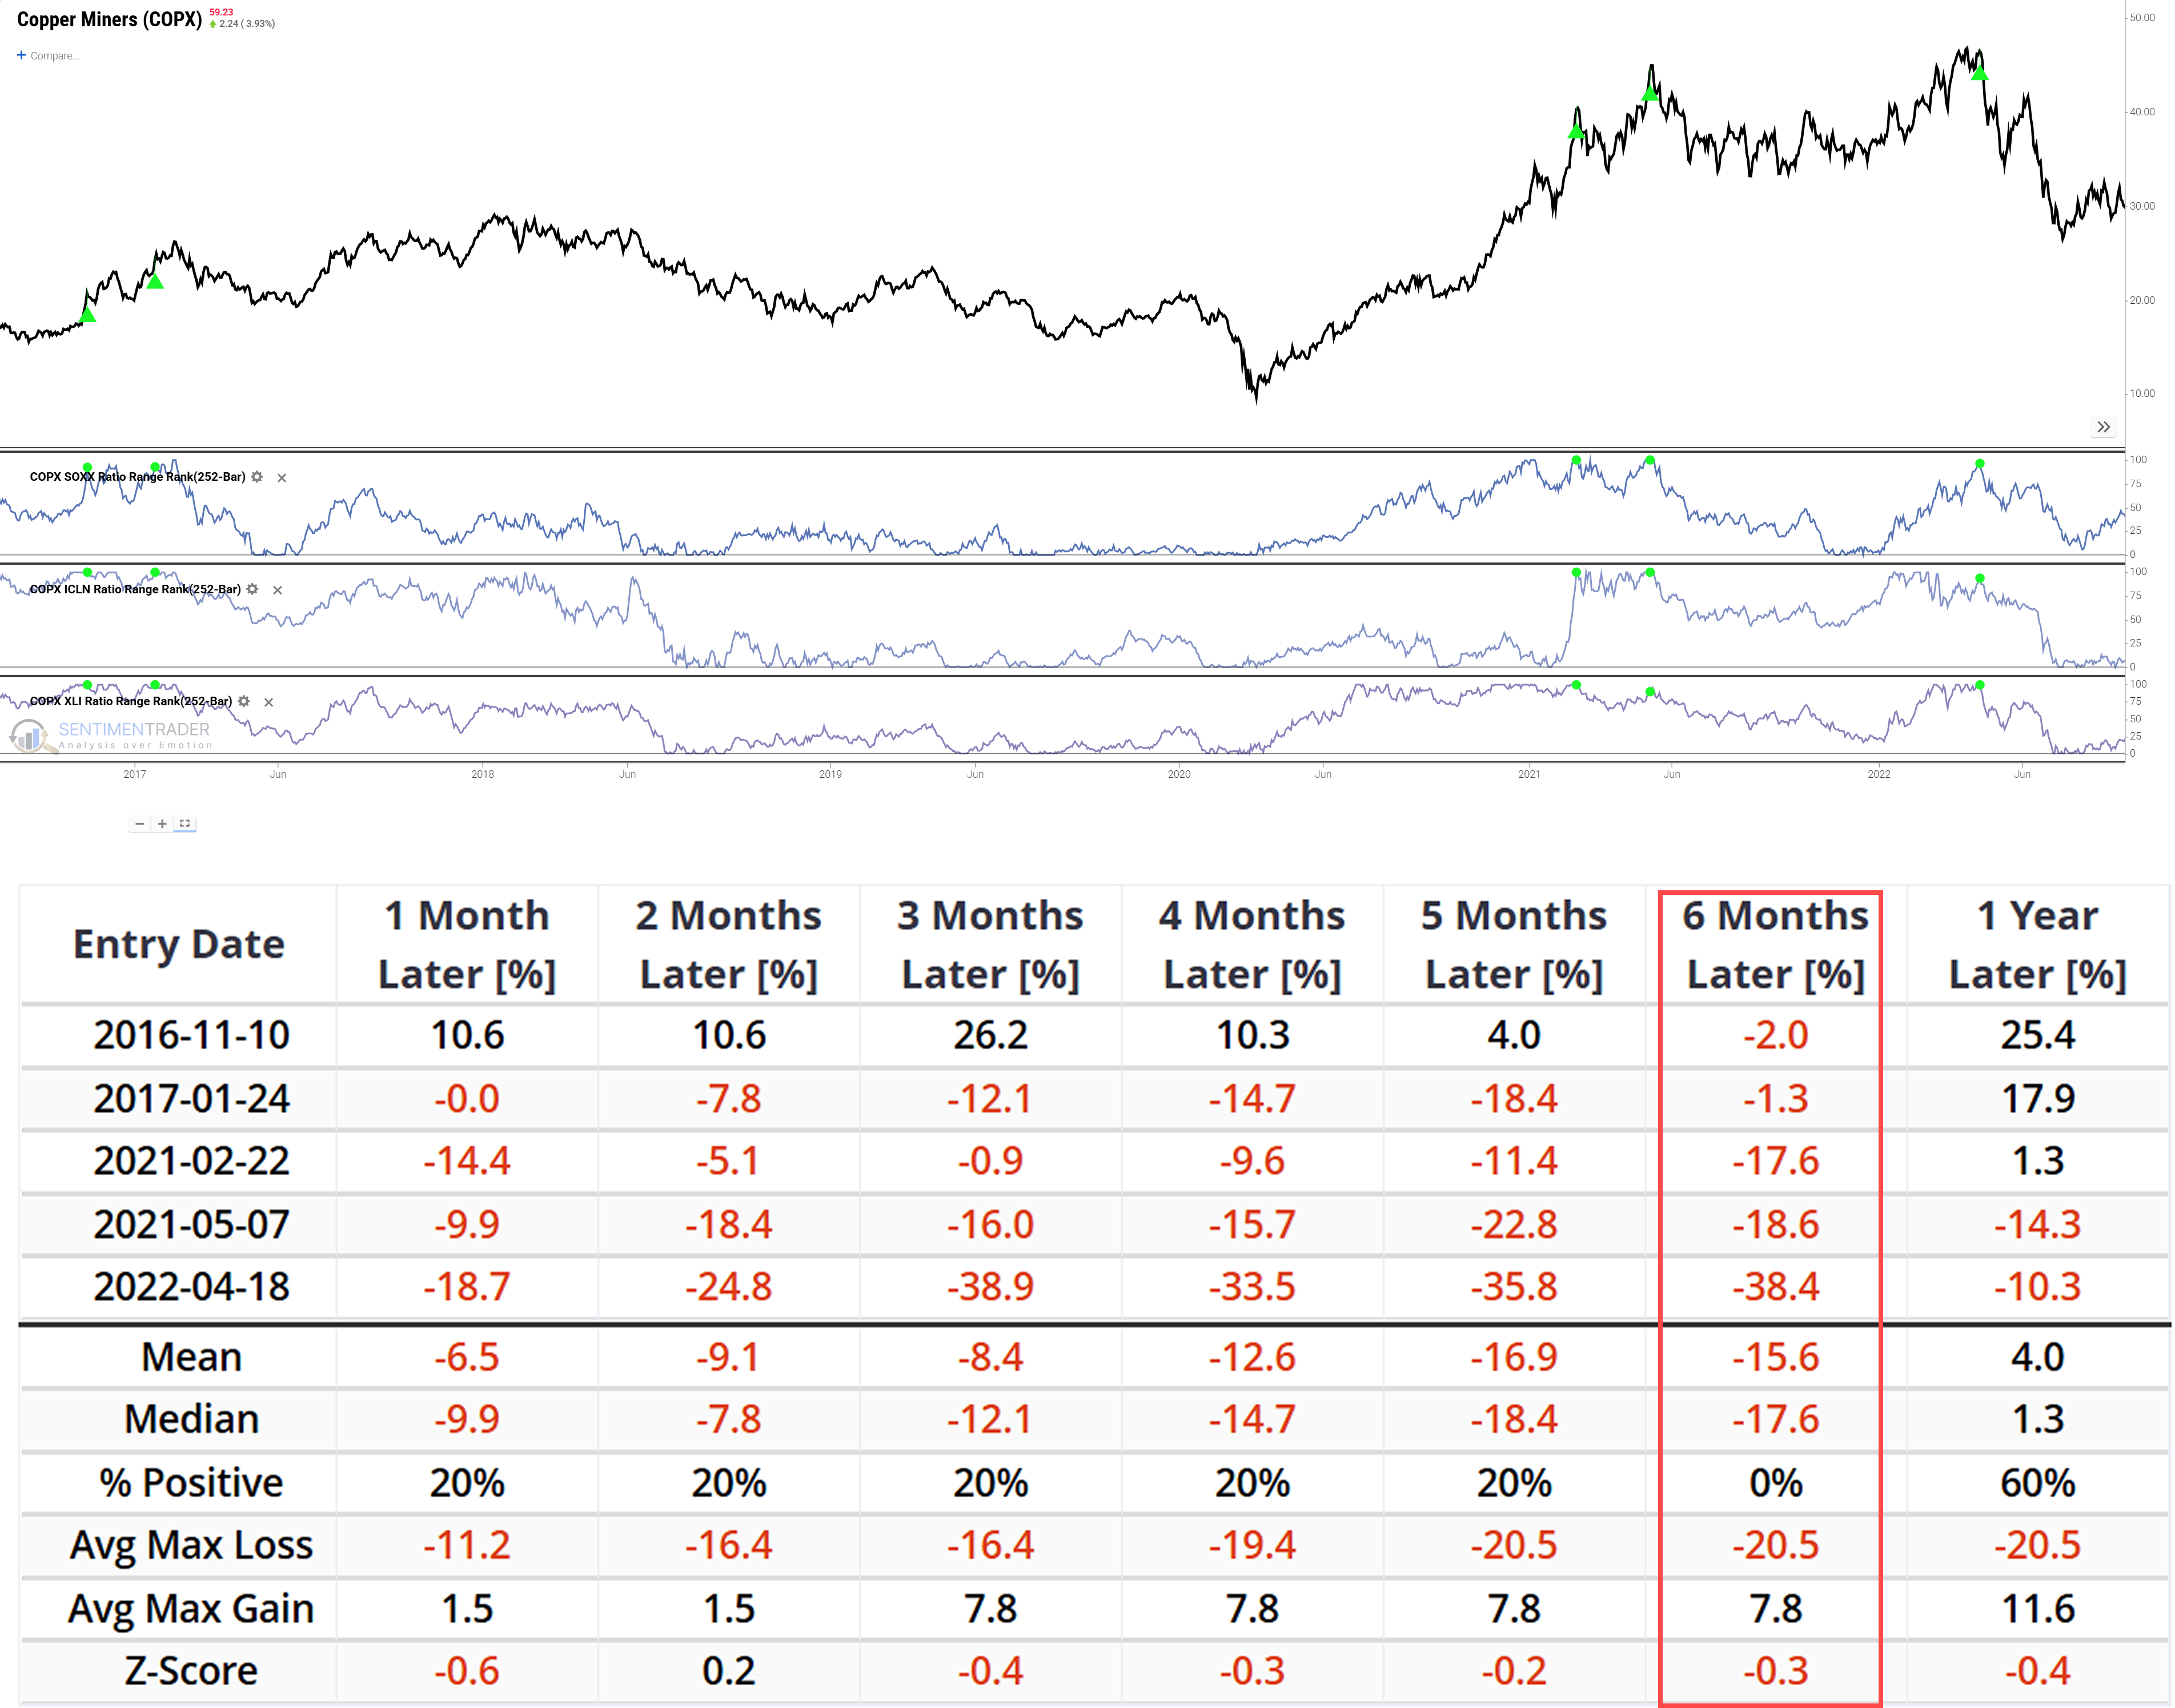
Copper-to-AI Ratio Hits Historic Extreme
The AI narrative has fueled a massive breakout in copper stocks. Copper's outperformance versus tech has hit a historic, and potentially dangerous, extreme. History shows such extremes often precede poor returns for copper stocks over the next 6 months.
The rally is defying typical summer weakness, suggesting speculative froth may be a key driver.
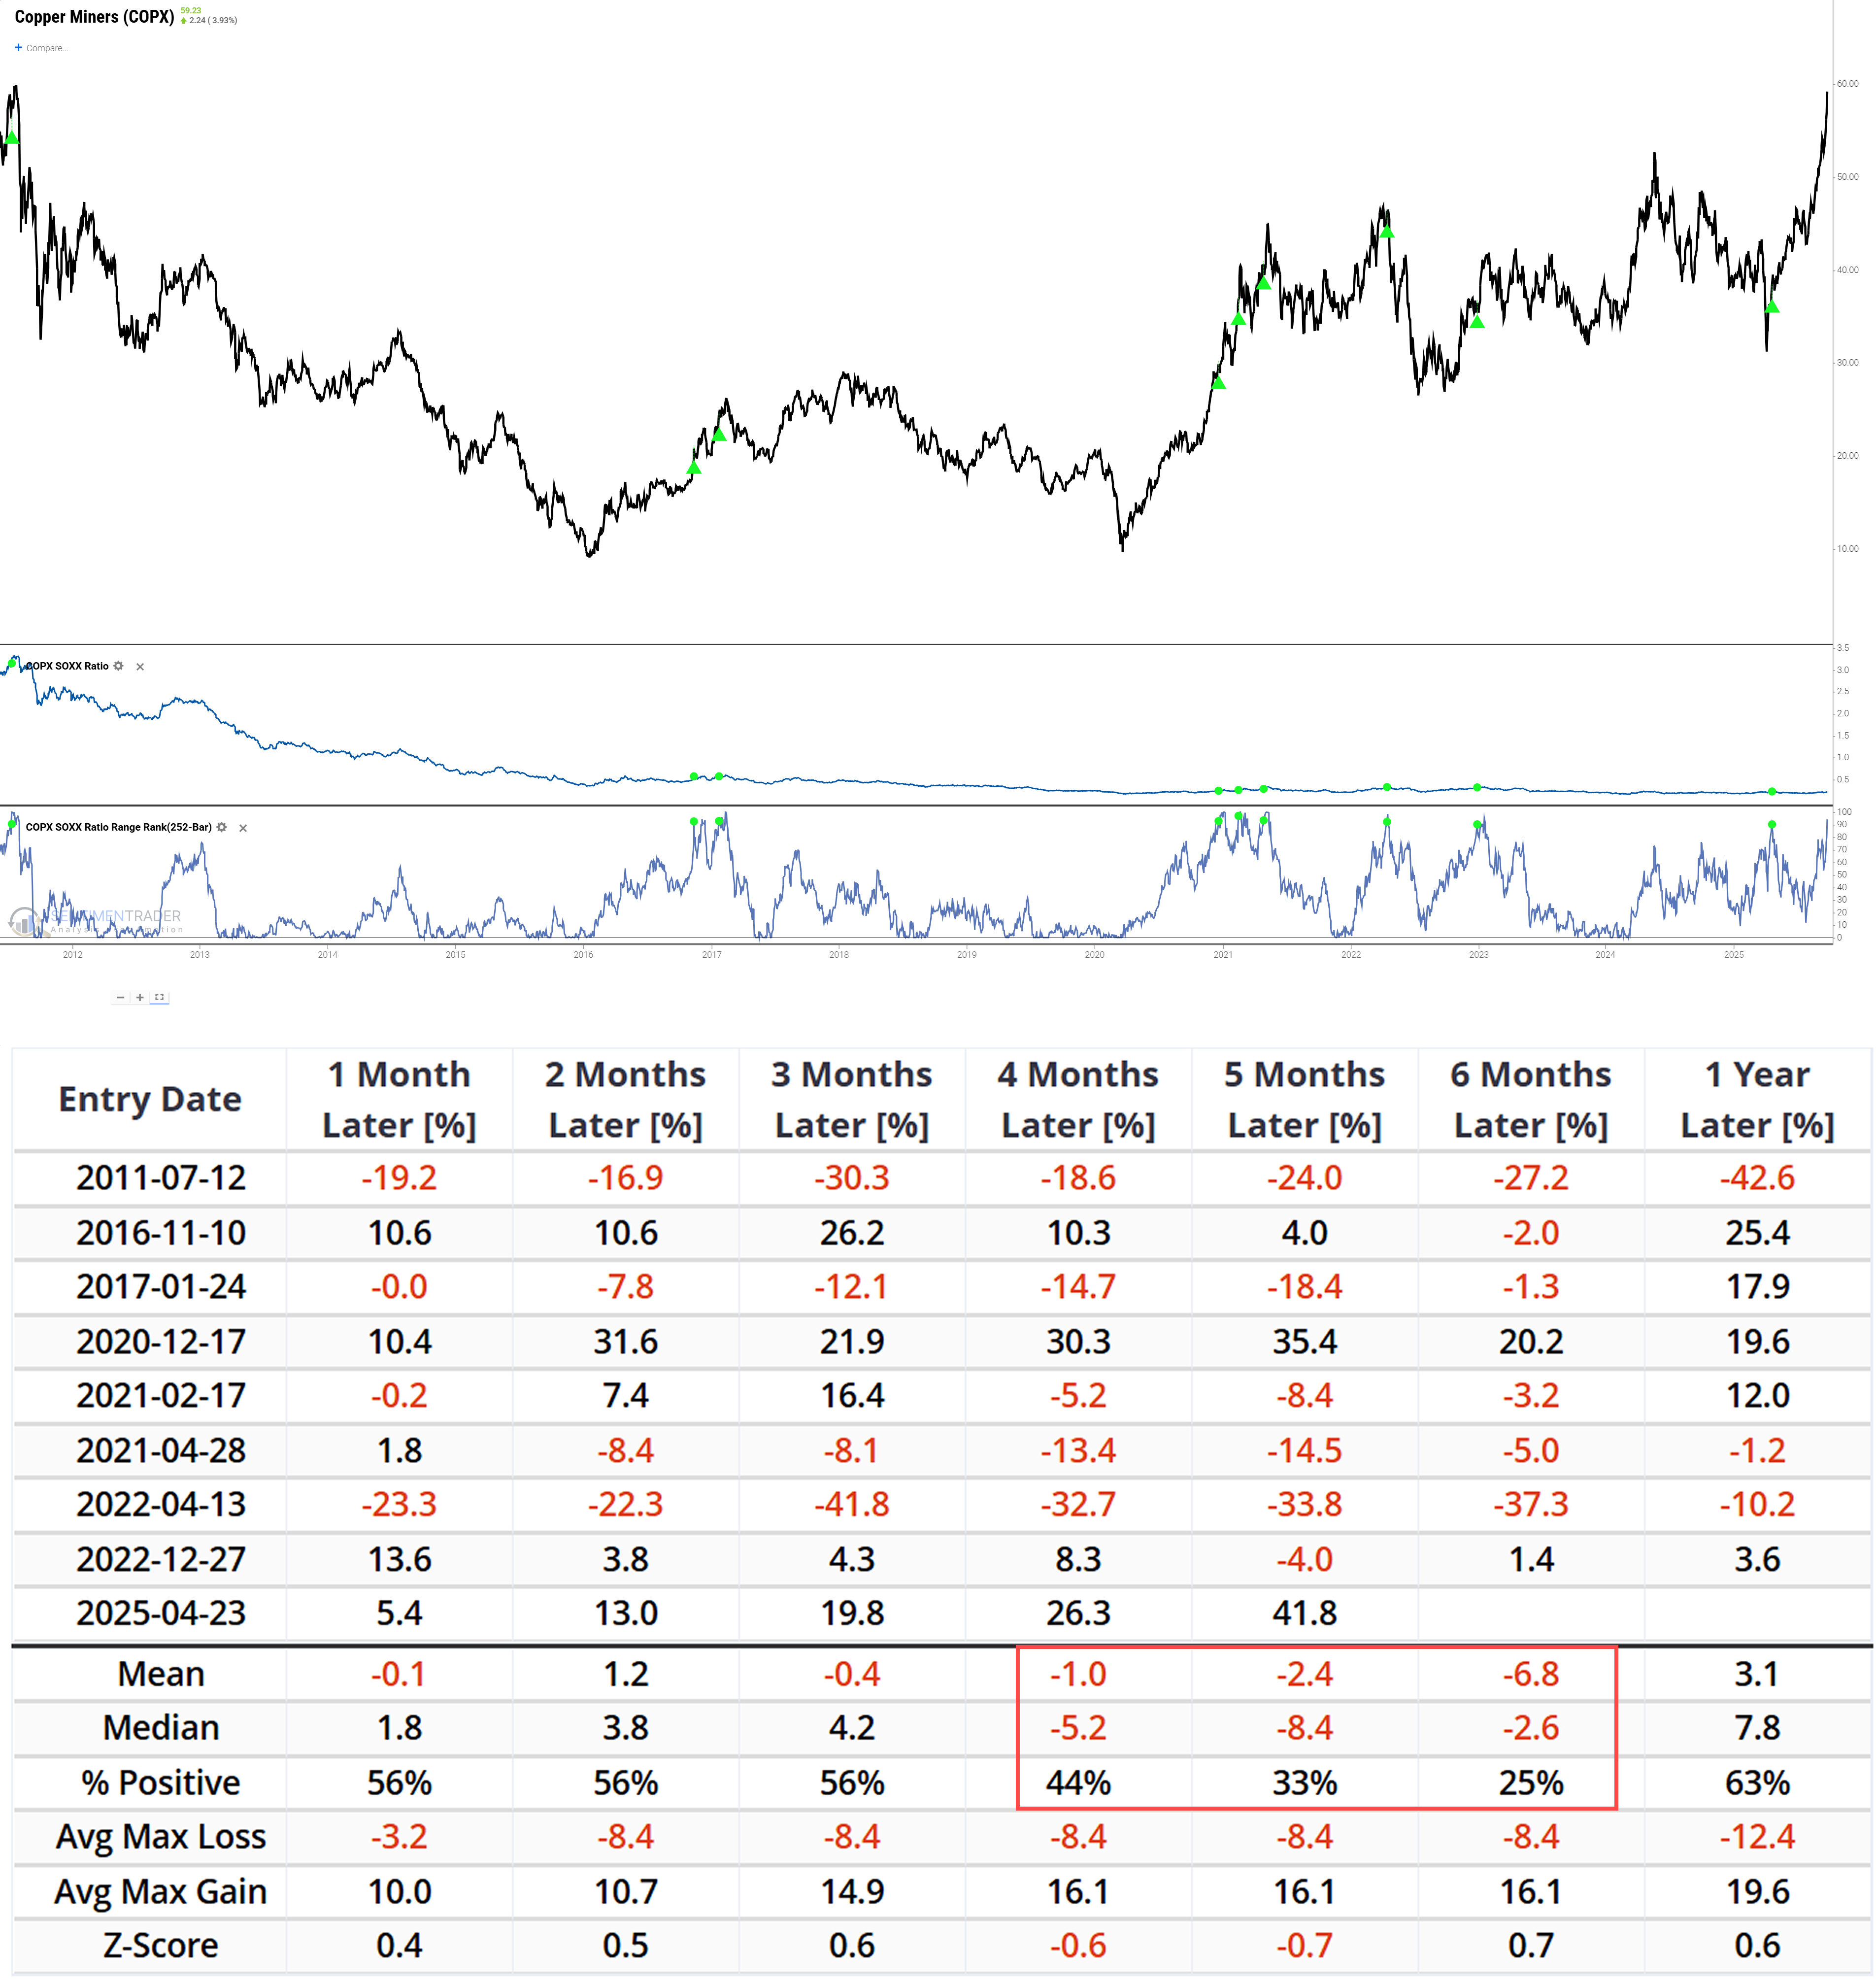
When copper's strength against these very sectors that drive its demand story becomes too extreme, history delivers a clear warning. It's less a signal of continued economic strength and more an indicator of exhaustion. In fact, after similar signals in the past, going long copper stocks has been a losing game.
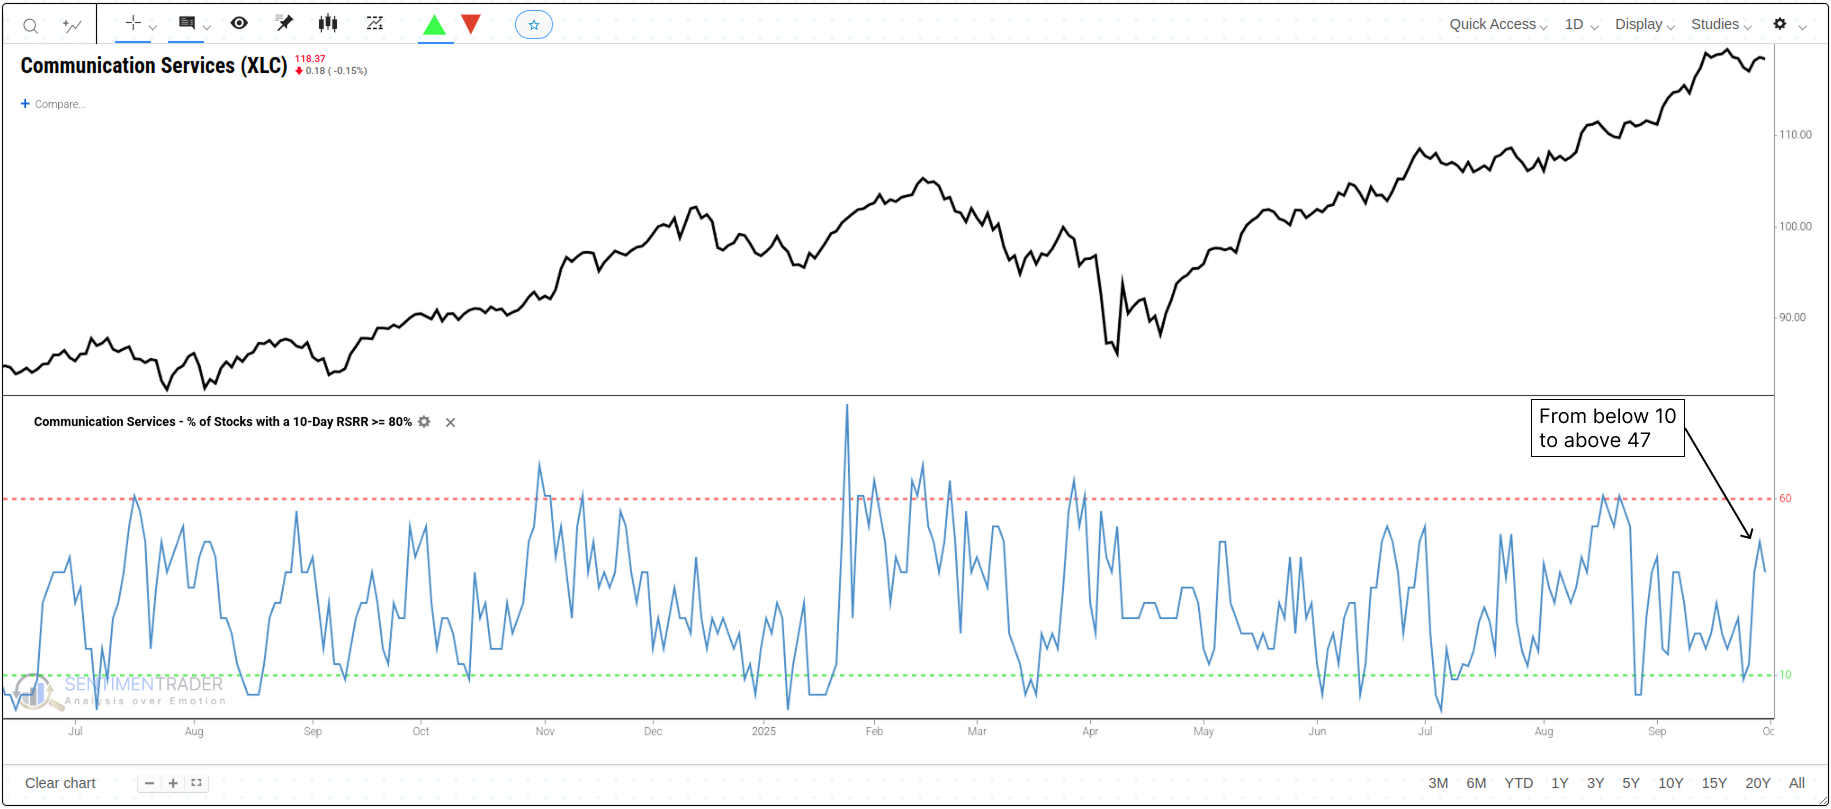
Communication Services Sector Shows Breadth Thrust
A short-term breadth thrust signal has triggered in the Communication Services (XLC) sector, indicating a rapid expansion in the number of its components showing strong relative strength. The historical precedent following this signal presents a nuanced picture and a clear trade-off: to access the significant long-term potential returns, one would have historically had to endure a high probability of both short-term weakness and notable drawdowns.
Market Sentiment Shifts to 'Returning Confidence' Phase
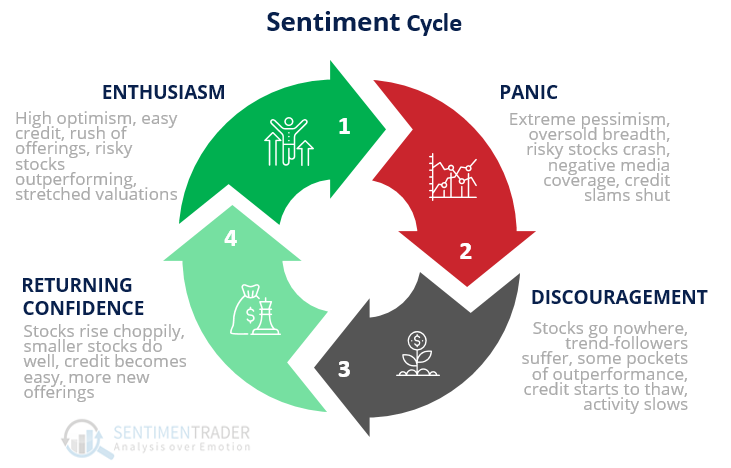
The \"Returning Confidence\" phase is now officially confirmed. A widely used framework for gauging market psychology draws from the Sentiment Cycle popularized by Justin Mamis in his 1999 book, The Nature of Risk. This cycle has four core phases: Enthusiasm, Panic, Discouragement, and Returning Confidence.
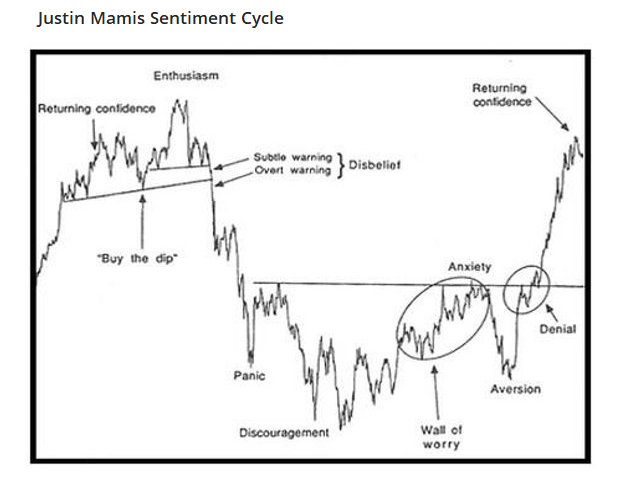
The \"Returning Confidence\" phase is defined by three key traits: choppy yet sustained stock price gains, broadening market participation (especially among small-cap stocks), and easing credit conditions. Critically, this phase often signifies the transition from a market bottom to a more durable uptrend.
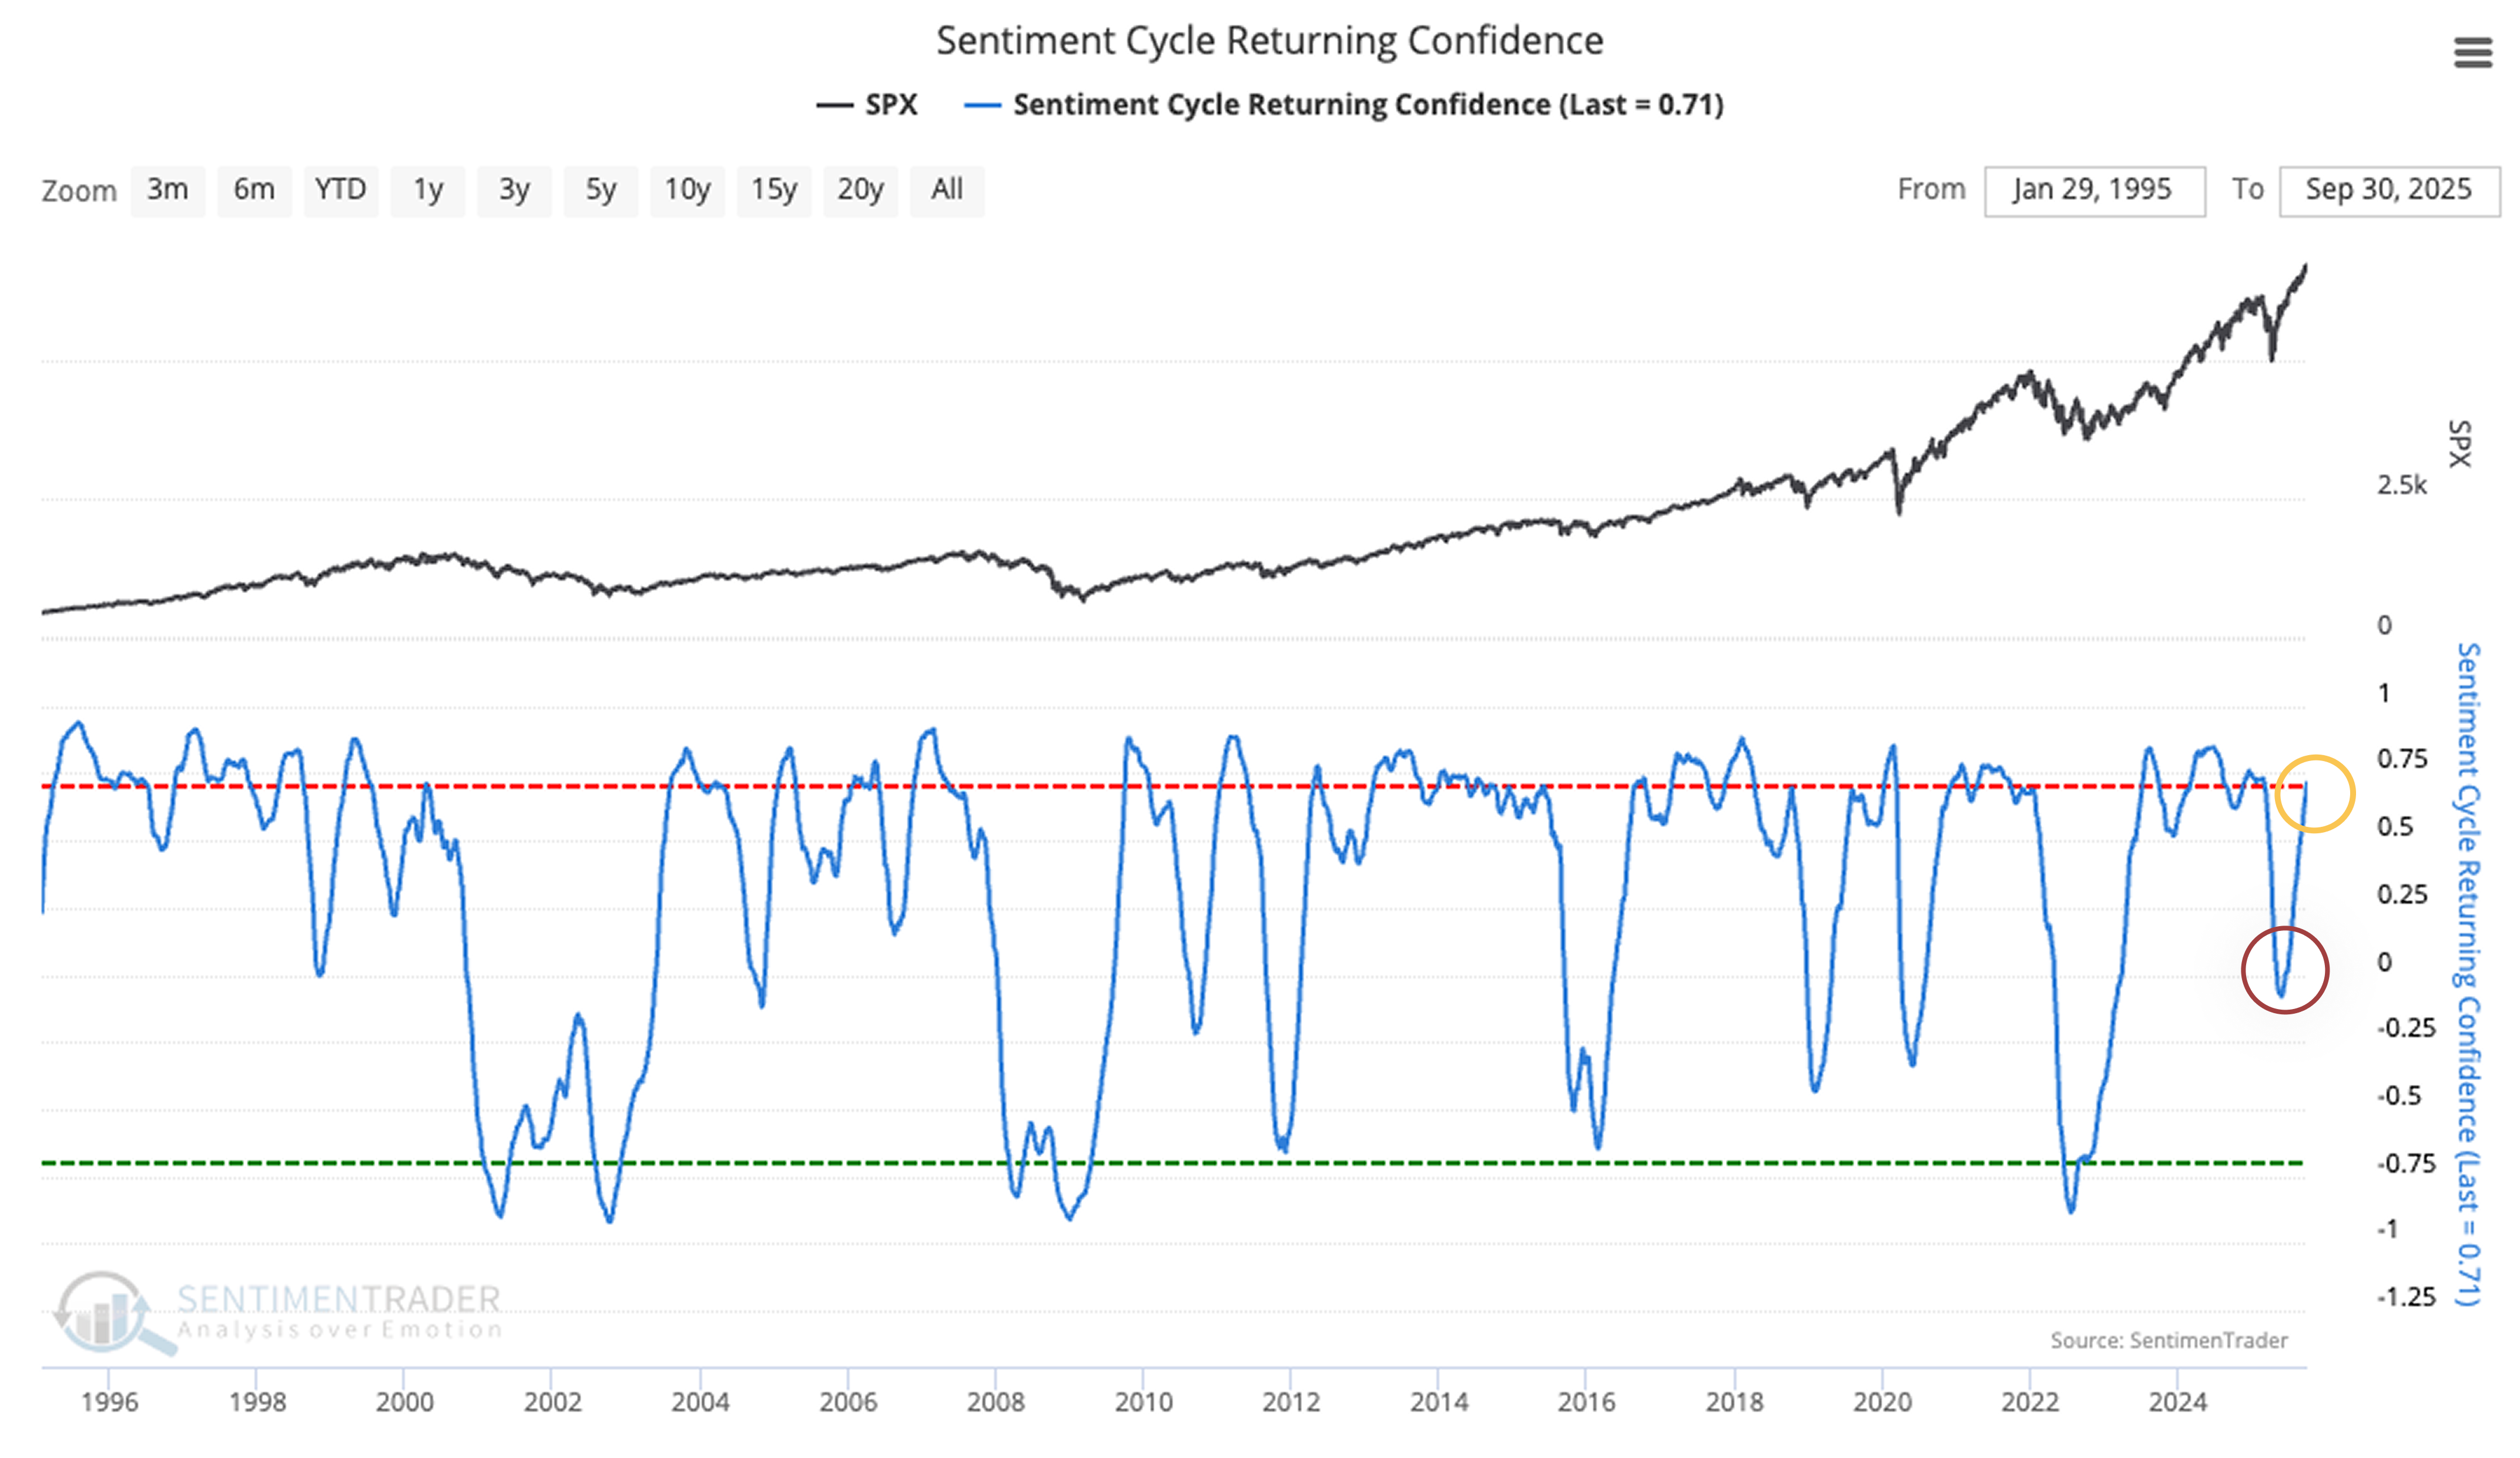
To validate when this phase is likely in effect, we tracked every instance where the correlation to \"Returning Confidence\" rose from below 0 to above the notable threshold of +0.7 within a 126-day window. Since 1933, this signal has triggered 31 times-with the most recent occurrence last week, on September 26, 2025.
About TradingEdge Weekly...
The goal of TradingEdge Weekly is to summarize some of the research published to SentimenTrader over the past week. Sometimes there is a lot to digest, and this summary highlights the highest conviction or most compelling ideas we discussed. This is NOT the published research; rather, it pulls out some of the most relevant parts. It includes links to the published research for convenience, and if you don't subscribe to those products, it will present the options for access.