
TradingEdge Weekly for Oct 24 - Tech sector divergence, Sentiment Cycle Composite, Bitcoin's four-year cycle, Short-term favorable period

Key points:
- The tech sector shows signs of bearish divergence despite retail optimism
- The Sentiment Cycle Composite provides a trend-following guide to investor sentiment
- Bitcoin appears to follow a four-year cycle with Year #4 being historically weak
- A historically strong seven-day period approaches at October's end
- Market optimism persists but carries historical warnings
House view:
- Stocks:
- Short-term: Modestly bullish. Strong earnings momentum has become the dominant market driver, with tech megacaps and energy stocks leading the rally. Major indexes moved sharply higher, fueled by upbeat quarterly results from key tech firms and sector gains from soaring oil prices. Market breadth has improved significantly, with both large-caps and small-caps participating in the upside, signaling a broad-based recovery in sentiment. This time frame covers 1 - 4 weeks.
- Intermediate-term: No view. While earnings growth is broadening across the market, valuations remain near multi-decade highs, creating a tug-of-war between fundamentals and valuation concerns. Fed easing expectations provide a floor for risk assets, yet fiscal uncertainty from the government shutdown and potential trade policy shifts introduce downside risks. Sector divergence persists: tech and energy benefit from earnings strength and geopolitical tailwinds, while defensive sectors lag amid reduced safe-haven demand. This time frame covers 1-5 months.
- Long-term: Bullish. The market's resilience amid geopolitical tensions and sustained earnings growth underpin a constructive long-term outlook. Economically sensitive sectors continue to demonstrate leadership, supported by global demand for innovation and energy security. Long-term breadth measures remain positive across global equity markets, which historically precede sustained gains. This time frame covers 6-12 months.
- Cyclical momentum favors energy and technology sectors, with energy benefiting from geopolitical supply constraints and tech supported by innovation-driven growth
- Defensive sectors may underperform in a rising rate environment but offer portfolio diversification during volatility spikes
- Very long-term (one year+) favors small-caps and value stocks, which have lagged large-cap growth stocks and offer mean reversion potential
- Bonds: Long-term cycles remain bearish. Long-dated Treasury yields have continued to rise amid ongoing fiscal concerns and inflationary pressures. Short-term yields have stabilized amid equity market strength, but institutional demand remains concentrated in short-dated securities due to lingering policy uncertainty. Historical seasonal weakness for long-dated Treasuries in late autumn persists, with no clear signals of a trend reversal from cyclical indicators. Long-term debt sustainability concerns continue to outweigh near-term safe-haven flows. Cyclical indicators confirm structural pressure on long-duration assets.
- Commodities: A divergent but generally bullish trend emerges across sectors. An effective commodity trend model remains bullish on gold, which has pulled back moderately from recent highs following a period of strong gains. This correction is widely viewed as a technical retracement after the market's earlier rally, with the core supporting factors-elevated geopolitical tensions and Fed easing expectations-remaining intact. Oil prices spiked sharply following U.S. and EU sanctions on Russian oil companies, reversing earlier supply glut concerns. While near-term momentum is strong, speculators' extreme positioning historically precedes volatile swings. The energy sector rally has spilled over to related equities, with major energy firms benefiting from improved market conditions and upbeat earnings outlooks.
- Crypto: We follow several simple systems for bitcoin, which we consider the equivalent of the S&P 500 for crypto. Due to bitcoin's explosive growth over long periods, it's dangerous to equate neutral conditions with being bearish for some of these. However, if a system is "out," we consider it bearish for this summary.
- Triple 40: Bearish
- RSI Momentum: Bullish
- Trend and Relative Trend: Bearish
- PMI: Bearish
- M2 ROC: Bullish
Where we're at
Most investors have the most riding on equities. We feel that the most significant determinants of success for investors are whether to adjust their allocation to that asset class based on factors that have historically had a good record of preceding above- or below-random returns in the months ahead.
Those factors include the probability of a looming recession, sentiment, price action, volatility, breadth, and the bond market. The chart below summarizes the main indicators and composite models we watch for those factors, and they're mostly in bullish regimes. Valuations are not part of these factors since the relationship has been too inconsistent on time frames under one year.
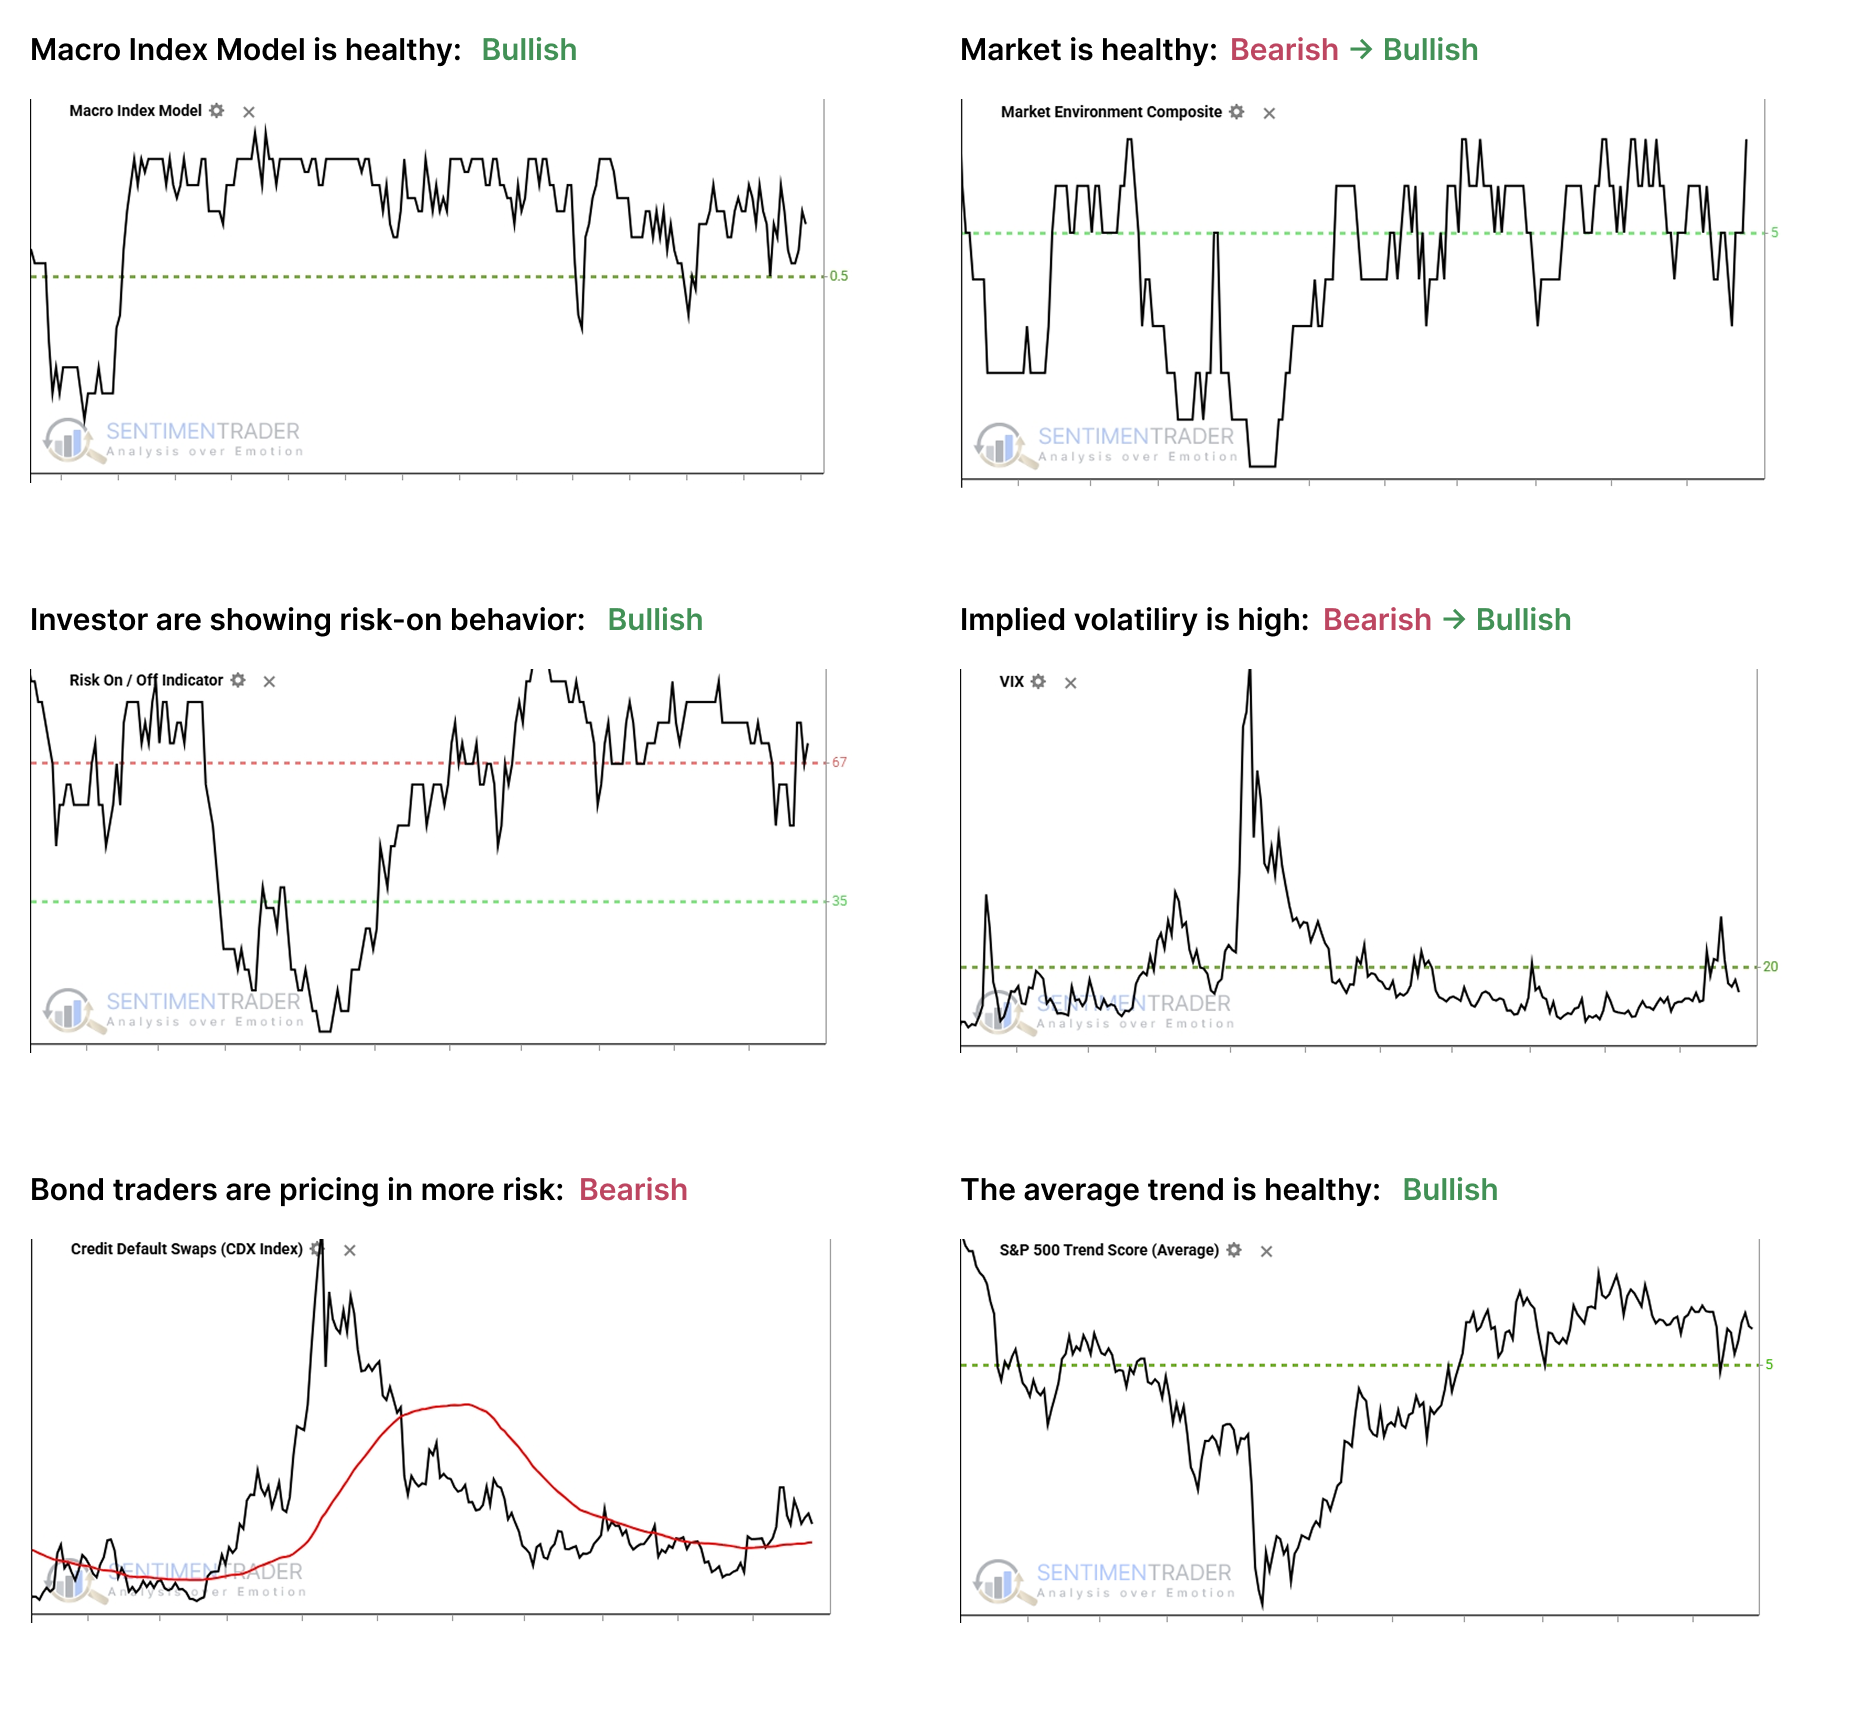
- The Macro Index Model is above the 50% threshold, which has been a vital level as outlined here.
- The Market Environment has been skittish since April, but is currently healthy. Future returns, especially for higher-beta indices, has been markedly better, with less risk, when the environment is healthy as outlined here.
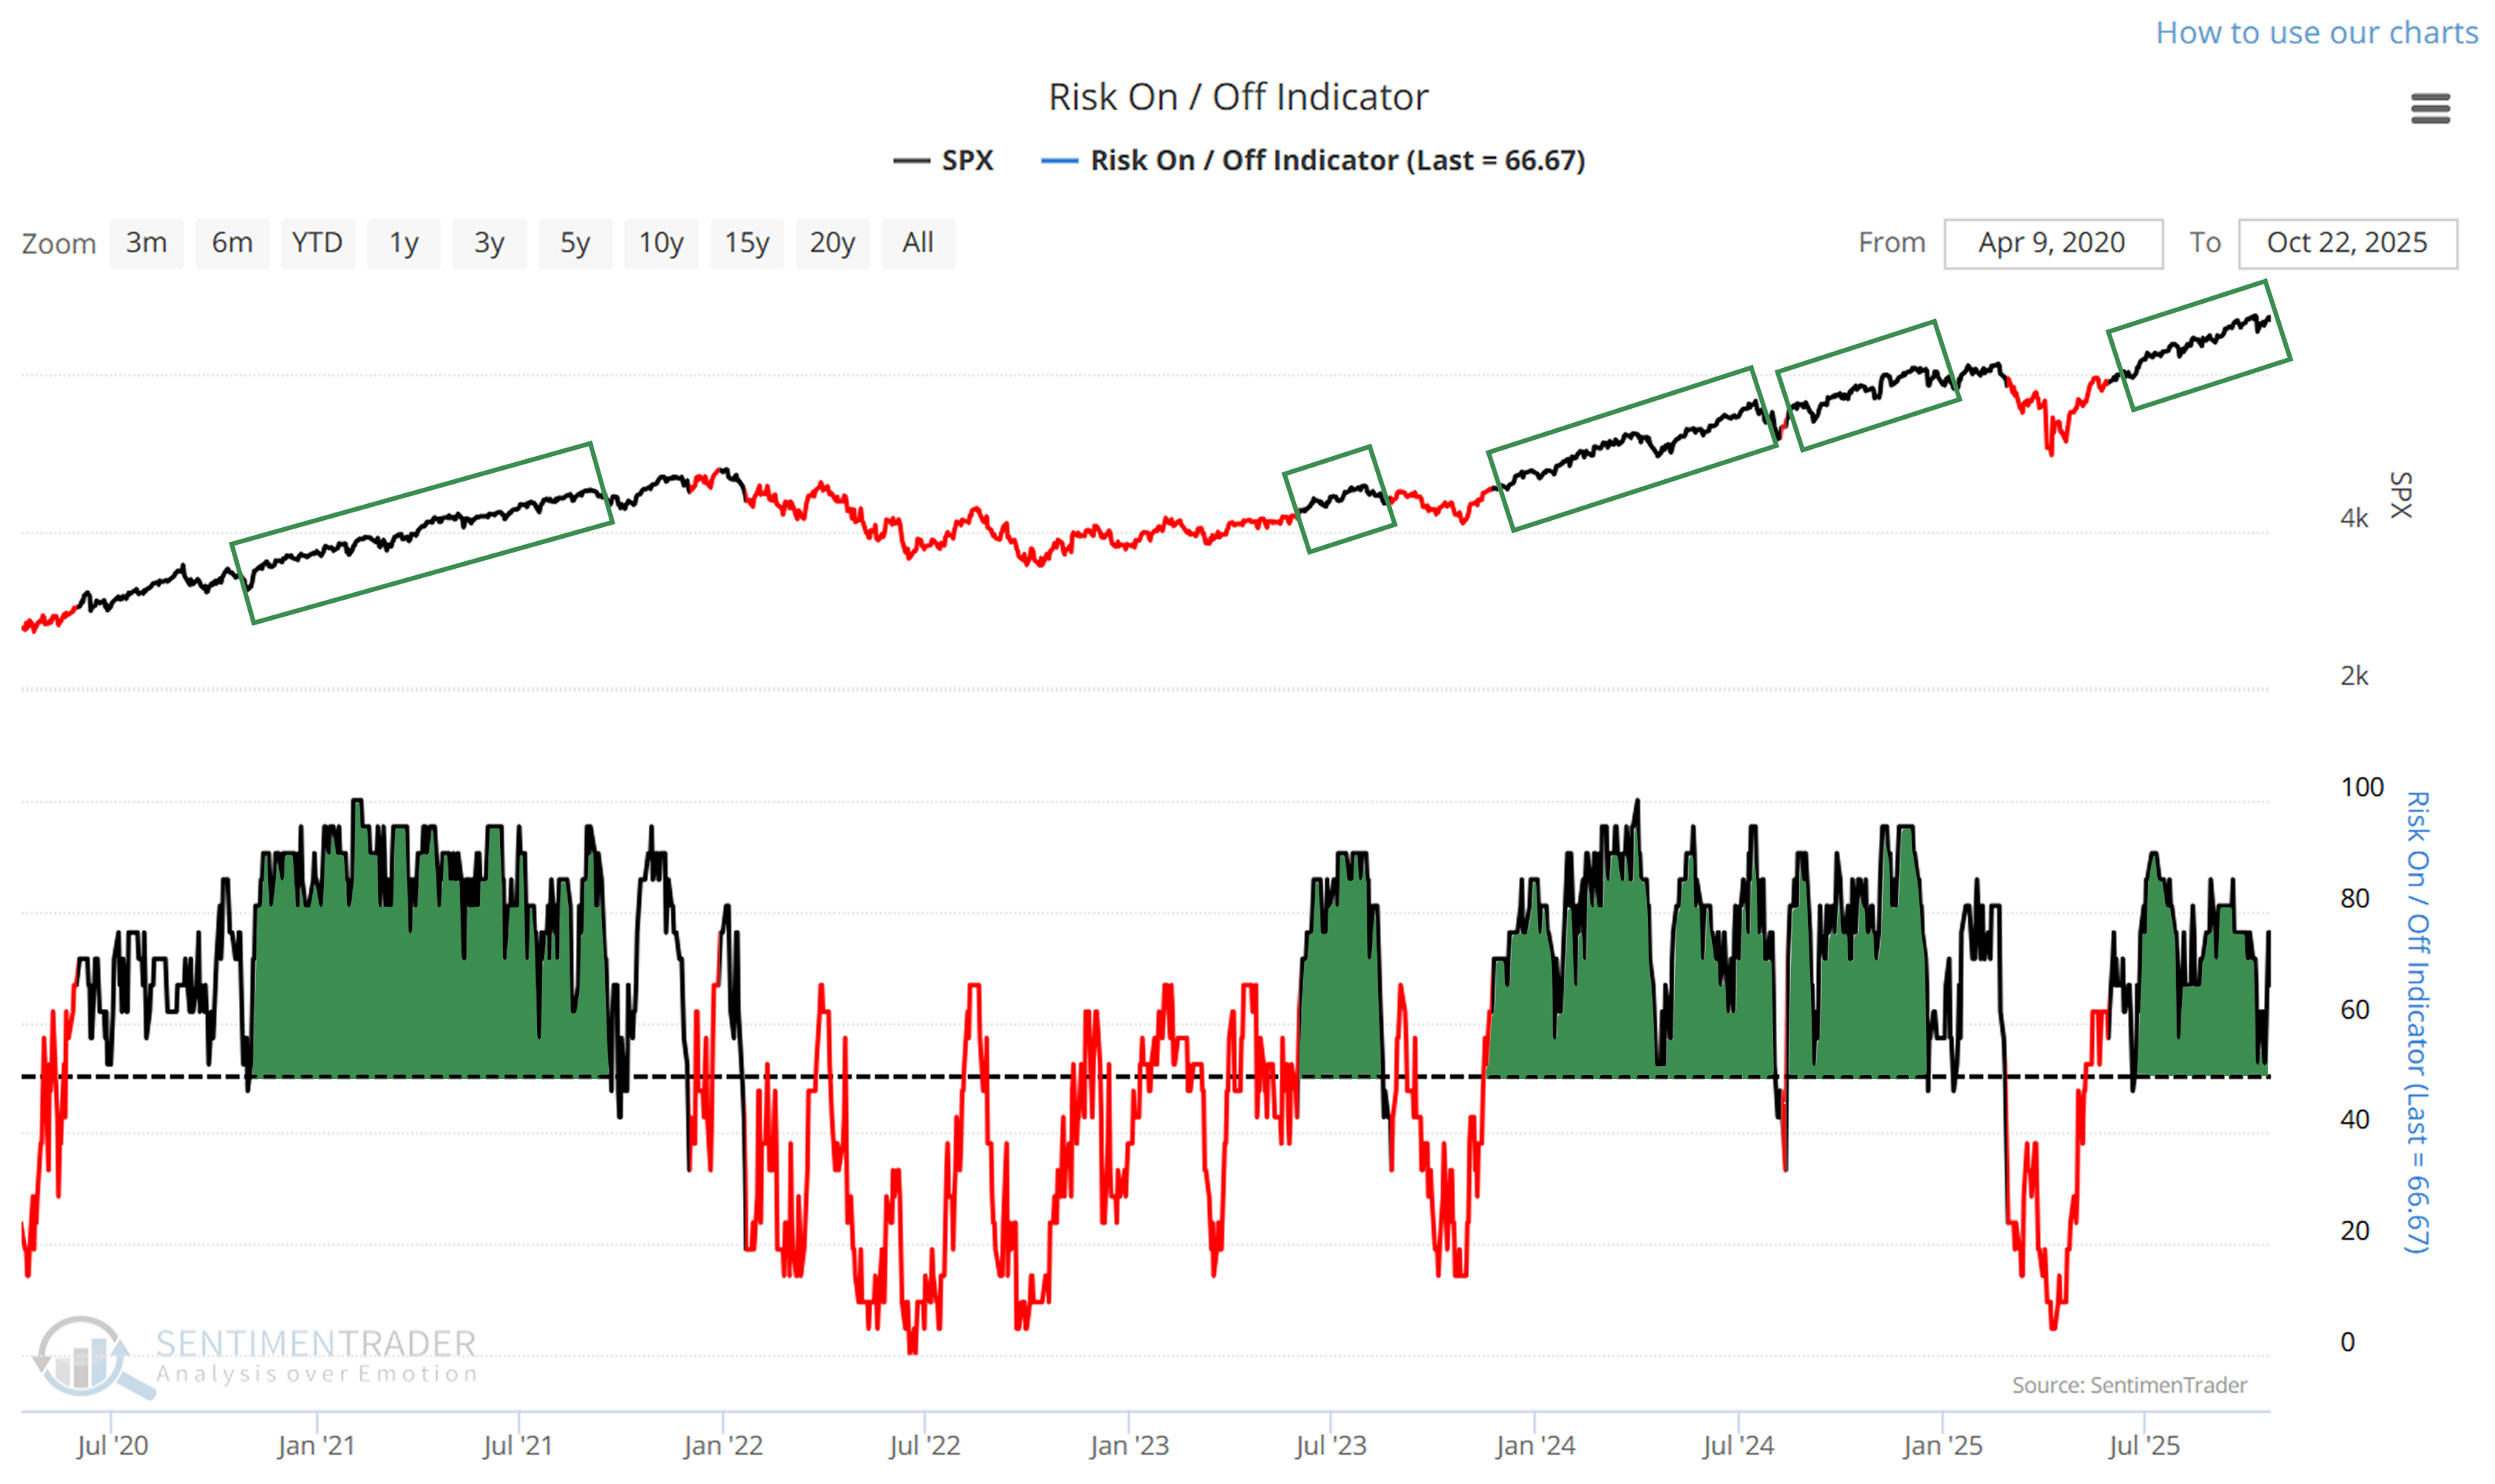
- The Risk On / Off Indicator shows that investors are still in risk-on mode. This has been a good sign for future returns as outlined here.
- Implied volatility remains below 20, showing a calm environment. The S&P 500 has perfomed well when this is the case as outlined here.
- Credit default swap spreads are above their 50-day moving average, which is modestly concerning as outlined here.
- A composite of trend measures in SPY and the average S&P 500 stock remain above 5, which show healthy trend conditions.
Since April, the most compelling studies have had a strongly bullish bias on longer time frames. You can follow these through the Active Studies page. From time to time, when the analysts' studies provide an overwhelming message, it will override the charts above, but there has been no consensus in the studies to suggest overriding the bullish environment.
Other major markets have been mostly rangebound for four months, and there is little among what we follow to suggest a compelling edge either way.
Tech Sector Divergence: Smart Money vs Retail Optimism
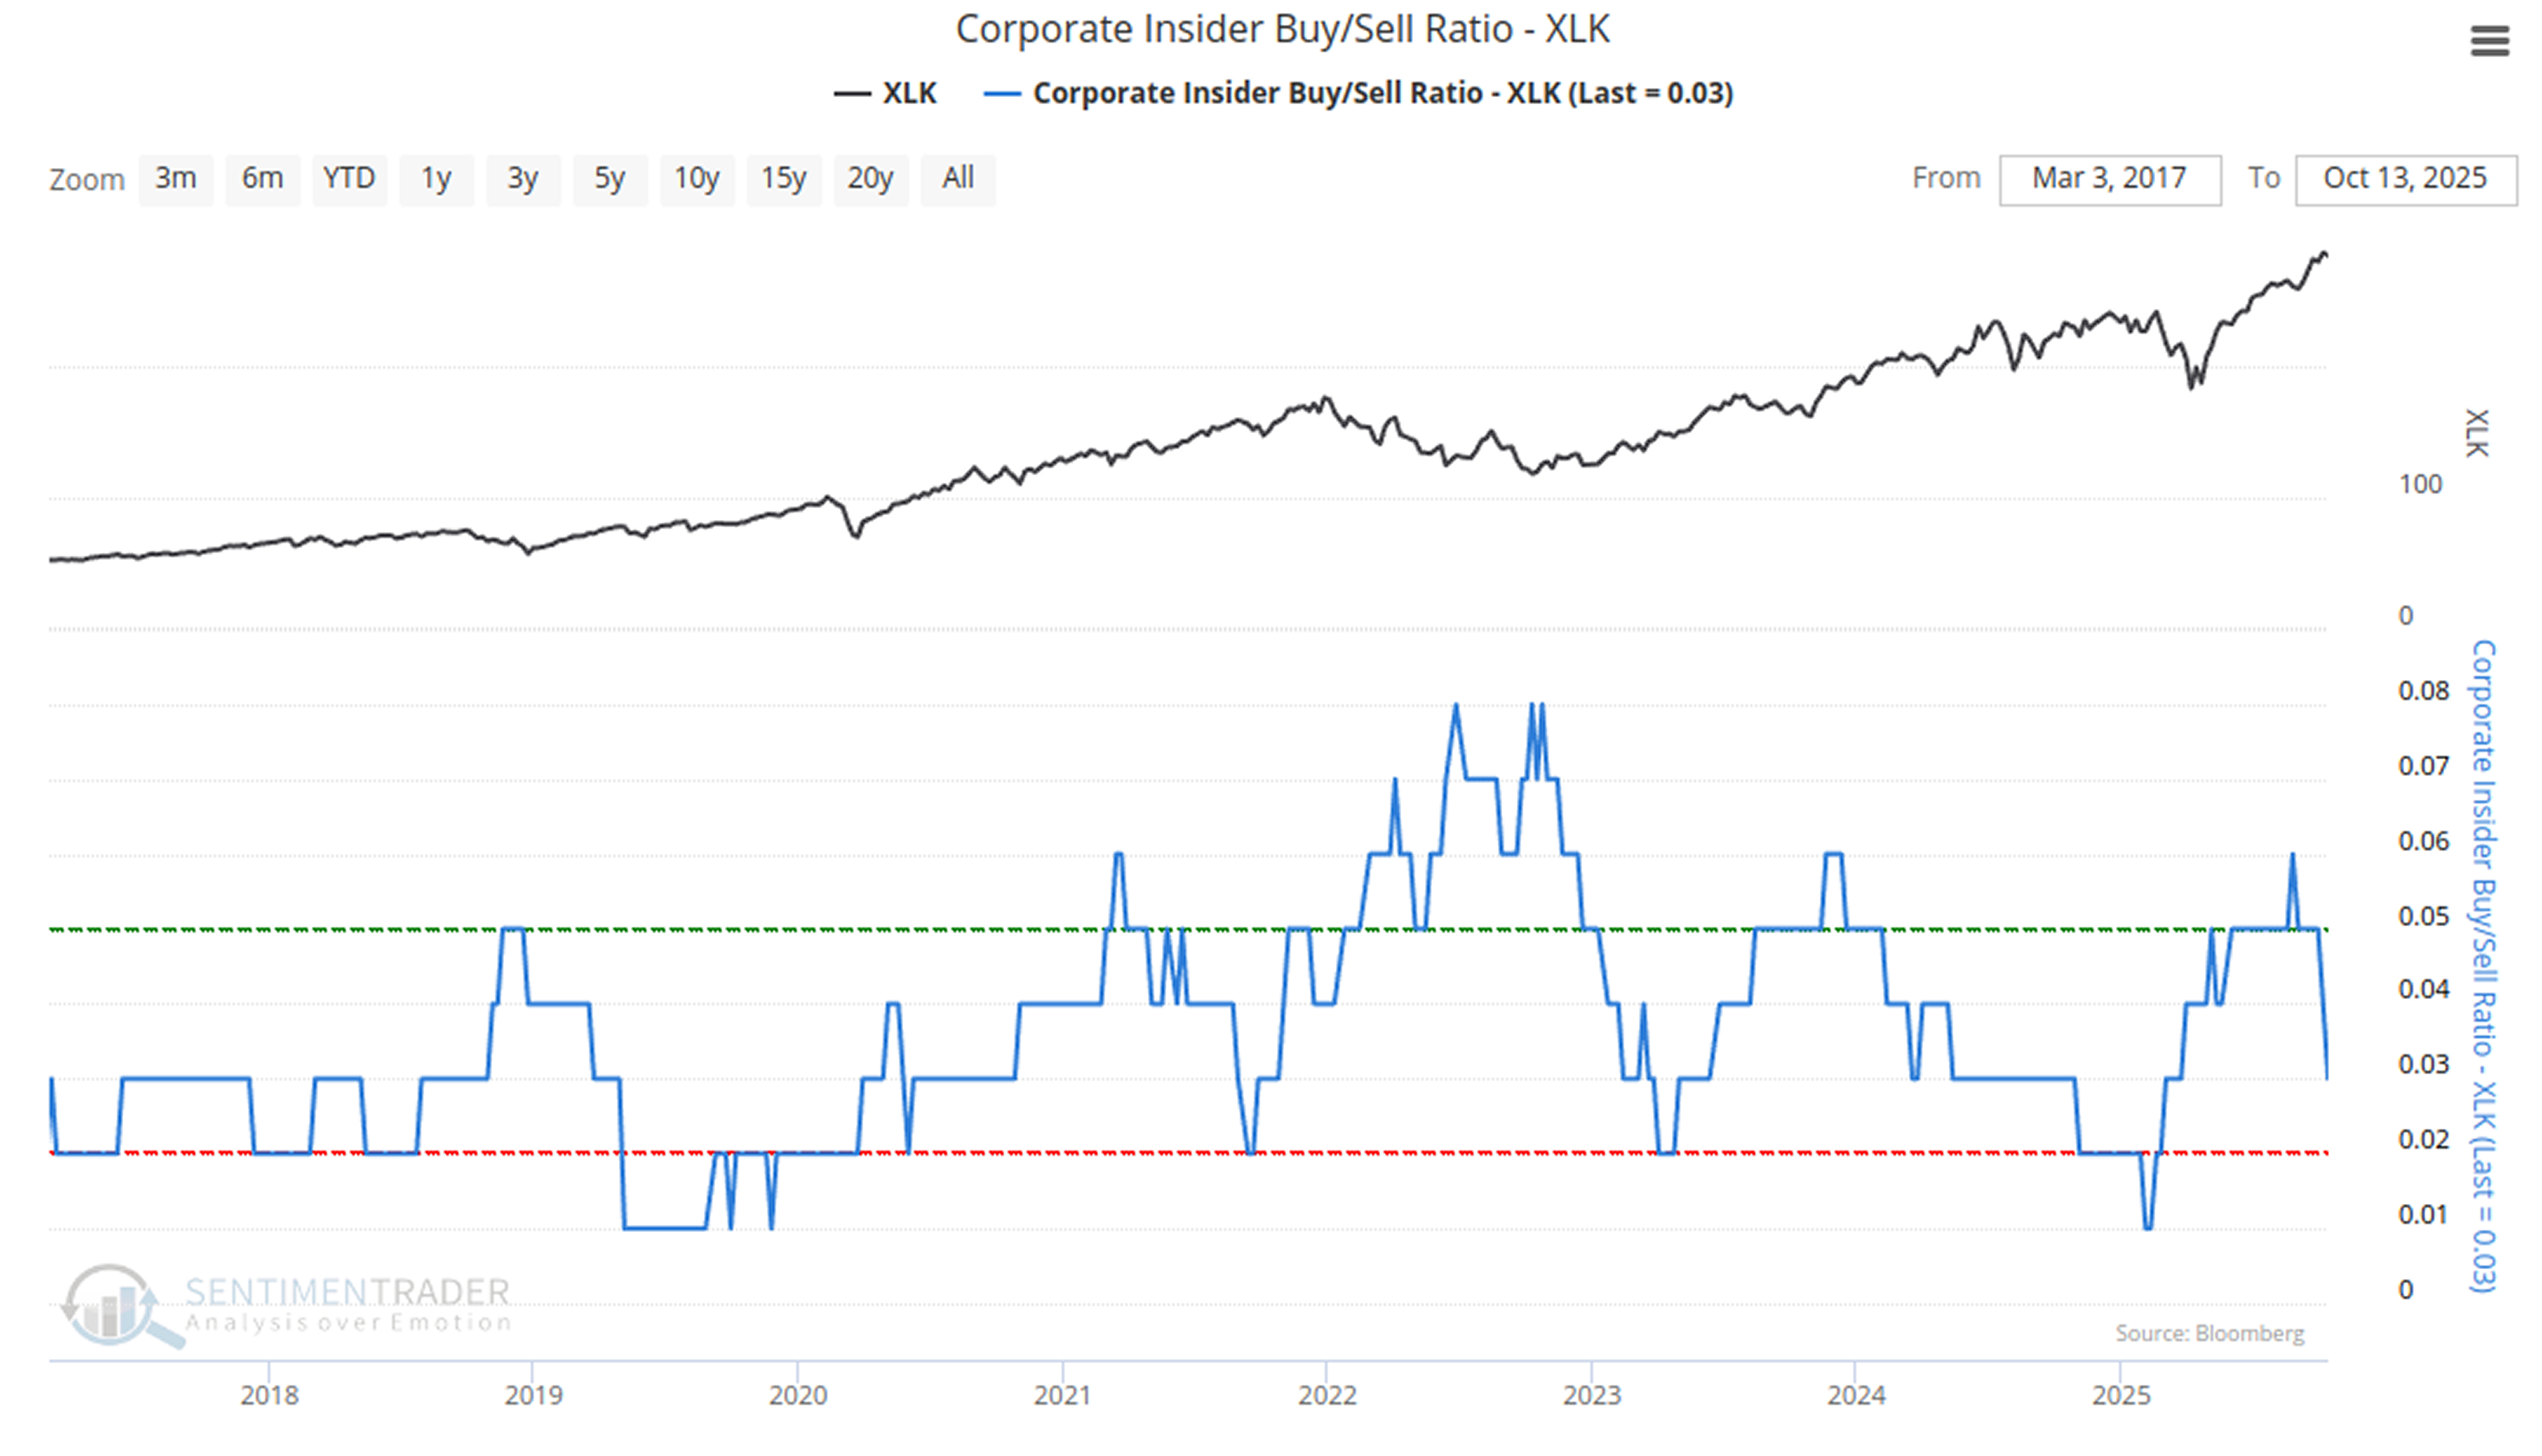
The tech sector (XLK) outperformed earlier this year but now shows signs of internal deterioration. While retail investors remain bullish (shown by Rydex Technology Assets staying elevated), multiple bearish signals have emerged:
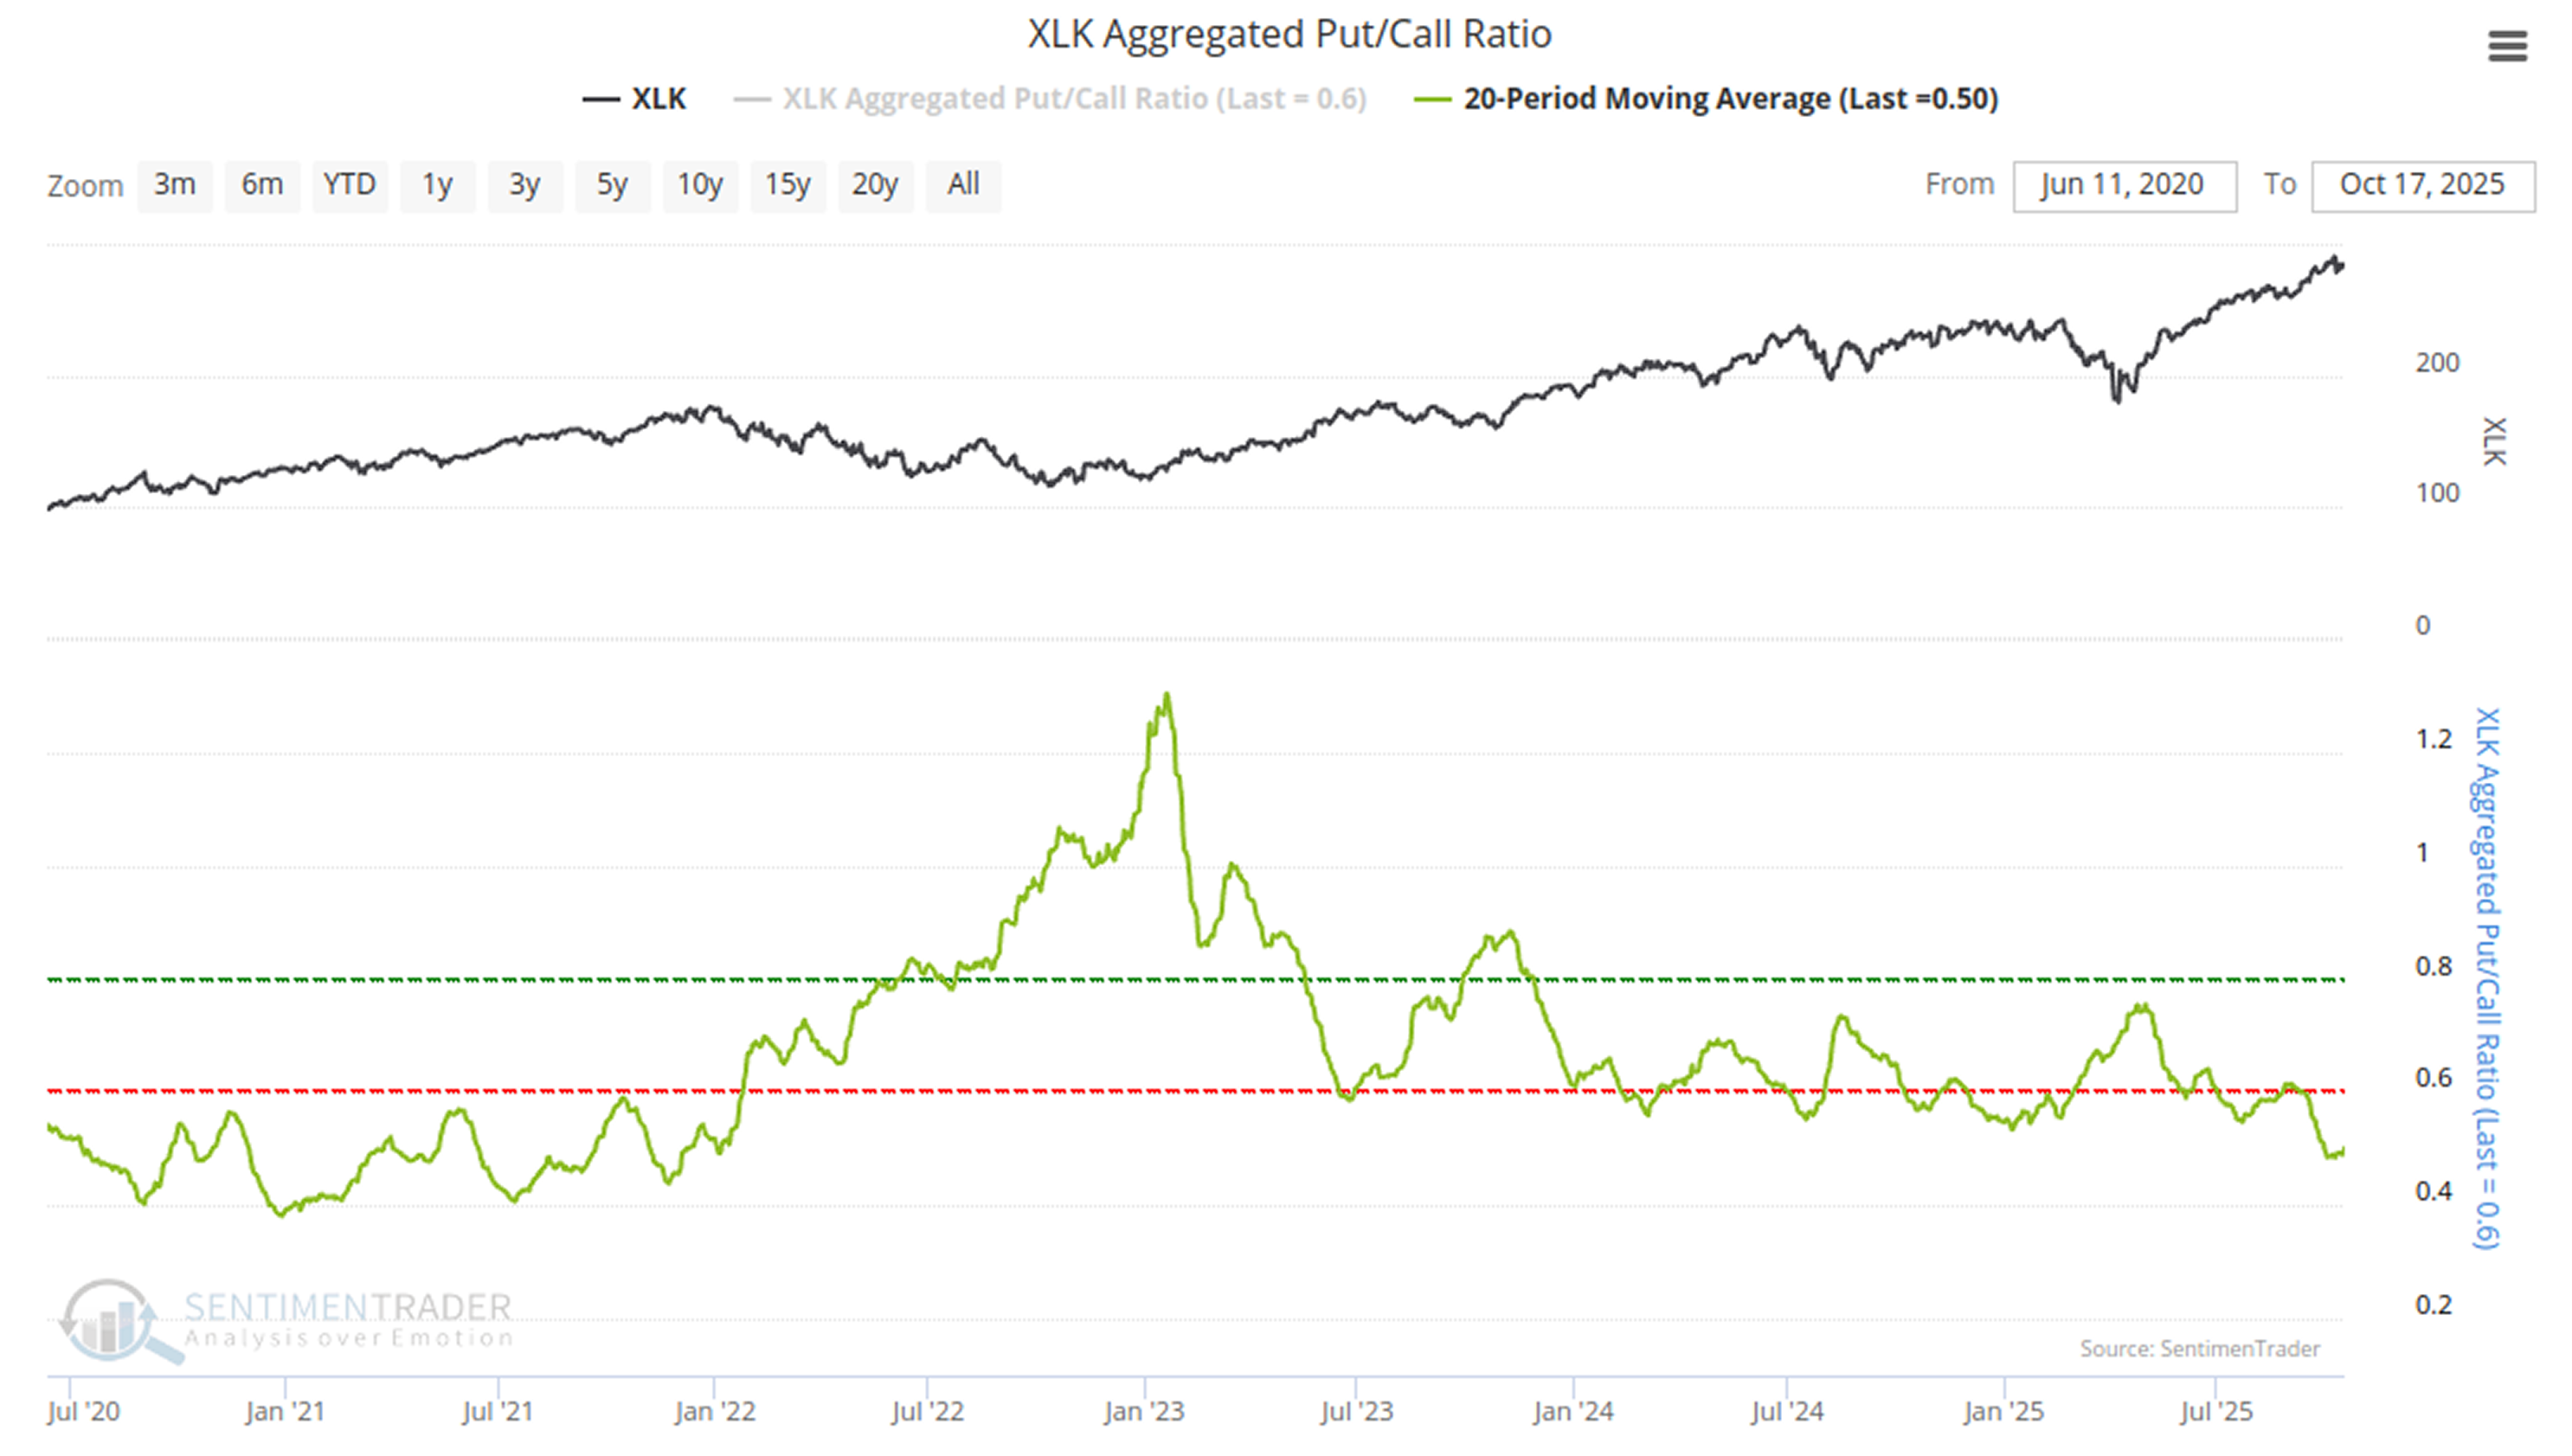
The sector's Put/Call Ratio-smoothed has lingered at a one-year low, signaling extreme complacency. Fund flows haven't confirmed the price rally, and most notably, company insiders are accelerating share sales:
Sentiment Cycle Composite: Tracking Investor Emotions
The Sentiment Cycle Composite combines four phases of market sentiment: Panic, Discouragement, Enthusiasm, and Returning Confidence. Currently, it suggests favorable conditions for stocks:
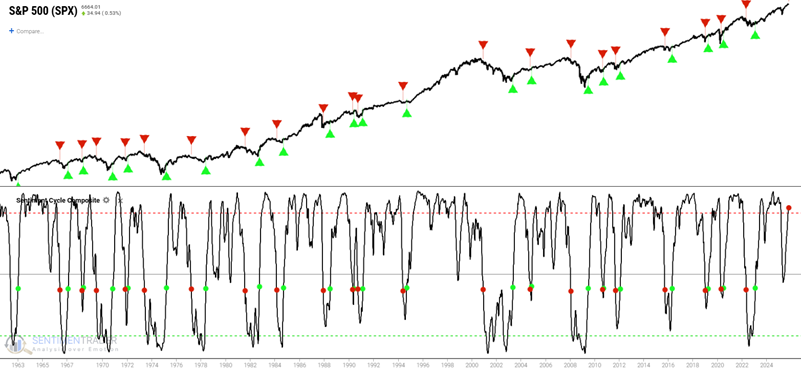
The indicator uses a -0.6 cutoff: readings above are favorable, below unfavorable. Historical backtests show strong performance when following this indicator:
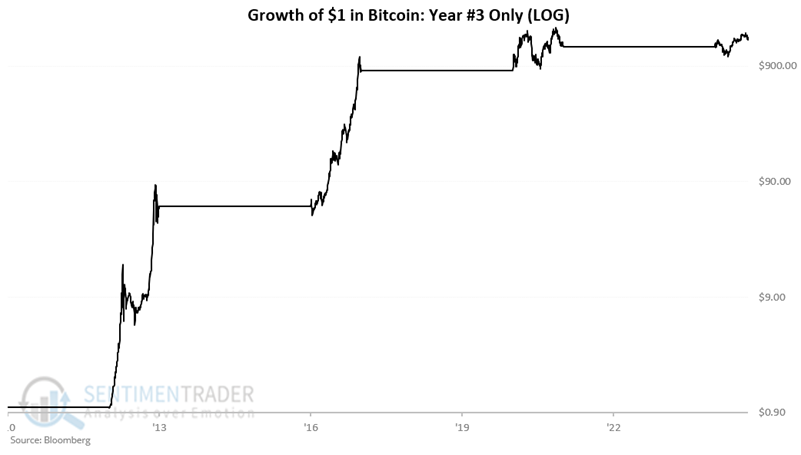
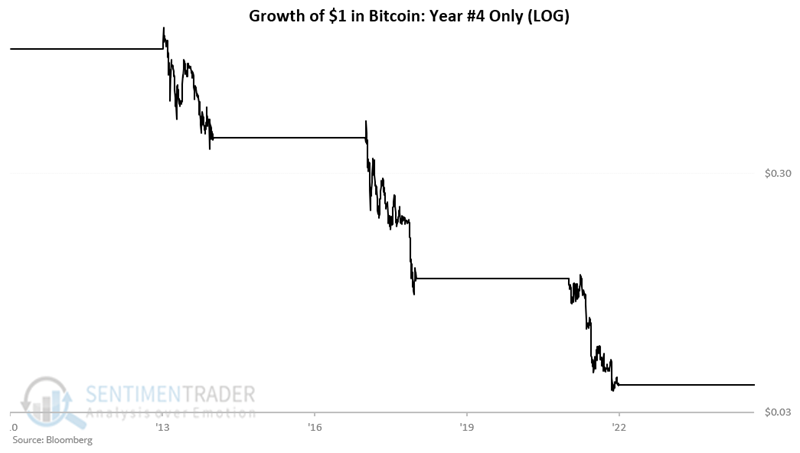
Bitcoin's Potential Four-Year Cycle
While sample size is small, Bitcoin shows a remarkable four-year pattern:
Year #3 (2013, 2017, 2021, 2025) has been extraordinarily strong:
While Year #4 (2014, 2018, 2022) has been disastrous:
Approaching Short-Term Favorable Period
The last four trading days of October and first three of November have historically shown strength:
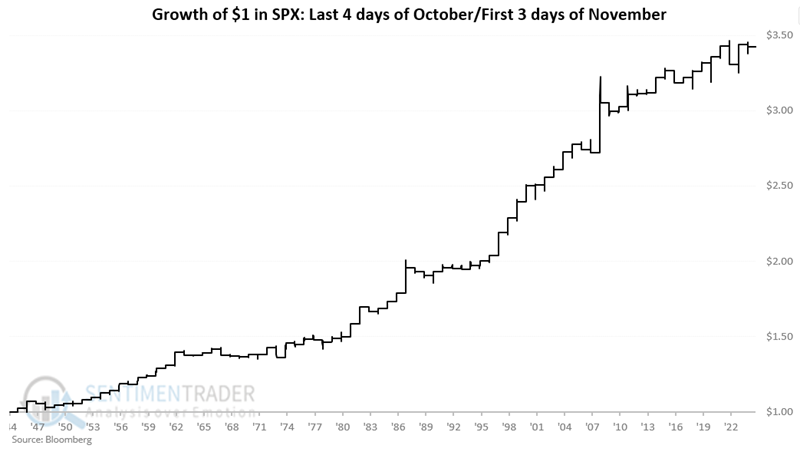
The period boasts a 70% win rate with average return of 1.60%, compared to 0.24% for all seven-day periods.
Market Optimism Reaching Extreme Persistence
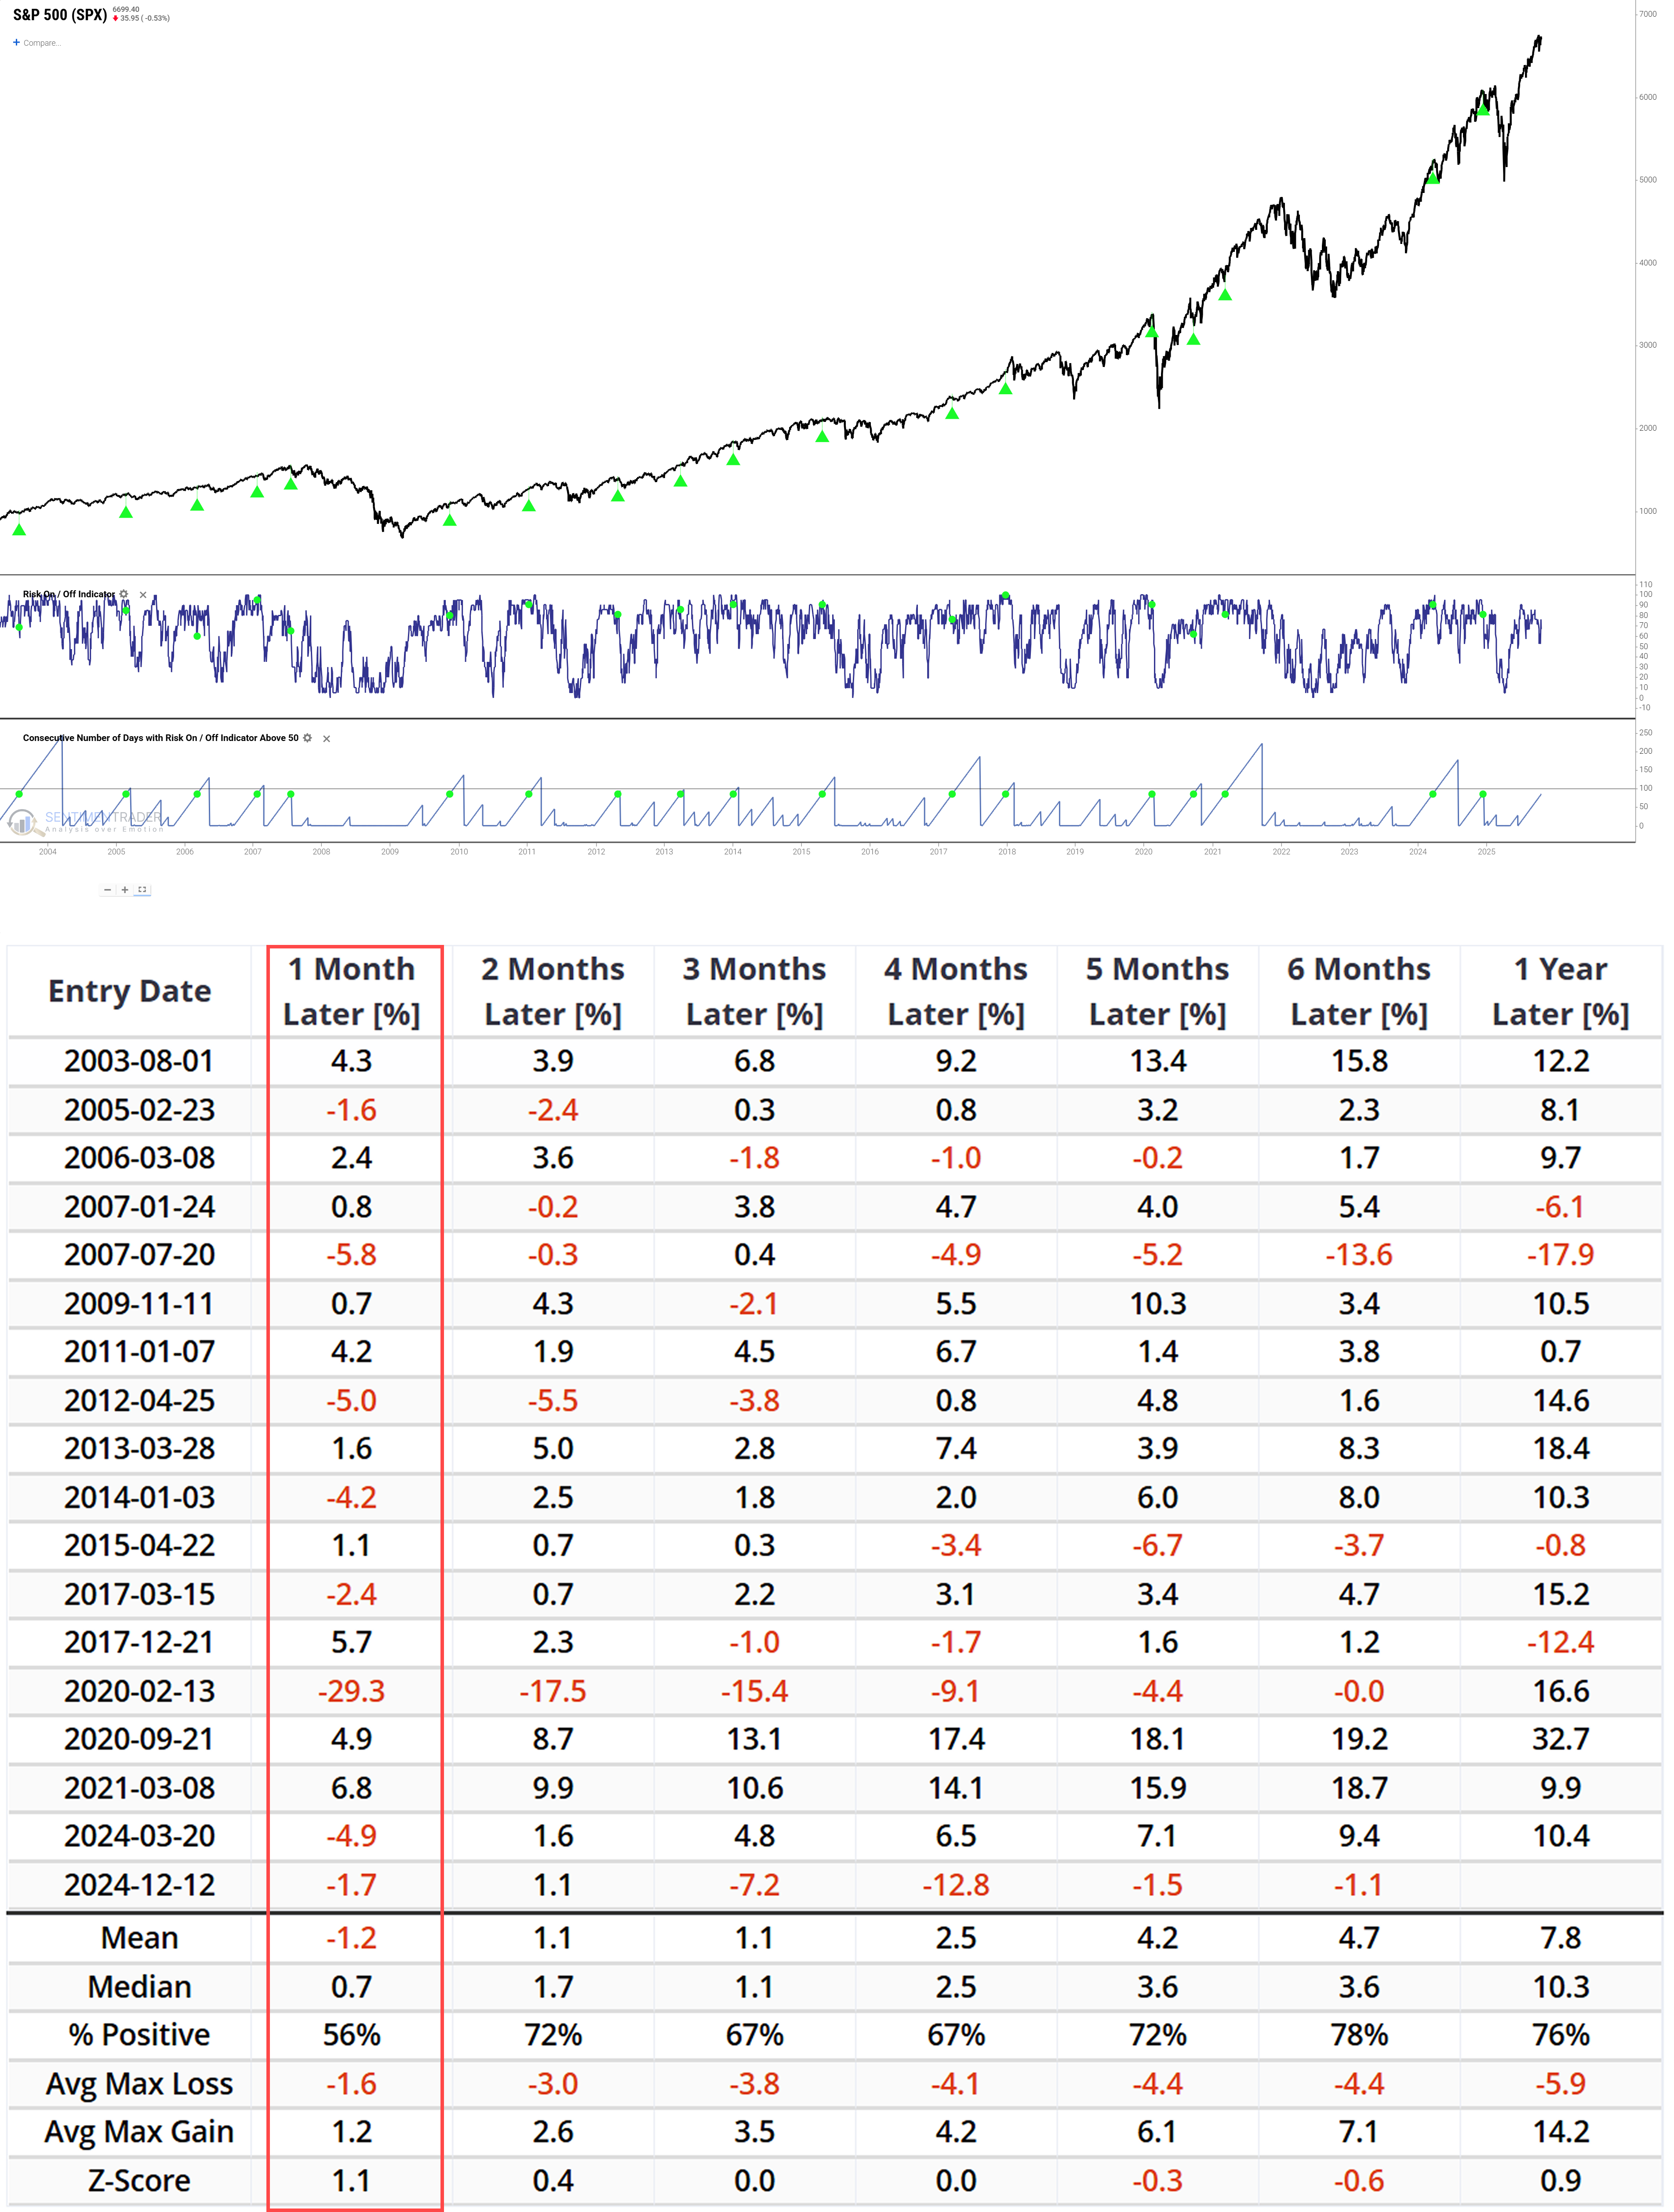
The 'Risk On/Off Indicator' has stayed in 'Risk On' mode for 85+ days:
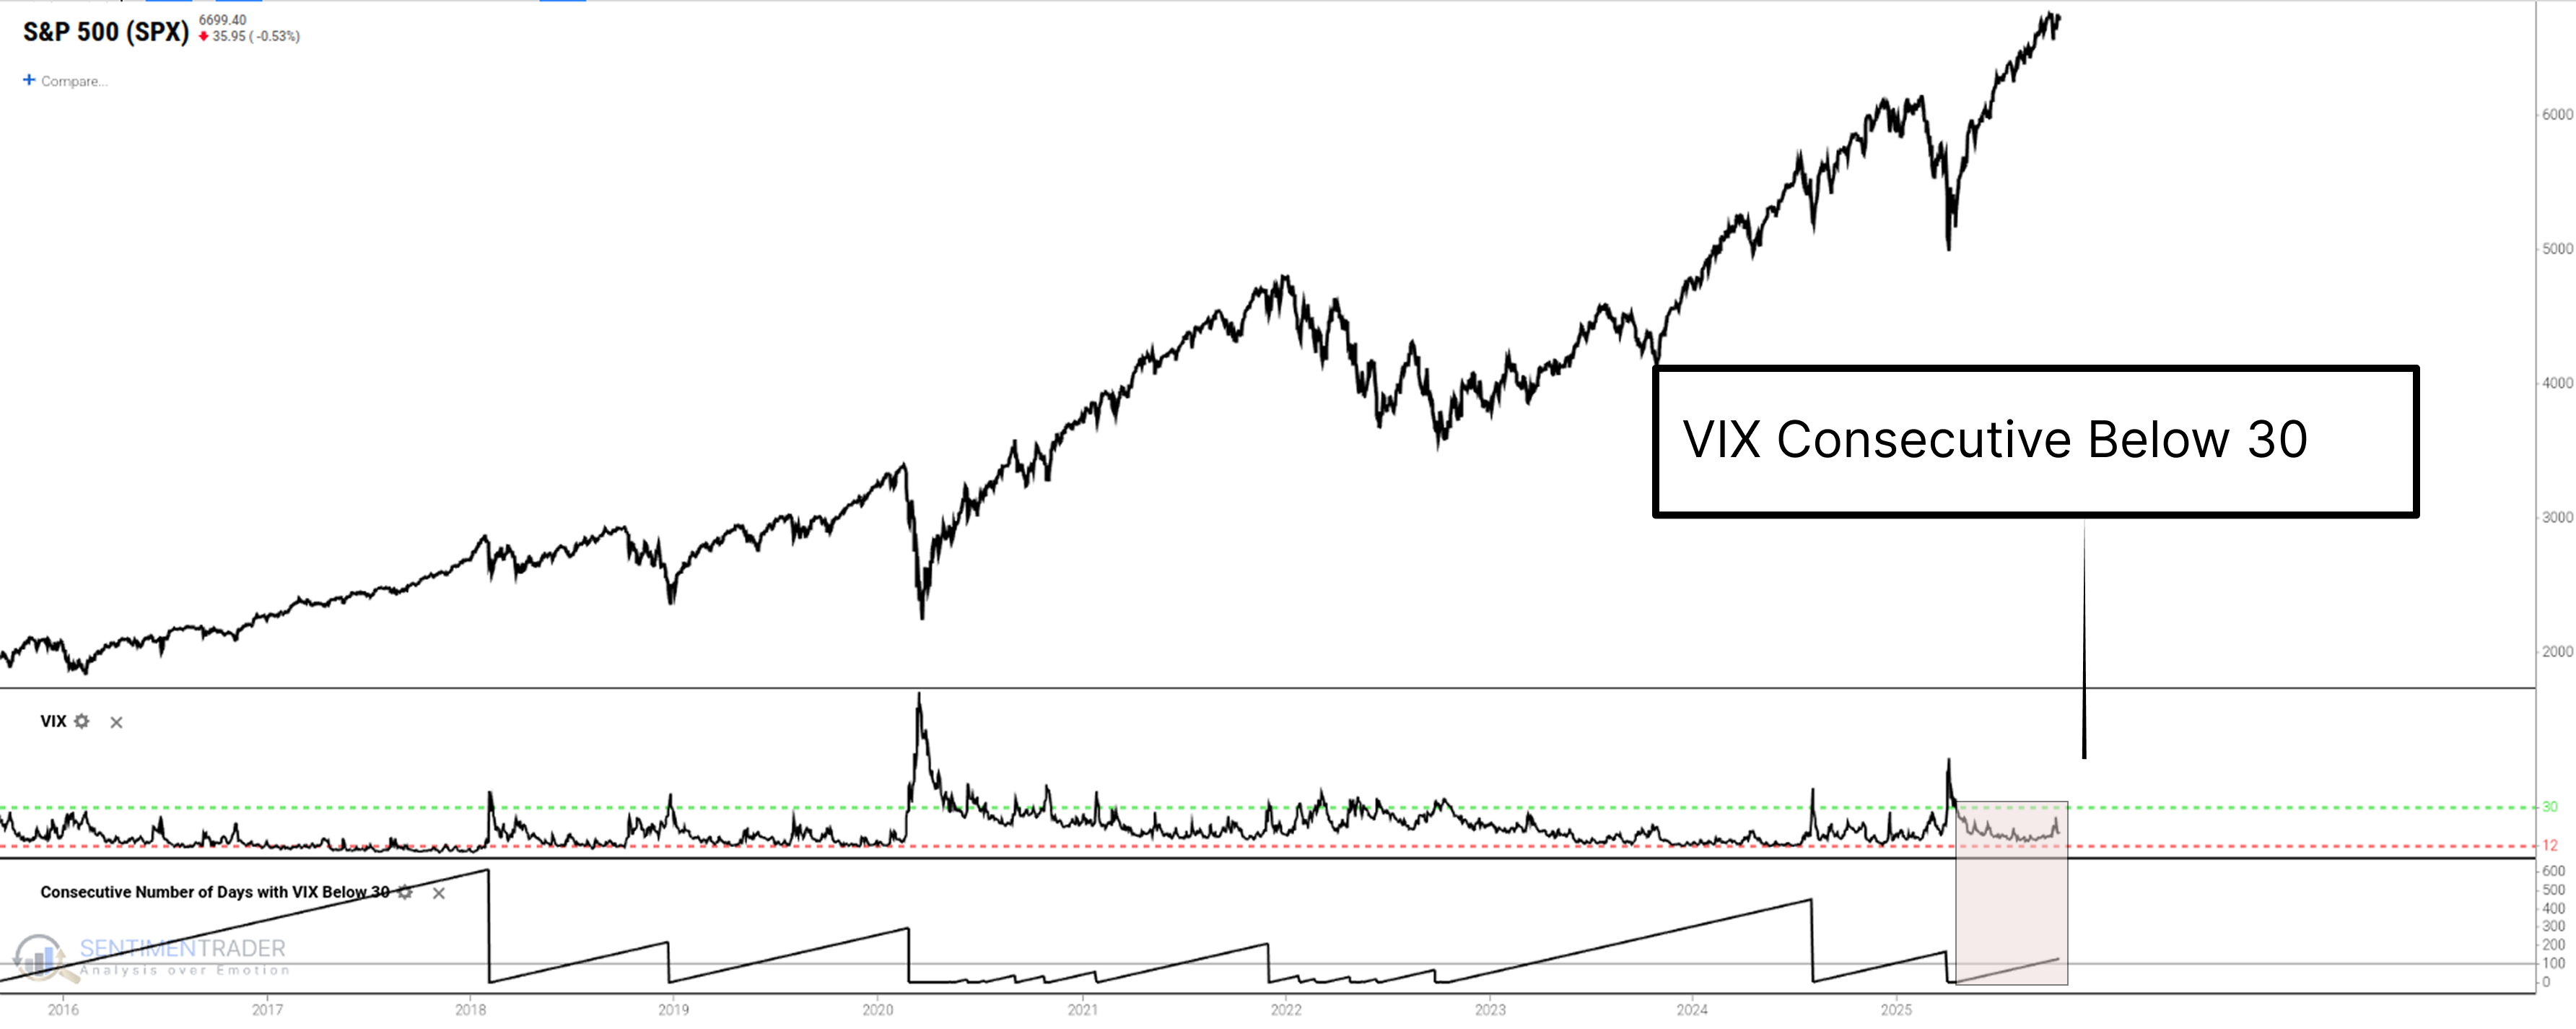
The VIX hasn't touched 30 for 125 consecutive days, indicating sustained low volatility:
Historical data suggests deteriorating risk-reward ratios:
About TradingEdge Weekly...
The goal of TradingEdge Weekly is to summarize some of the research published to SentimenTrader over the past week. Sometimes there is a lot to digest, and this summary highlights the highest conviction or most compelling ideas we discussed. This is NOT the published research; rather, it pulls out some of the most relevant parts. It includes links to the published research for convenience, and if you don't subscribe to those products, it will present the options for access.