
TradingEdge Weekly for Oct 17 - Market headwinds, silver's industrial narrative, gold's historic run, continuation signals

Key points:
- A sharp reversal from an all-time high combined with a volatility spike signals potential market weakness.
- Silver's industrial narrative clashes with bearish short-term signals.
- Gold's historic run of new highs suggests long-term upside despite short-term consolidation.
- Microcap strength and RSI indicators flash bullish continuation signals.
- Sectors showing historical strength: technology, industrials, and regional banks.
House view:
- Stocks:
- Short-term: Modestly bearish. VIX spiked to elevated levels amid policy-driven tensions, consistent with historical patterns of near-term volatility following trade conflict escalations . The market churned despite positive earnings from financial leaders-tech megacaps led selling pressure due to export curbs and demand concerns, while QQQ logged consecutive down days from recent highs . Breadth surges during mid-week relief rallies failed to sustain, a classic near-term warning sign, compounded by delayed economic data from the government shutdown creating policy uncertainty . This time frame covers 1 - 4 weeks.
- Intermediate-term: No view. Positive earnings from cyclical sectors like financials haven't translated to broad market upside, while speculative activity in tech names has pulled back after early-October selloffs . Valuations remain stretched by historical standards, yet Fed easing expectations provide offsetting support-though recent hawkish signals from officials have introduced uncertainty to rate paths . Risks persist: escalating trade tensions threaten supply chains, and the government shutdown adds policy ambiguity . Sector divergence deepens, with cyclicals benefiting from rate outlooks and tech grappling with regulatory headwinds . The tug-of-war between liquidity hopes and geopolitical risks offers no clear edge . This time frame covers 1-5 months.
- Long-term: Bullish. The recovery from early-October panic aligns with historical patterns of market resilience after policy-driven selloffs . Long-term breadth measures are improving as economically sensitive sectors (financials, industrials) regain leadership, supported by robust earnings and the Fed's impending easing cycle . Global demand for tech infrastructure and financial services innovation remains intact beyond short-term trade frictions . This time frame covers 6-12 months.
- Cyclical momentum tends to favor financials and industrial sectors, with earnings growth proving resilient to trade headwinds
- Defensive sectors (utilities, consumer staples) offer volatility hedges but limited upside, though healthcare subsectors tied to tech integration show stable demand
- Very long-term (one year+) favors mean reversion to equal-weight indices and small-caps, which lagged large-caps during the earlier tech-led rally
- Bonds: Long-term cycles remain bearish. Historically, September-October has been weak for long-dated Treasuries (TLT), and this pattern has persisted amid ongoing fiscal concerns . Short-term yields pulled back briefly amid safe-haven flows during the early-October selloff, but institutional demand remains concentrated in short-dated bonds amid policy uncertainty . Few analysts' studies signal a trend reversal, with long-term debt sustainability worries still outweighing near-term safe-haven demand .
- Commodities: Signs point to a probable secular bull market for precious metals amid disjointed sector trends. An effective commodity trend model is cautiously bullish on gold. Gold (especially gold miners) pulled back from recent highs amid easing geopolitical tensions but remains in a strong uptrend, shaking off historical tendencies to fade-supported by Fed policy expectations . Oil fell to near five-year lows amid supply gluts and fading geopolitical risk premiums, but speculators' extreme short positions have historically preceded rallies in recent years .
- Crypto: We follow several simple systems for bitcoin, which we consider the equivalent of the S&P 500 for crypto. Due to bitcoin's explosive growth over long periods, it's dangerous to equate neutral conditions with being bearish for some of these. However, if a system is "out," we consider it bearish for this summary.
- Triple 40: Bullish→ Bearish
- RSI Momentum: Bullish
- Trend and Relative Trend: Modestly Bullish→ Bearish
- PMI: Bearish
- M2 ROC: Bullish
Where we're at
Most investors have the most riding on equities. We feel that the most significant determinants of success for investors are whether to adjust their allocation to that asset class based on factors that have historically had a good record of preceding above- or below-random returns in the months ahead.
Those factors include the probability of a looming recession, sentiment, price action, volatility, breadth, and the bond market. The chart below summarizes the main indicators and composite models we watch for those factors, and they're mostly in bullish regimes. Valuations are not part of these factors since the relationship has been too inconsistent on time frames under one year.
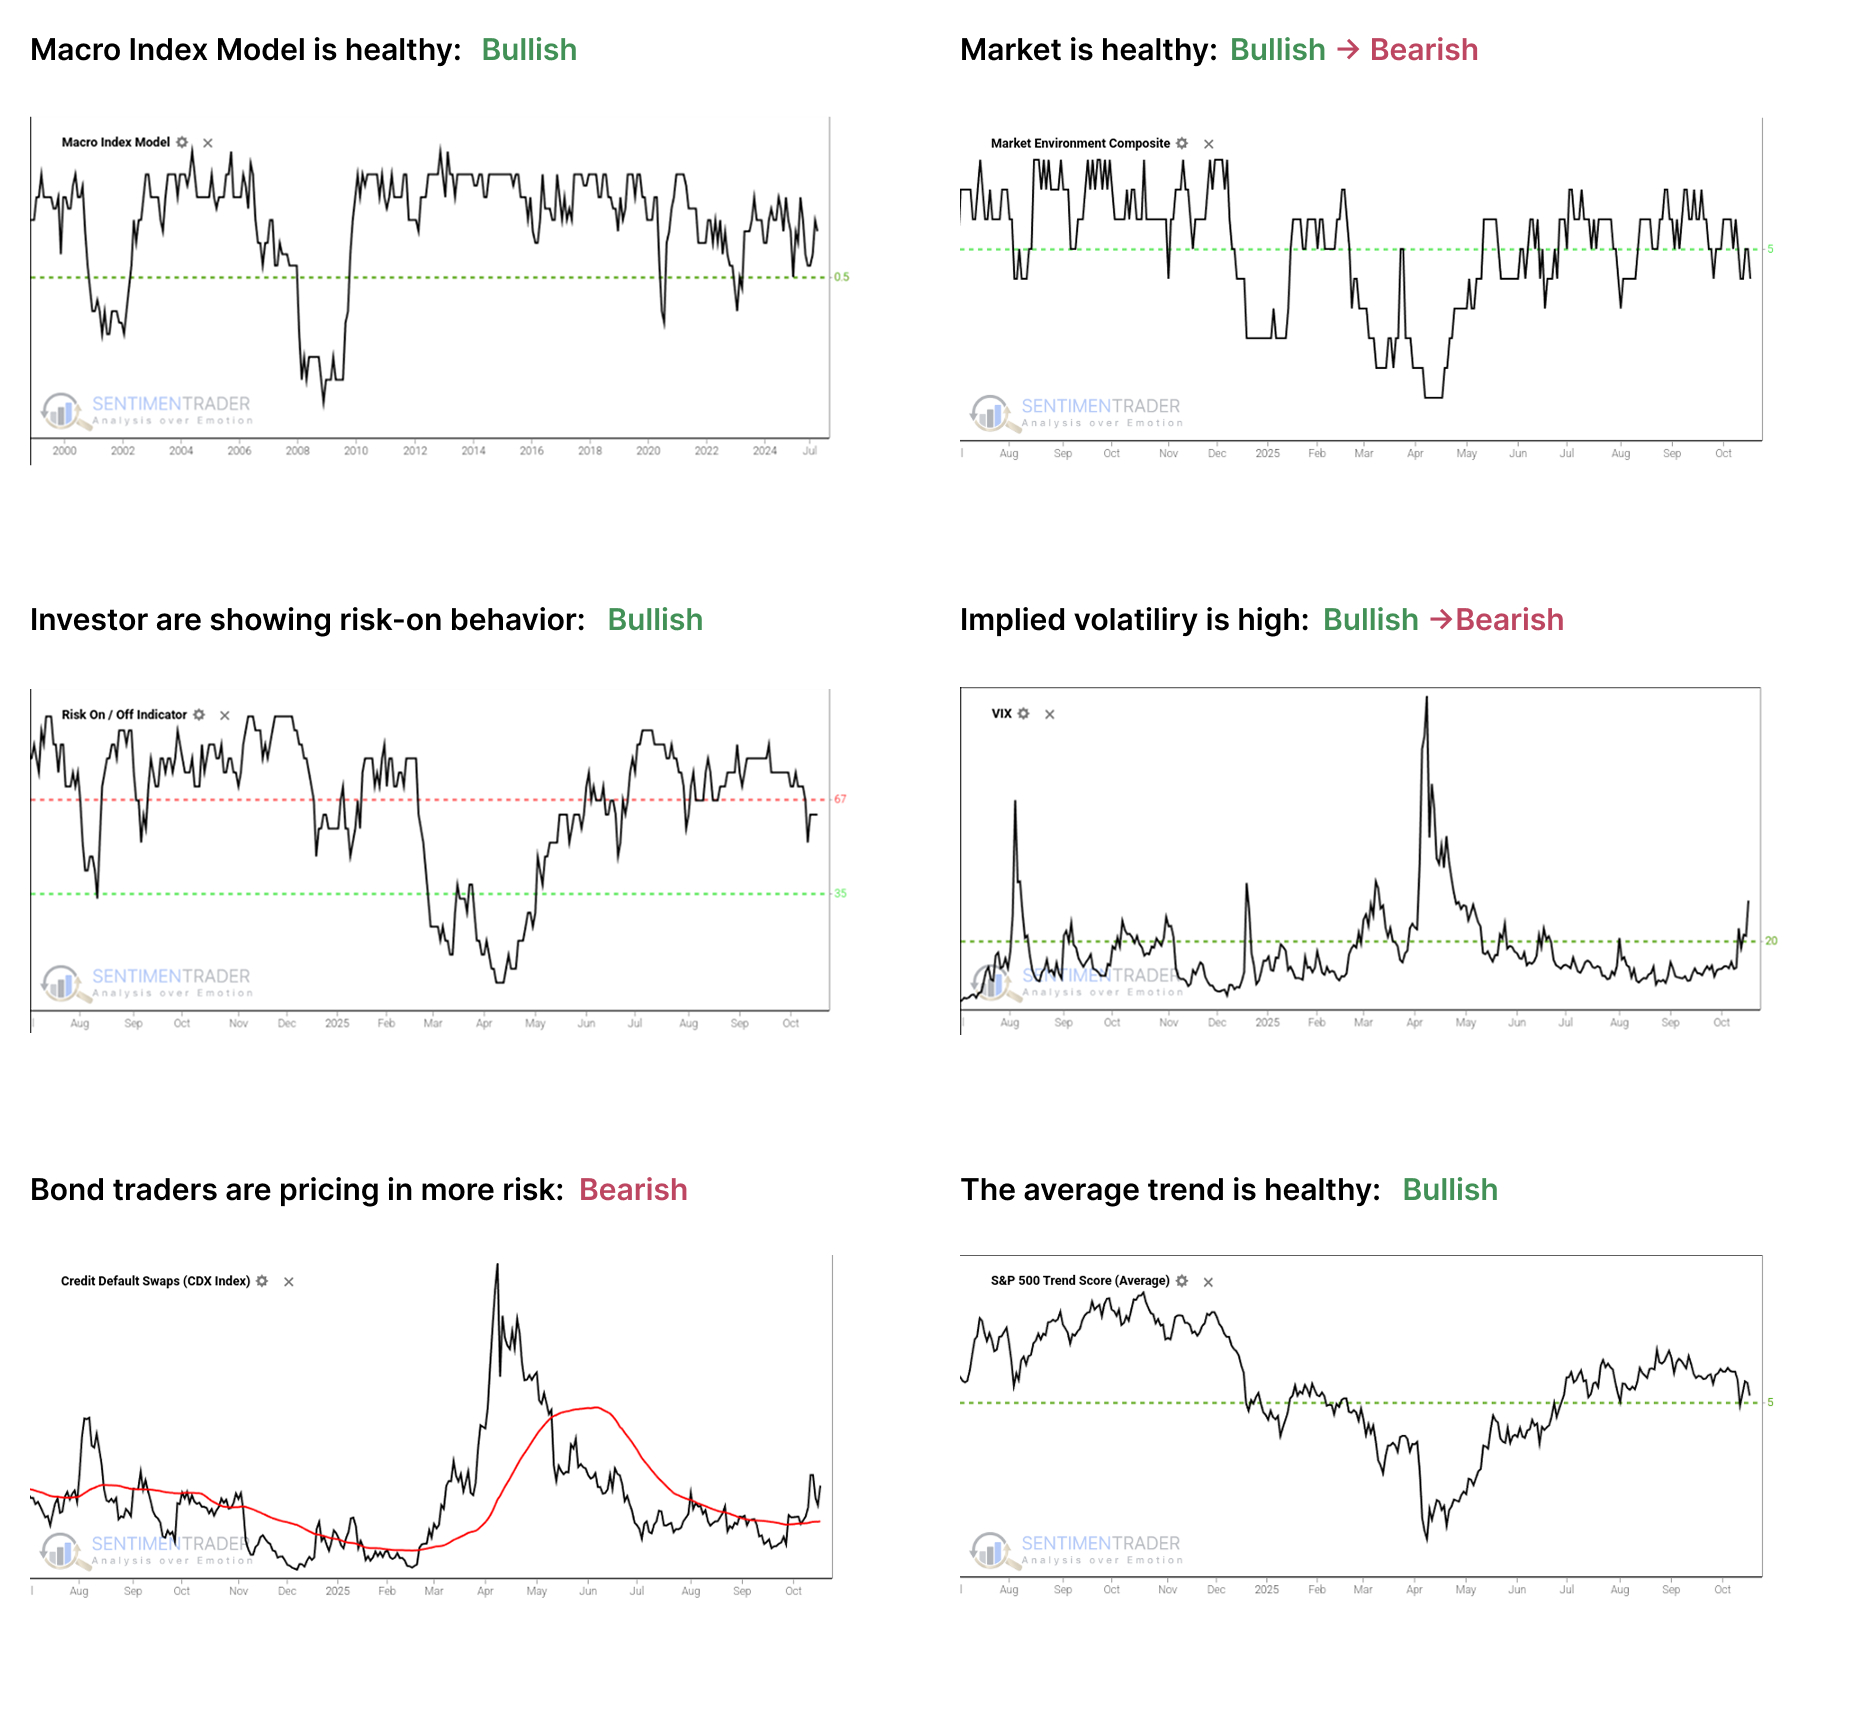
- The Macro Index Model is above the 50% threshold, which has been a vital level as outlined here.
- The Market Environment has been skittish since April, and has slipped into an unhealthy condition. Future returns, especially for higher-beta indices, have historically been notably weaker, with greater risk, when the environment is unhealthy as outlined here.
- The Risk On / Off Indicator shows that investors are still in risk-on mode. This has been a good sign for future returns as outlined here.
- Implied volatility remains above 20, showing a more volatile environment. The S&P 500 has tended to underperform when this is the case as outlined here.
- Credit default swap spreads are above their 50-day moving average, which is modestly concerning as outlined here.
- A composite of trend measures in SPY and the average S&P 500 stock remain above 5, which show healthy trend conditions.
Since April, the most compelling studies have had a strongly bullish bias on longer time frames. You can follow these through the Active Studies page. From time to time, when the analysts' studies provide an overwhelming message, it will override the charts above, but there has been no consensus in the studies to suggest overriding the bullish environment.
Other major markets have been mostly rangebound for four months, and there is little among what we follow to suggest a compelling edge either way.
A Sharp Reversal From a New High Flashes a Warning Sign for Stocks
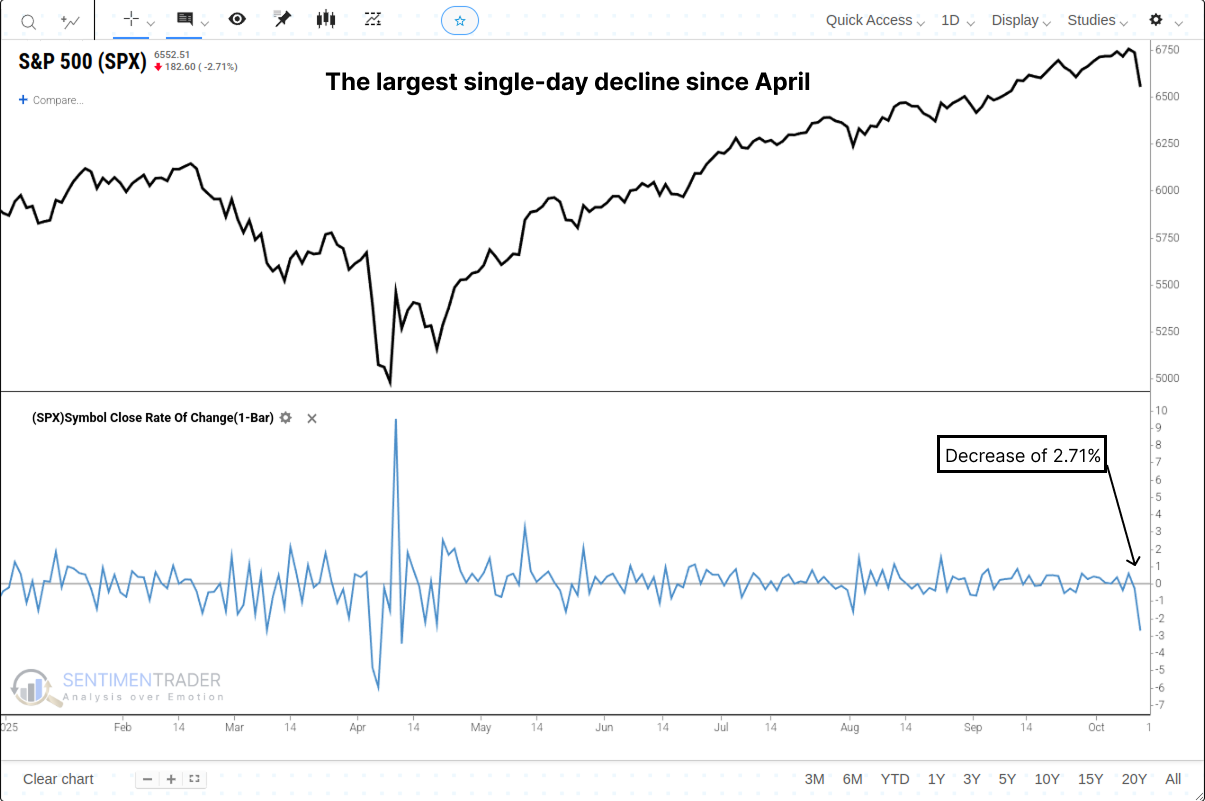
What began as a day of record-breaking optimism on Friday, October 10th, ended in a wave of intense selling, shattering the market's recent sense of calm. The core catalyst was an abrupt escalation in the U.S.-China trade conflict, triggered by a threat from U.S. President Trump to impose \"massive\" new tariffs. The sell-off in equities was swift and severe.
The S&P 500 plunged to close with a loss of 2.71%-its largest single-day decline since April. The technology sector was the epicenter of the decline, with the Nasdaq Composite plummeting 3.6%. This type of sharp reversal raises a critical question: Was this merely a one-off, news-driven event, or does it represent the start of a more significant downturn?
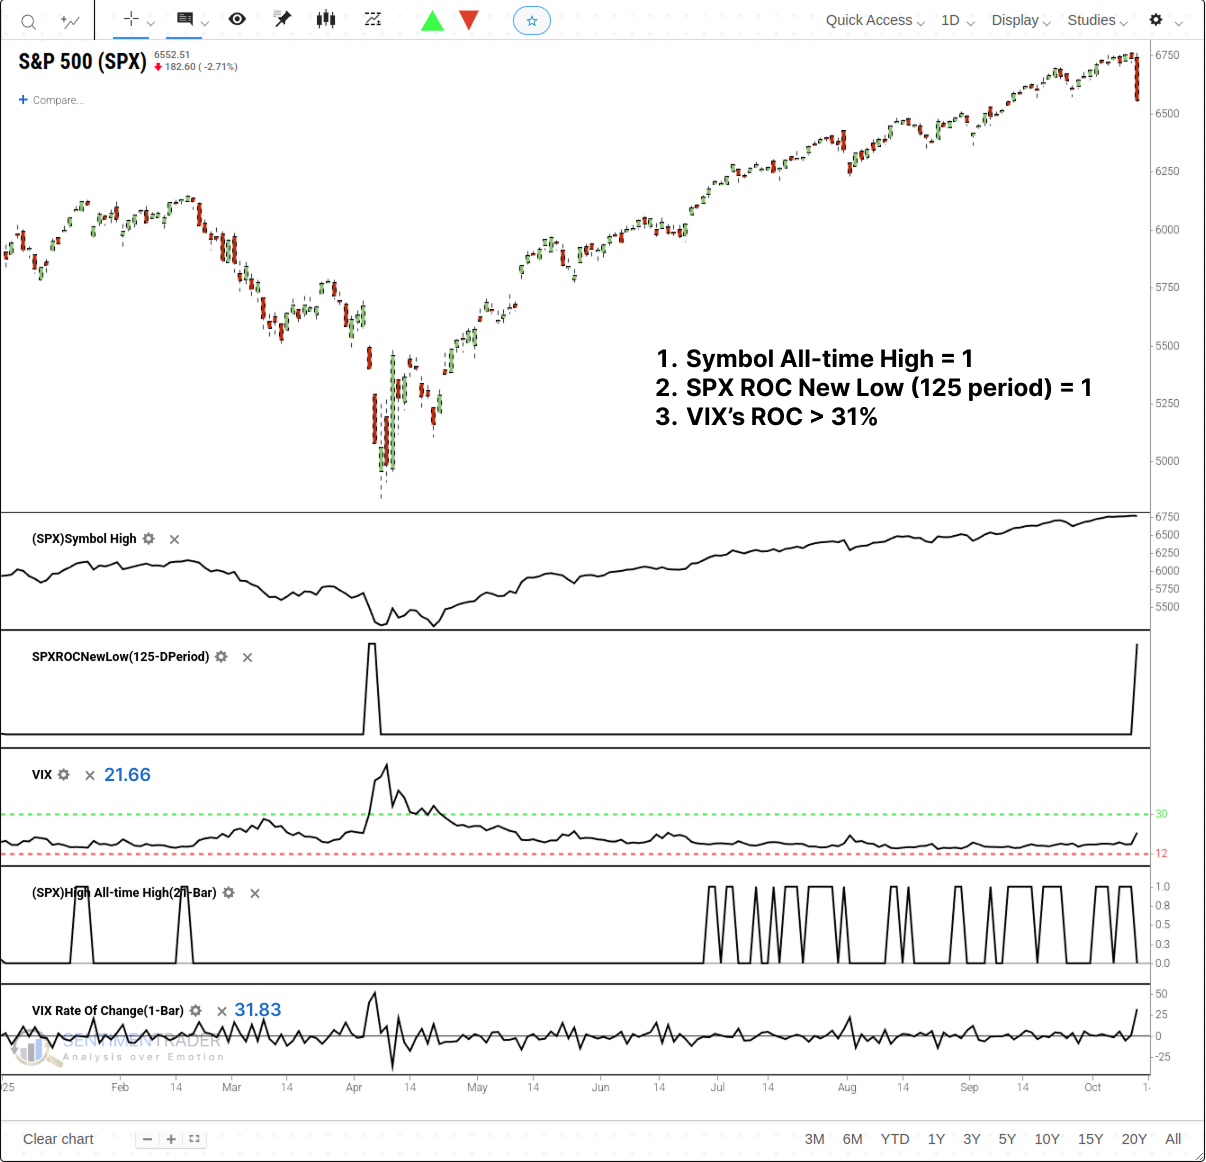
To assess the potential implications, we can quantify this series of events into a specific, testable signal. Let's conduct a study based on the following conditions, all of which must occur within a 21-session window:
- The S&P 500 Index sets a new all-time high.
- The S&P 500 then registers its largest single-day percentage decline over a 125-session period.
- The Volatility Index (VIX) experiences a single-day rate of change greater than 31%.
This precise combination of a market high, a volatility spike, and a momentum breakdown is a rare occurrence, and it has now triggered. For related backtest, clike here.
A Historical Pattern of a Deceptive Bounce, Then Weakness
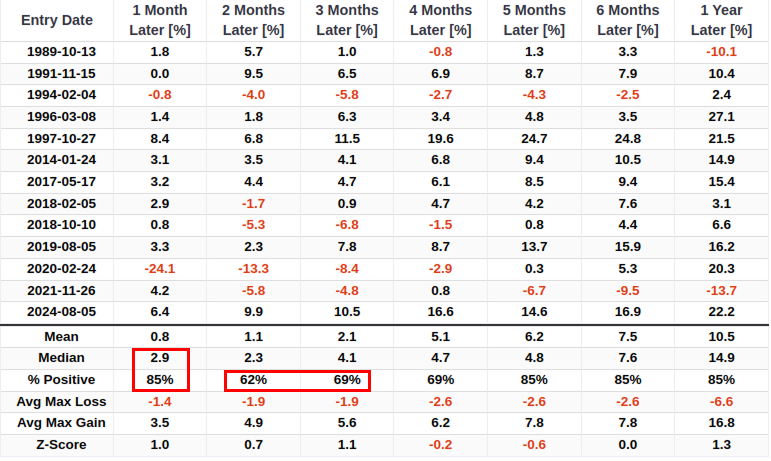
When this rare combination of events has occurred in the past, the S&P 500's performance has followed a distinct and potentially deceptive pattern. The data shows a tendency for a strong initial bounce, which then gives way to a period of significant weakness. One month after a signal, the market was higher 85% of the time with a median return of +2.9%. This suggests an initial \"buy the dip\" reaction has been common.
However, that strength has historically proven to be a bull trap. By the two-month mark, the win rate plummeted to 62%, barely better than a coin flip, and the three-month win rate was only 69%. This two-to-three-month window appears to be the point of maximum vulnerability for the market after this signal. The most dramatic recent example was the signal on February 24, 2020, right at the onset of the COVID-19 crash, where the S&P 500 plunged -24.1% in the following month.
Silver Market's Industrial Narrative Hits a Data Wall
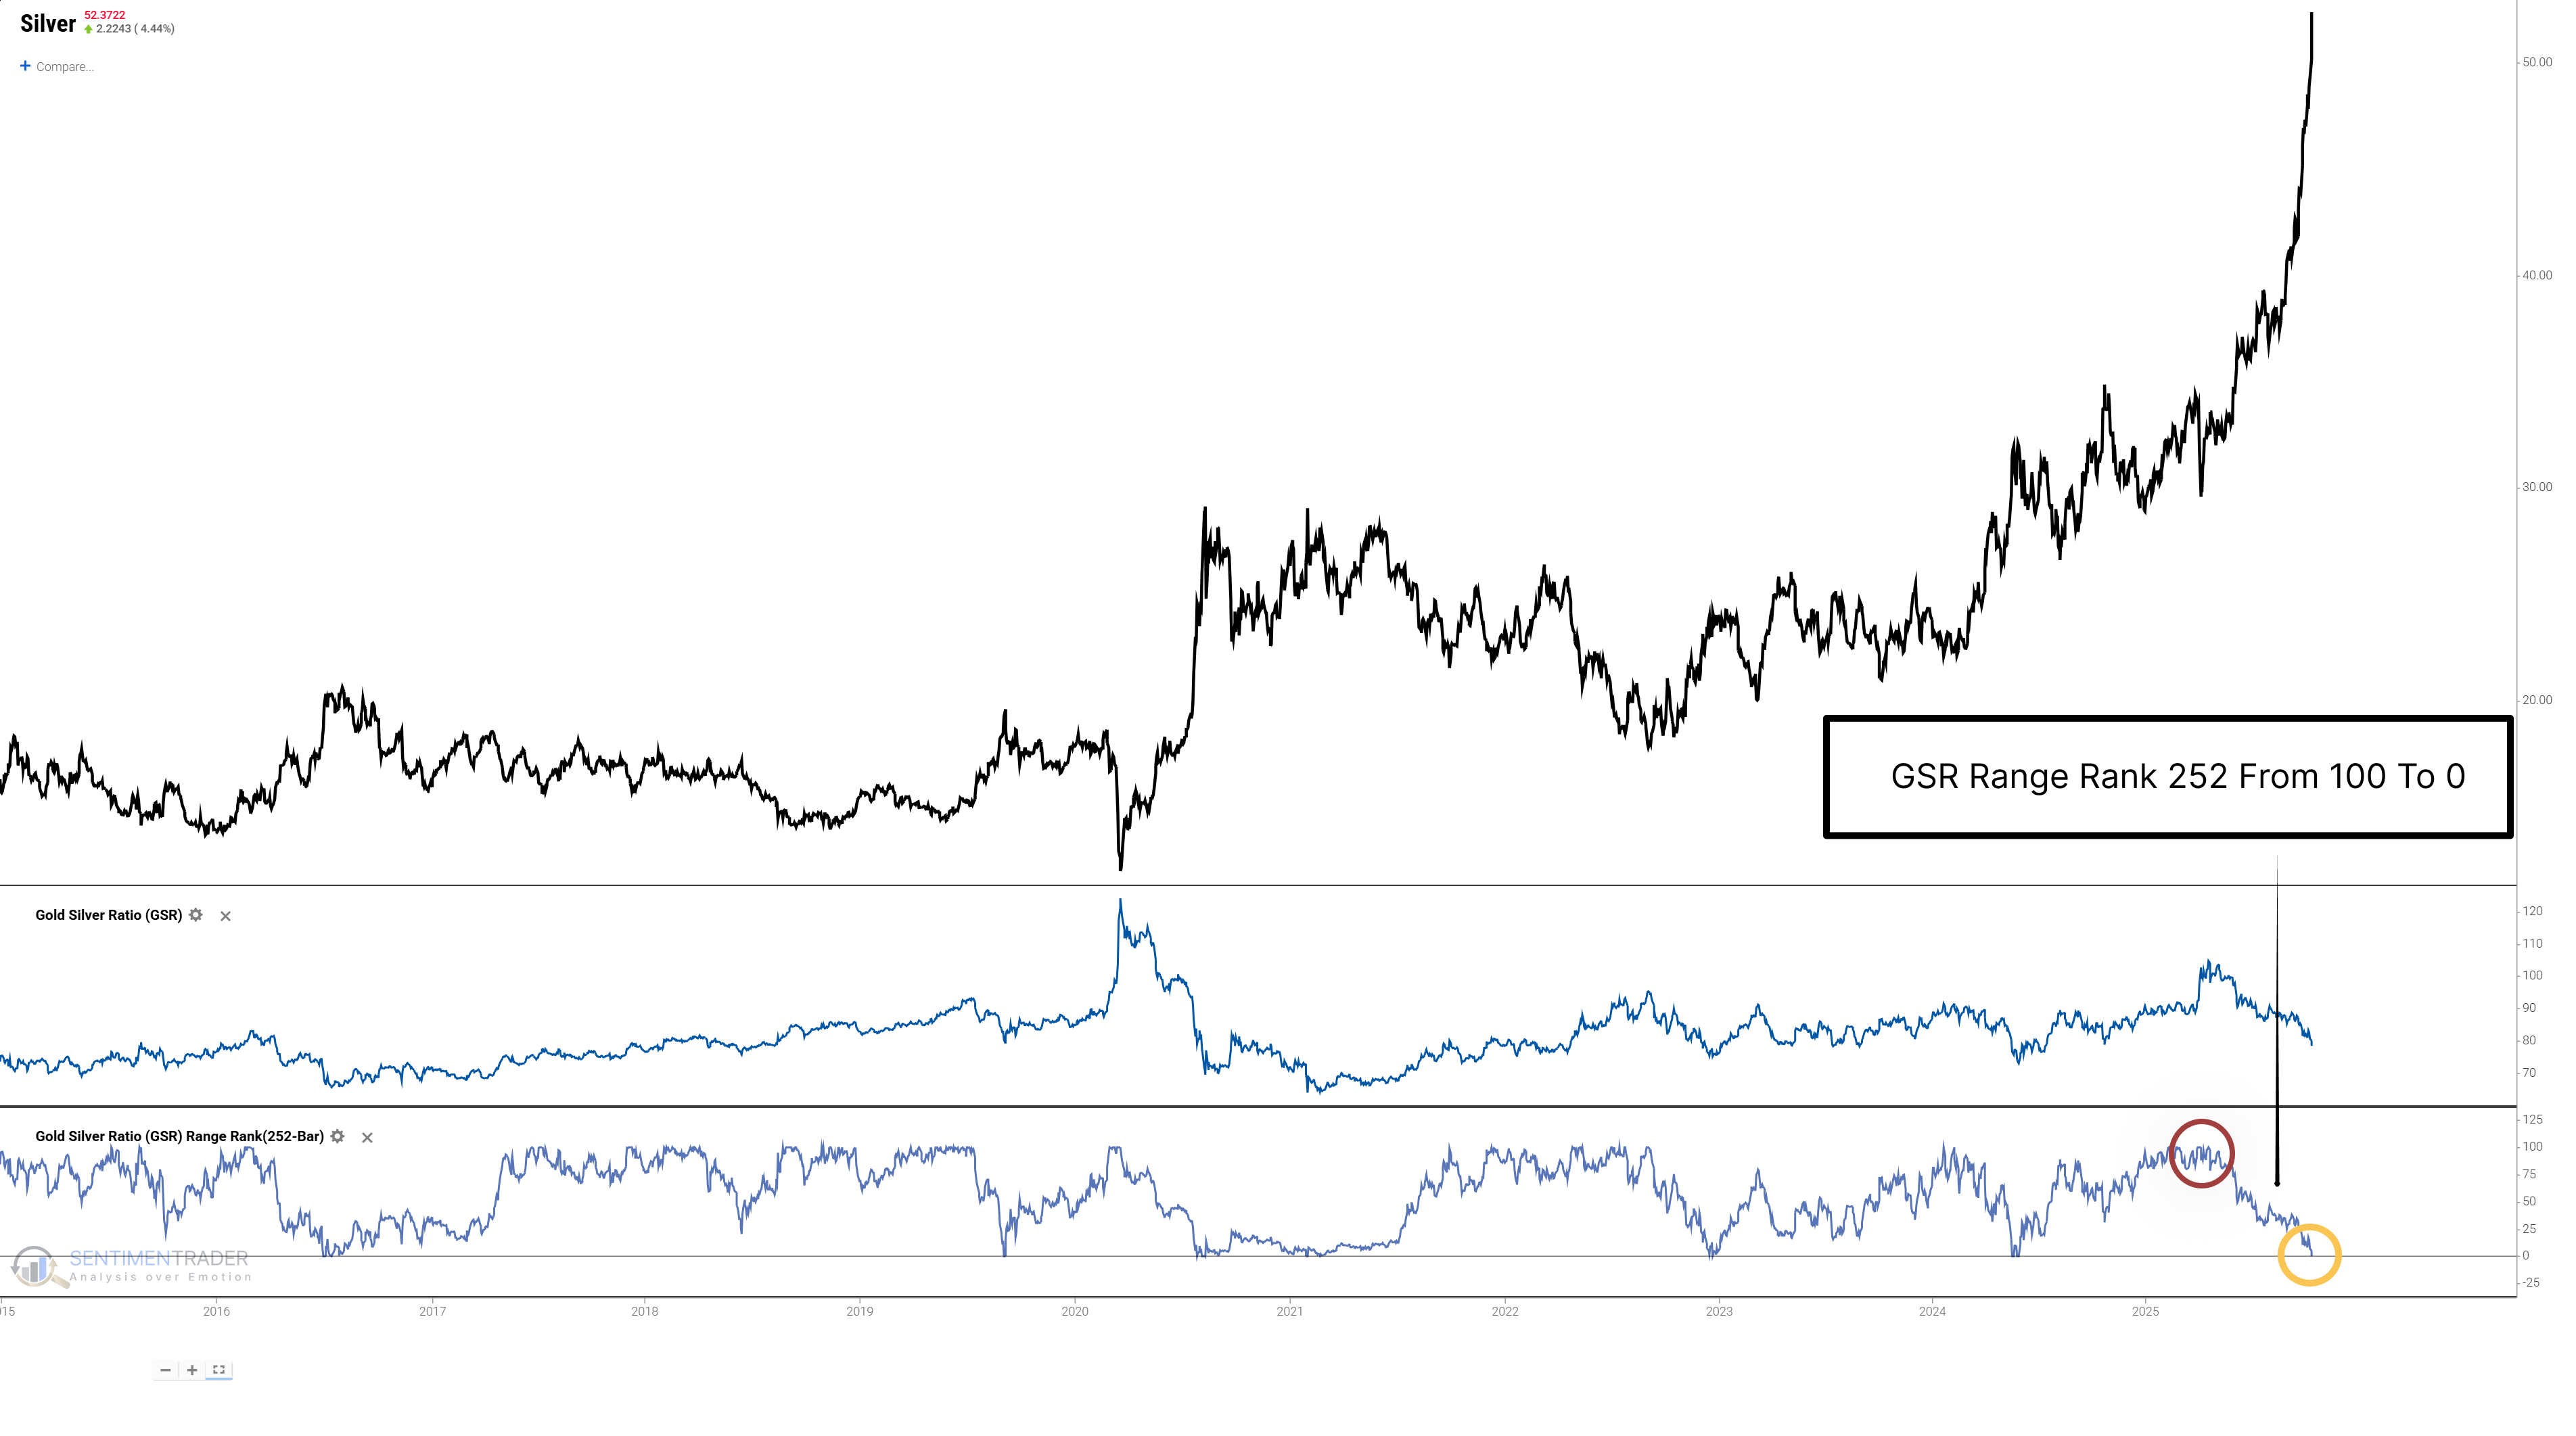
The Gold-to-Silver Ratio (GSR) - a key \"barometer\" for measuring the relative value of the two precious metals - has just sent a rare, historic signal. On October 13, 2025, the ratio collapsed sharply, with its 252-day rank plummeting from 100 (yearly high) to 0 (yearly low) in less than 126 days. This \"GSR Shock\" is not an ordinary market fluctuation, but an anomaly marking a dramatic, rapid revaluation of value between the two metals.
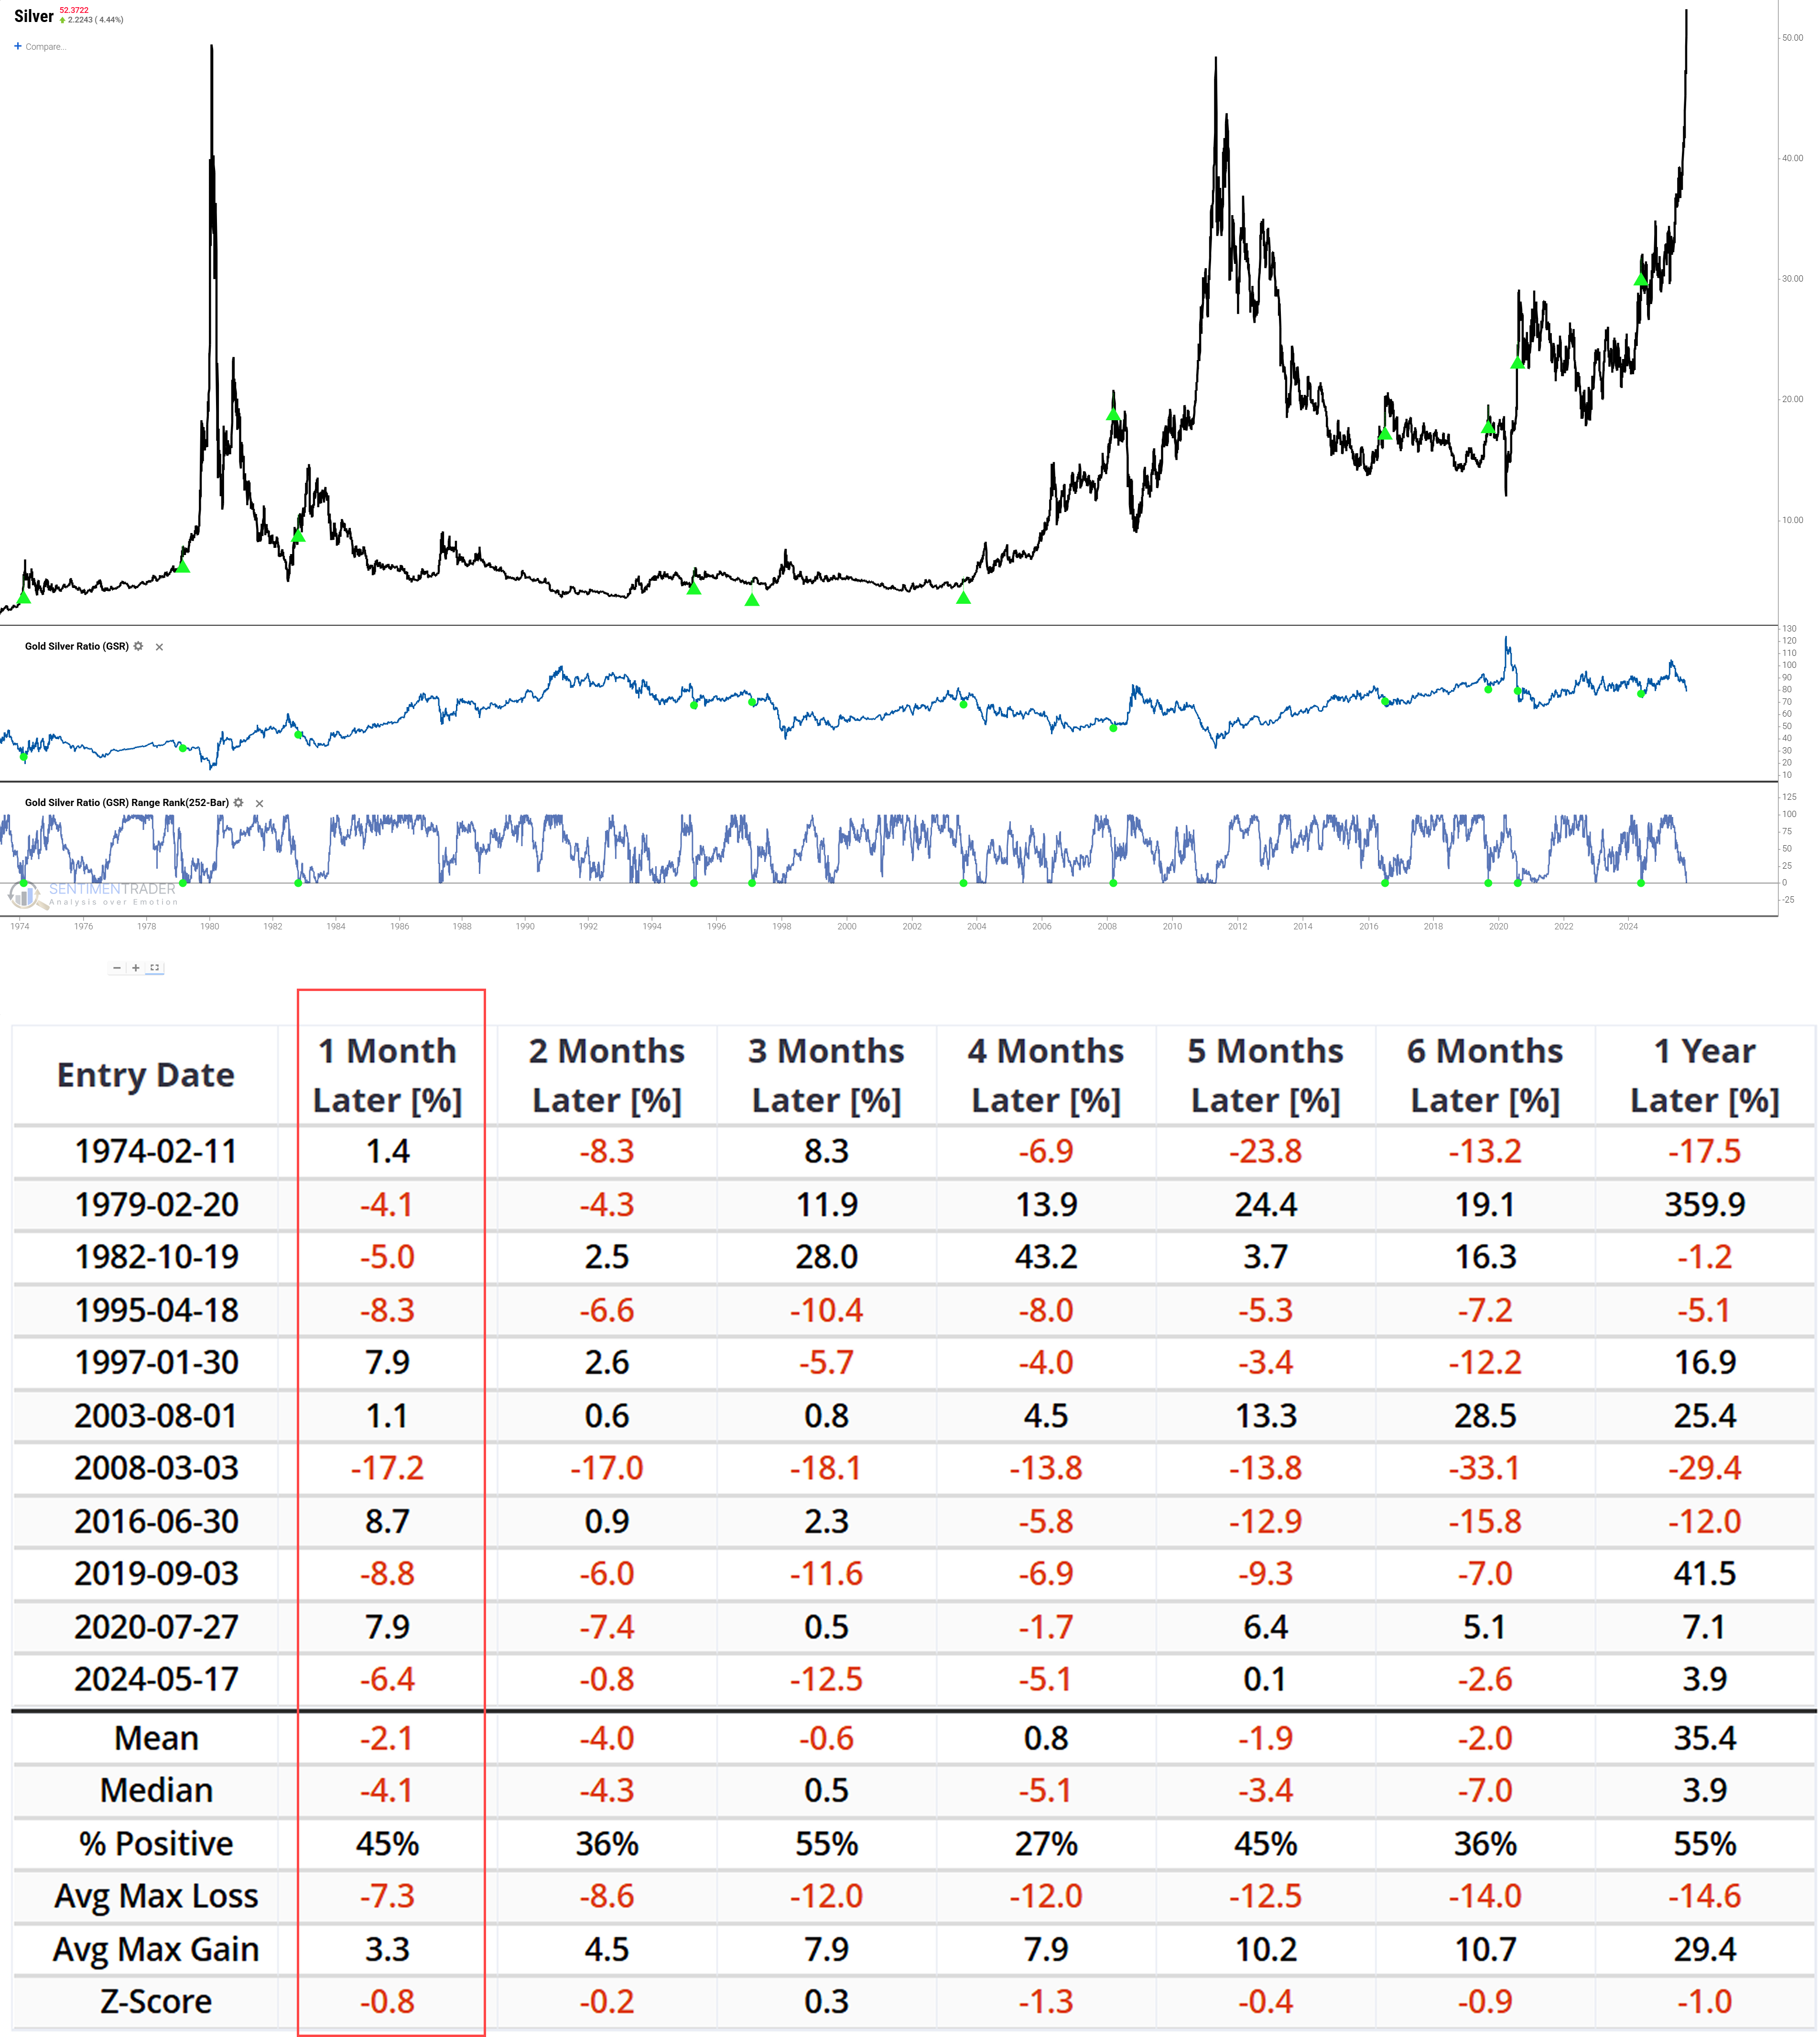
Beneath this optimism, however, historical data poses a severe challenge. The initial signal that ignited market enthusiasm - historically, has not been followed by sustained market rallies. Our backtest data shows that one month after this signal is triggered, the median return for silver is -4.1%, with only a 45% probability of positive returns.Related Backtest Click Here.
Gold's historic run of new highs suggests more upside
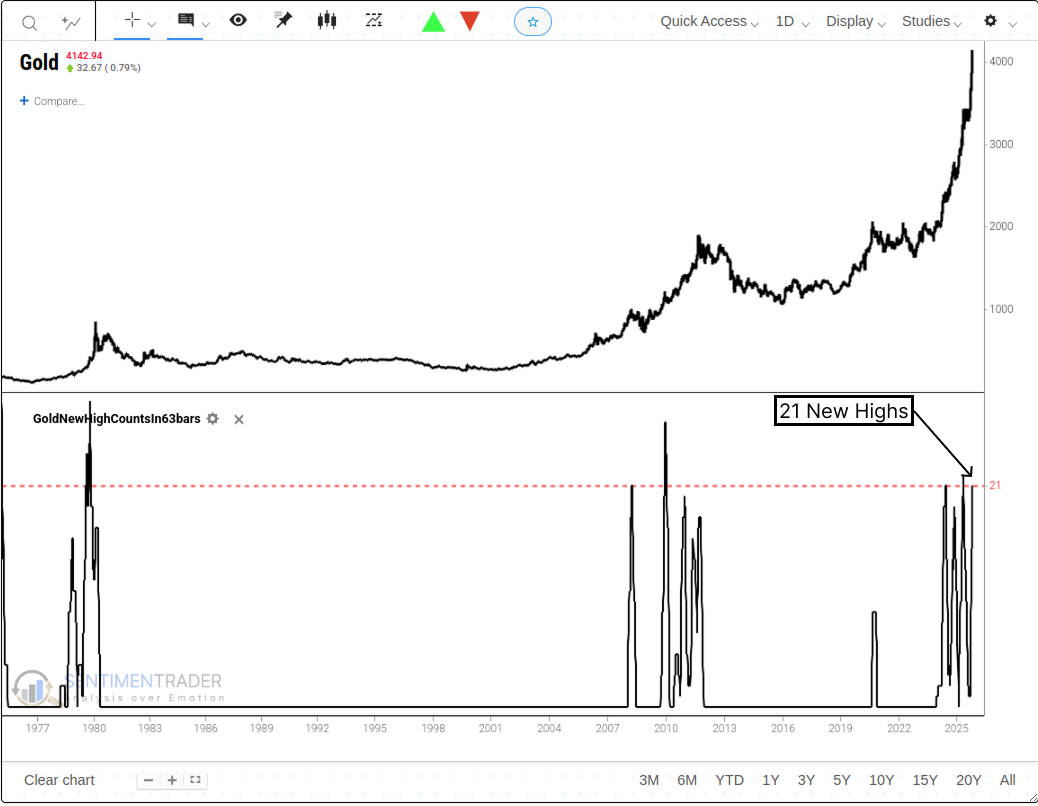
Recent research has highlighted the persistent strength in Gold, noting its impressive run of new highs over the past year. The conclusion was that the precious metal had more upside potential.
Although we'll only know in hindsight whether Gold is in a secular or cyclical uptrend, the case for a sustained advance gained further credence now that the precious metal has closed at a new all-time high an extraordinary 21 times over the past 63 sessions. As the chart shows, such a concentrated number of new highs is exceptionally rare, with precedents seen only during some of Gold's most powerful historical advances.
Three Indicators that have Flashed Continuation Signals Recently
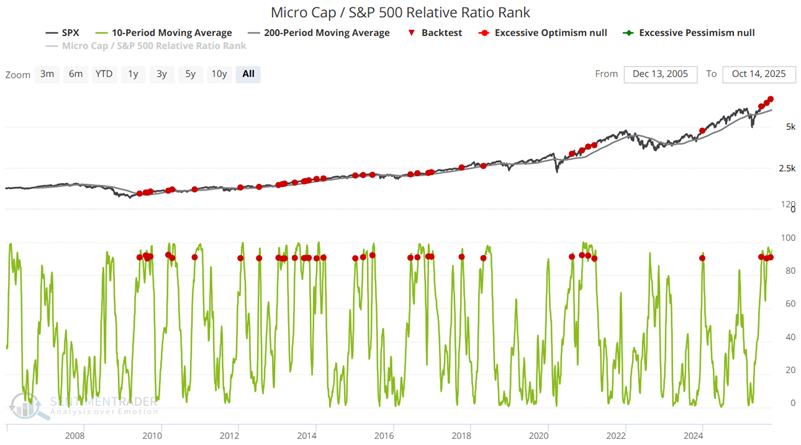
It is typically a good sign for an ongoing bull market if participation expands and more stocks participate. Microcap stocks finally appear to have joined the party recently. The Microcap / S&P Relative Ratio Rank indicator compares the performance of the smallest capitalized stocks relative to the largest and shows where the ratio is relative to its range over the past four months. When the relative ratio is high, investors are showing risk-on behavior. When the ratio drops to a low level, they exhibit risk-off behavior.
The chart below highlights all dates when the 10-day average of the Micro Cap / S&P Relative Ratio Rank indicator crossed above 90% while the S&P 500 index was above its 200-day moving average. The 200-day index average filters for an uptrend in the broader market, while the cross above 90% for the indicator average indicates that small companies are showing greater strength relative to large ones.
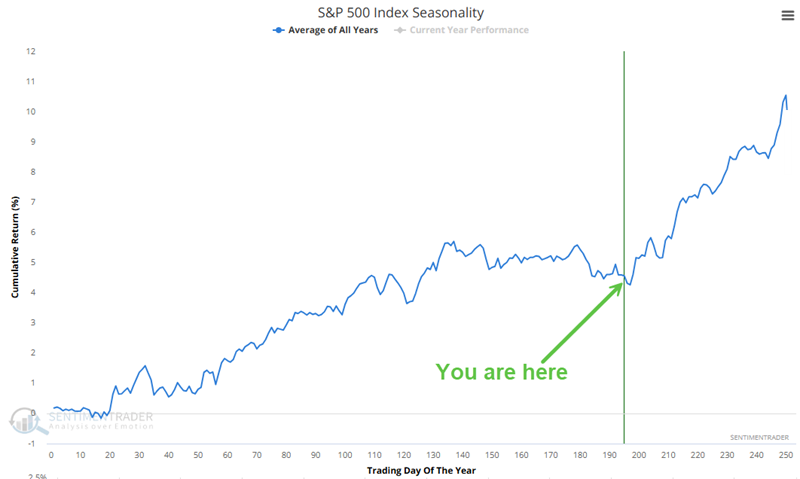
Three Sectors Where Traders Should Look for Opportunity
The stock market has been on a tear since bottoming in early April. The recent Fed rate cut has added fuel to the bullish fire, and we are now heading into what is generally considered the weakest seasonal period of the year. The charts below show the Annual Seasonal Trends historically for the S&P 500 index. A favorable period extends from the close on Trading Day of the Year (TDY) #197 through the end of the year. For 2025, this period runs from the close on October 15th through December 31st.
About TradingEdge Weekly...
The goal of TradingEdge Weekly is to summarize some of the research published to SentimenTrader over the past week. Sometimes there is a lot to digest, and this summary highlights the highest conviction or most compelling ideas we discussed. This is NOT the published research; rather, it pulls out some of the most relevant parts. It includes links to the published research for convenience, and if you don't subscribe to those products, it will present the options for access.