
TradingEdge Weekly for Oct 10 - Consumer confidence contrarian signals, transportation seasonal trends, gold bullish risks

Key points:
- Consumer confidence signals historically bullish stocks but cautionary for bonds
- Nikkei's strong rally shows breadth confirmation amidst calm momentum
- Transportation stocks enter favorable seasonal period
- Soybeans begin bullish seasonal cycle
- Gold bullish narrative clashes with rare exhaustion signals
House view:
- Stocks:
- Short-term: Neutral. U.S. major stock indices entered a phase of consolidation after a prolonged rally, with benchmark indices giving back some recent gains amid heightened profit-taking and policy uncertainty . A key near-term headwind has emerged from delayed releases of critical economic data, creating a "data vacuum" that complicates market pricing of growth and monetary policy paths . Sector divergence has intensified: tech giants tied to AI infrastructure maintained relative strength, with some hitting new highs on announcements of expanded data center partnerships, while previously leading mega-caps faced pressure following Fed officials' comments highlighting elevated valuations . Defensive sectors including utilities and consumer staples outperformed as investors sought stability, aligning with historical patterns during periods of rising uncertainty . Market breadth showed signs of narrowing, with momentum concentrated in a smaller subset of AI-themed stocks, while cyclical sectors sensitive to policy clarity lagged . This dynamic reflects a balance between Fed easing expectations and short-term fundamental ambiguity .Time frame: 1-4 weeks.
- Intermediate-term: No view. Valuations remain stretched relative to historical averages, with multiple metrics indicating the market is trading at expensive levels by long-term standards . However, two factors provide offsetting support: 1) Fed policy remains tilted toward easing, with market sentiment anchored by expectations of further rate cuts to counter labor market softening ; 2) AI-driven profitability continues to materialize, as evidenced by sustained enterprise spending on computing power infrastructure and positive outlooks from semiconductor and cloud service providers . Risks persist, though: short-term policy disruptions could weigh on quarterly growth, while some market participants warn of speculative excess in AI-related names without earnings validation . Sector rotation remains lopsided: energy stocks struggle amid supply glut concerns, while defensive segments lack clear catalysts beyond short-term safe-haven flows . The tension between technical strength (key indices still above major moving averages) and fundamental uncertainty keeps the outlook balanced .Time frame: 1-5 months.
- Long-term: Bullish. The equity market's long-term upward trajectory remains anchored by structural growth in AI innovation and digital transformation . Historical patterns suggest the impact of short-term policy disruptions is transitory-markets typically recover within months, with broader trends reasserting themselves . AI's penetration into enterprise software, data centers, and content generation is opening new growth frontiers, driving sustained capital expenditure that extends beyond cyclical fluctuations . Market breadth is showing gradual improvement: small-cap stocks tied to the AI supply chain are gaining traction, complementing mega-cap leadership, as liquidity conditions remain supportive . Structural tailwinds including the Fed's easing cycle and global demand for tech infrastructure are expected to outweigh near-term valuation concerns over time .Time frame: 6-12 months.
- Cyclical momentum: Favors AI infrastructure (semiconductors, high-performance memory) and cloud services, supported by ongoing enterprise investment in digital transformation that has proven resilient to short-term market disruptions .
- Defensive resilience: Utilities and consumer staples offer volatility hedges but limited upside, though healthcare subsectors tied to technological innovation may see selective strength amid stable demand .
- Longer-term: Small-cap stocks could narrow their valuation discount if easing liquidity conditions and AI spending diffusion continue, potentially shifting the market toward more balanced leadership .
- Bonds: Long-term cycles remain bearish, but short-term volatility has moderated. Yields across major tenors traded in a tight range, with downward pressure from safe-haven demand amid policy uncertainty offset by concerns over fiscal deficits and ongoing Treasury issuance . The yield curve has steepened modestly, as short-term yields reacted more strongly to Fed easing expectations while long-term yields remained constrained by debt sustainability worries . Institutional demand for short-dated bonds has picked up amid the "data vacuum," though selling pressure on long-dated securities persists . This dynamic reflects market expectations for near-term policy accommodation balanced against long-term structural headwinds .Time frame: 1-6 months.
- Commodities: Divergence across subsectors persists, with spillover effects on related U.S. equity segments. An effective commodity trend model remains cautiously bullish .
- Gold: Pulled back after hitting recent highs, as initial safe-haven flows were offset by profit-taking and a stronger dollar . Long-term support remains intact due to Fed easing expectations, which benefits gold-related equities .
- Oil: Extended declines amid deepening oversupply concerns, with production decisions from major exporters and muted demand expectations weighing on prices . This has pressured U.S. energy stocks, which already faced headwinds from uncertain demand fundamentals .
- Industrial metals: Maintained upward momentum, driven by robust demand from AI data centers and semiconductor production . Strength in this segment has supported U.S. materials and technology hardware stocks tied to industrial supply chains .
- Crypto: We follow several simple systems for bitcoin, which we consider the equivalent of the S&P 500 for crypto. Due to bitcoin's explosive growth over long periods, it's dangerous to equate neutral conditions with being bearish for some of these. However, if a system is "out," we consider it bearish for this summary.
- Triple 40: Modestly Bullish → Bullish
- RSI Momentum: Bullish
- Trend and Relative Trend: Modestly Bullish
- PMI: Bearish
- M2 ROC: Bullish
Where we're at
Most investors have the most riding on equities. We feel that the most significant determinants of success for investors are whether to adjust their allocation to that asset class based on factors that have historically had a good record of preceding above- or below-random returns in the months ahead.
Those factors include the probability of a looming recession, sentiment, price action, volatility, breadth, and the bond market. The chart below summarizes the main indicators and composite models we watch for those factors, and they're mostly in bullish regimes. Valuations are not part of these factors since the relationship has been too inconsistent on time frames under one year.
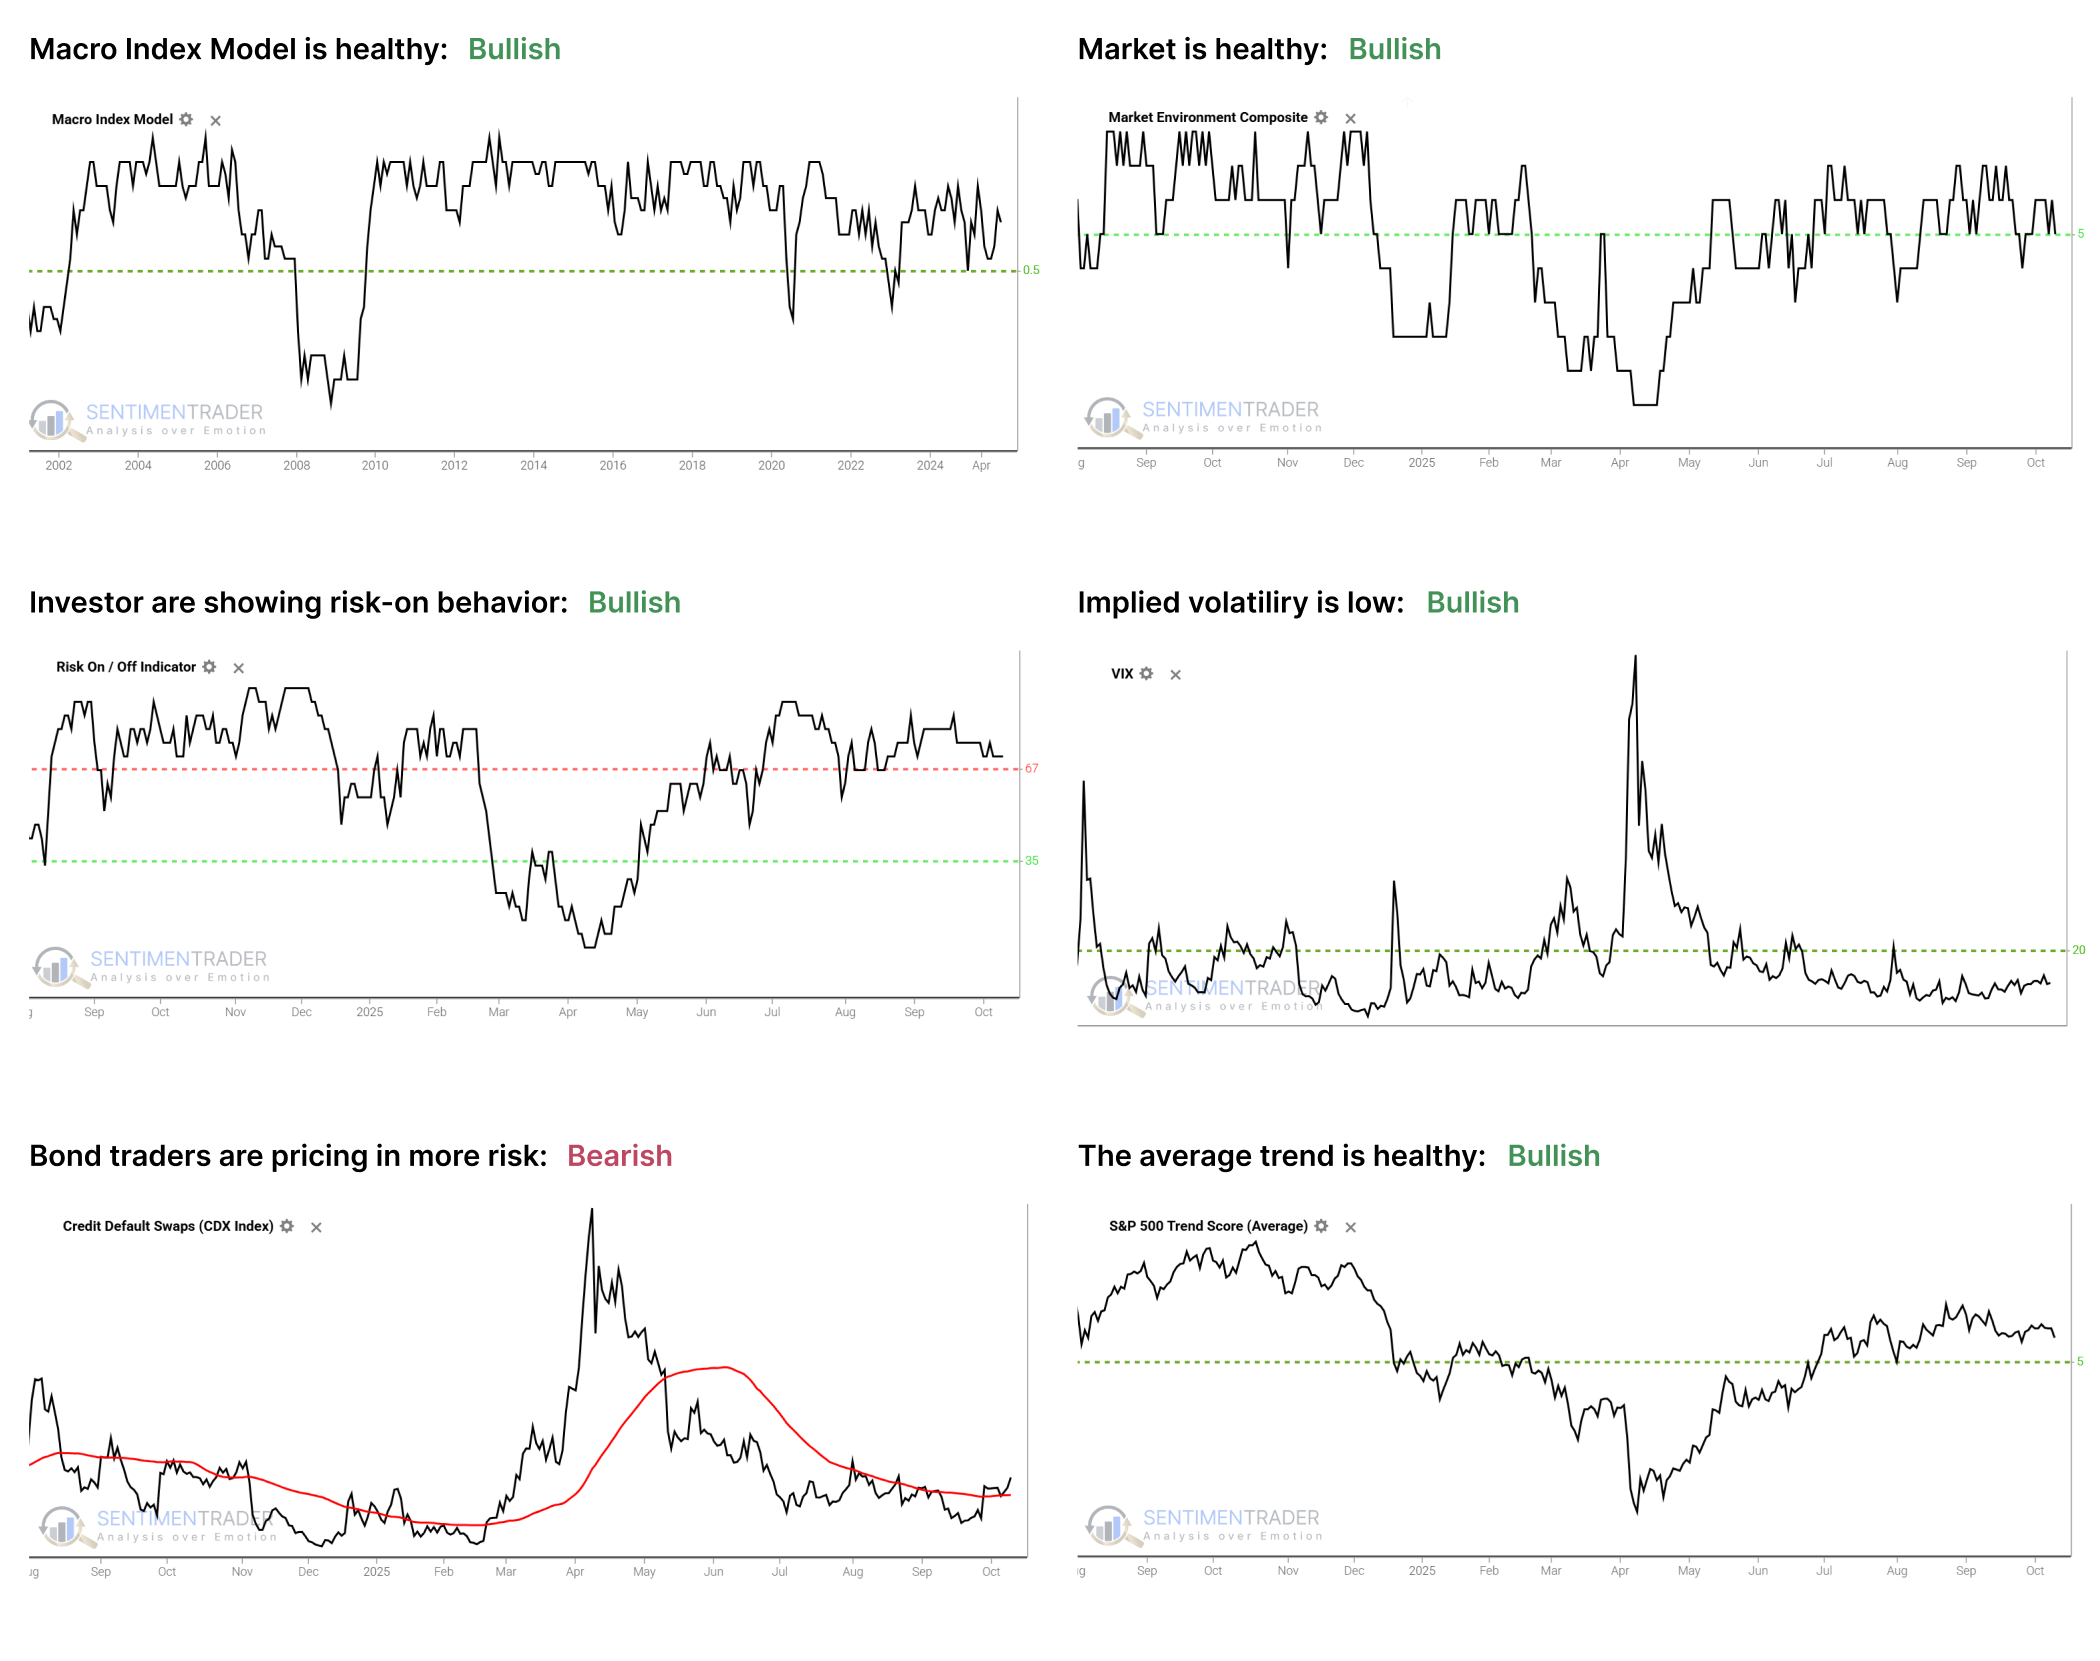
- The Macro Index Model is above the 50% threshold, which has been a vital level as outlined here.
- The Market Environment has been skittish since April, but is currently healthy. Future returns, especially for higher-beta indices, has been markedly better, with less risk, when the environment is healthy as outlined here.
- The Risk On / Off Indicator shows that investors are still in risk-on mode. This has been a good sign for future returns as outlined here.
- Implied volatility remains below 20, showing a calm environment. The S&P 500 has perfomed well when this is the case as outlined here.
- Credit default swap spreads are above their 50-day moving average, which is modestly concerning as outlined here.
- A composite of trend measures in SPY and the average S&P 500 stock remain above 5, which show healthy trend conditions.
Since April, the most compelling studies have had a strongly bullish bias on longer time frames. You can follow these through the Active Studies page. From time to time, when the analysts' studies provide an overwhelming message, it will override the charts above, but there has been no consensus in the studies to suggest overriding the bullish environment.
Other major markets have been mostly rangebound for four months, and there is little among what we follow to suggest a compelling edge either way.
University of Michigan Consumer Confidence Signals Historic Opportunities
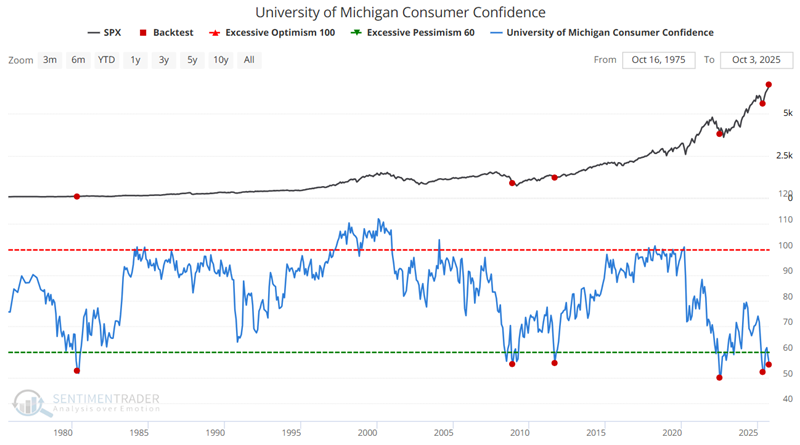
If you listen to a financial news talk show host discuss low consumer confidence, you will hear it in hushed tones, couched in ominous warnings of impending fear and loathing and tough times ahead. Of course, this entirely ignores the contrarian nature of investor and consumer sentiment.
The chart below highlights those rare occasions when the University of Michigan Consumer Confidence survey crossed below 56%. The most recent signal occurred on September 30th.
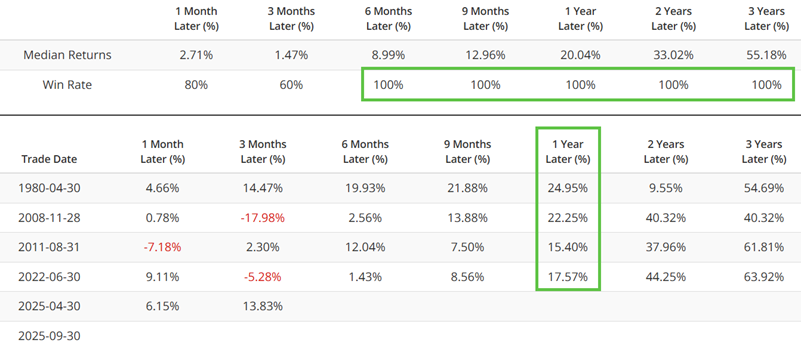
The table below quantifies the performance of the S&P 500 index following the signal dates highlighted in the chart above.
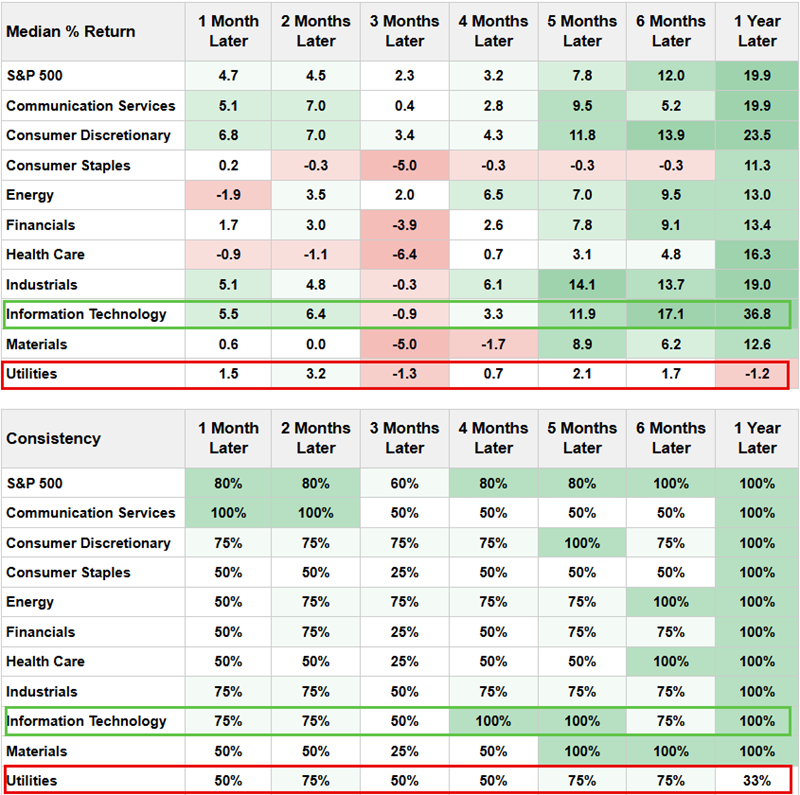
The table below displays performance for the various S&P 500 sectors following the signal dates. While much is to be gleaned, the most compelling item is the stark difference in performance between Technology (100% twelve-month Win Rate and 36.8% Median Return) and Utilities (33% twelve-month Win Rate and -1.2% Median Return).
University of Michigan Consumer Confidence has plunged (Bond buyers beware!)
Low consumer confidence readings raise the specter of a poor economy. Many expect an impending decline in economic growth to be accompanied by declining interest rates. Ergo, the conventional wisdom surrounding low consumer confidence is that bonds will perform well. How has this theory held up in reality?
The chart below highlights those rare occasions when the University of Michigan Consumer Confidence survey crossed below 56% with the thirty-year treasury bond futures contract as the relevant index. The most recent signal occurred on September 30th.
The table below quantifies the performance of thirty-year treasury bond futures following the signal dates highlighted in the chart above.
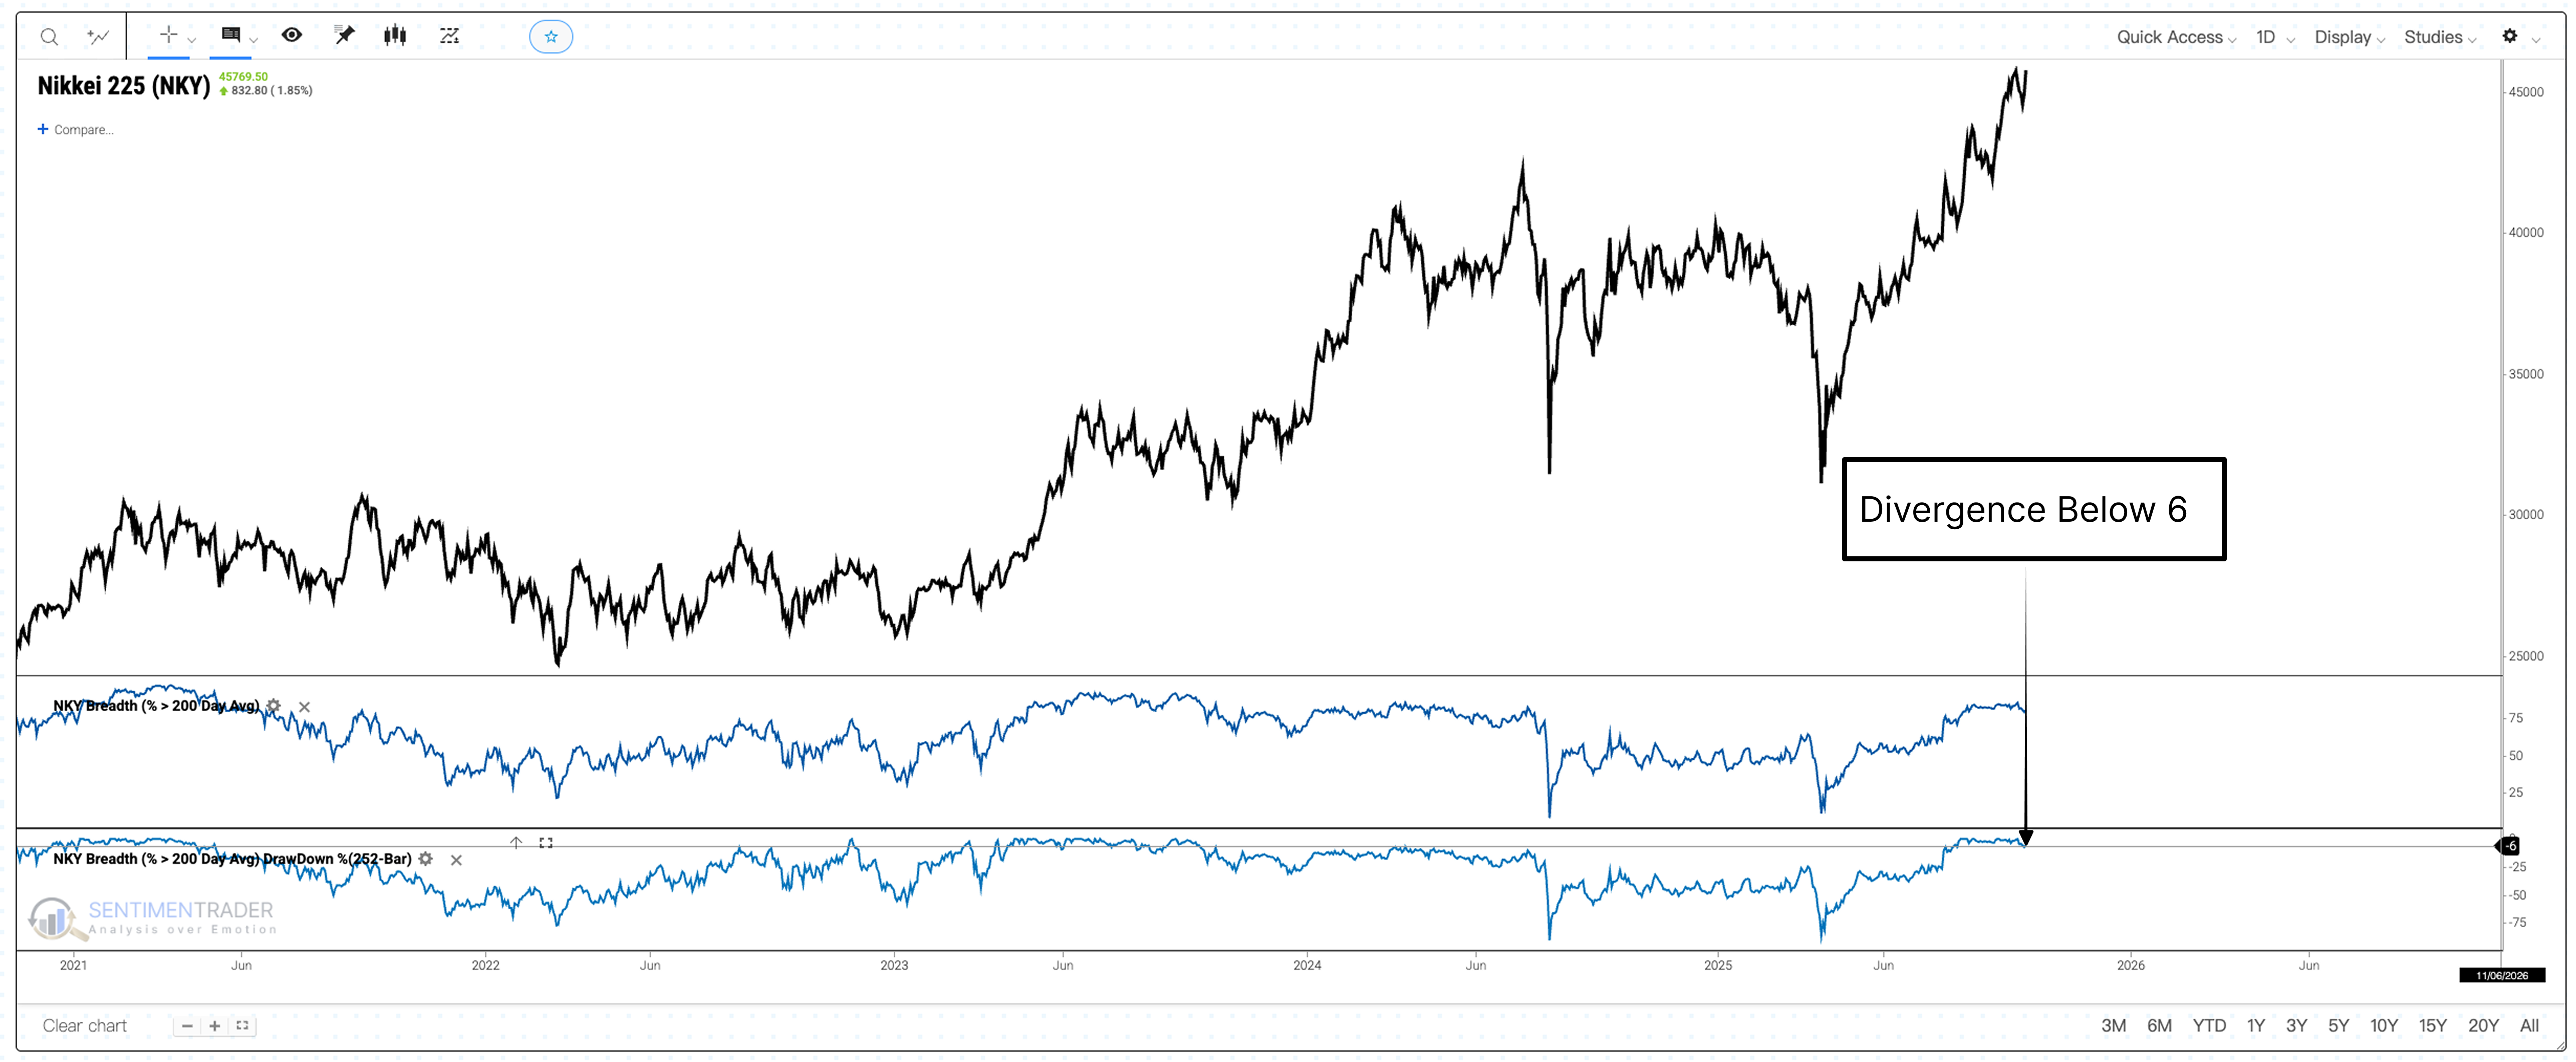
Nikkei's Strong Rally Shows Breadth Confirmation Amidst Calm Momentum
The Nikkei 225 Index is undoubtedly one of the focuses of the global market this year. The index's continuous breakthroughs mark the advent of a new phase, while also prompting investors to examine the classic question of \"whether the rally can be sustained.\"
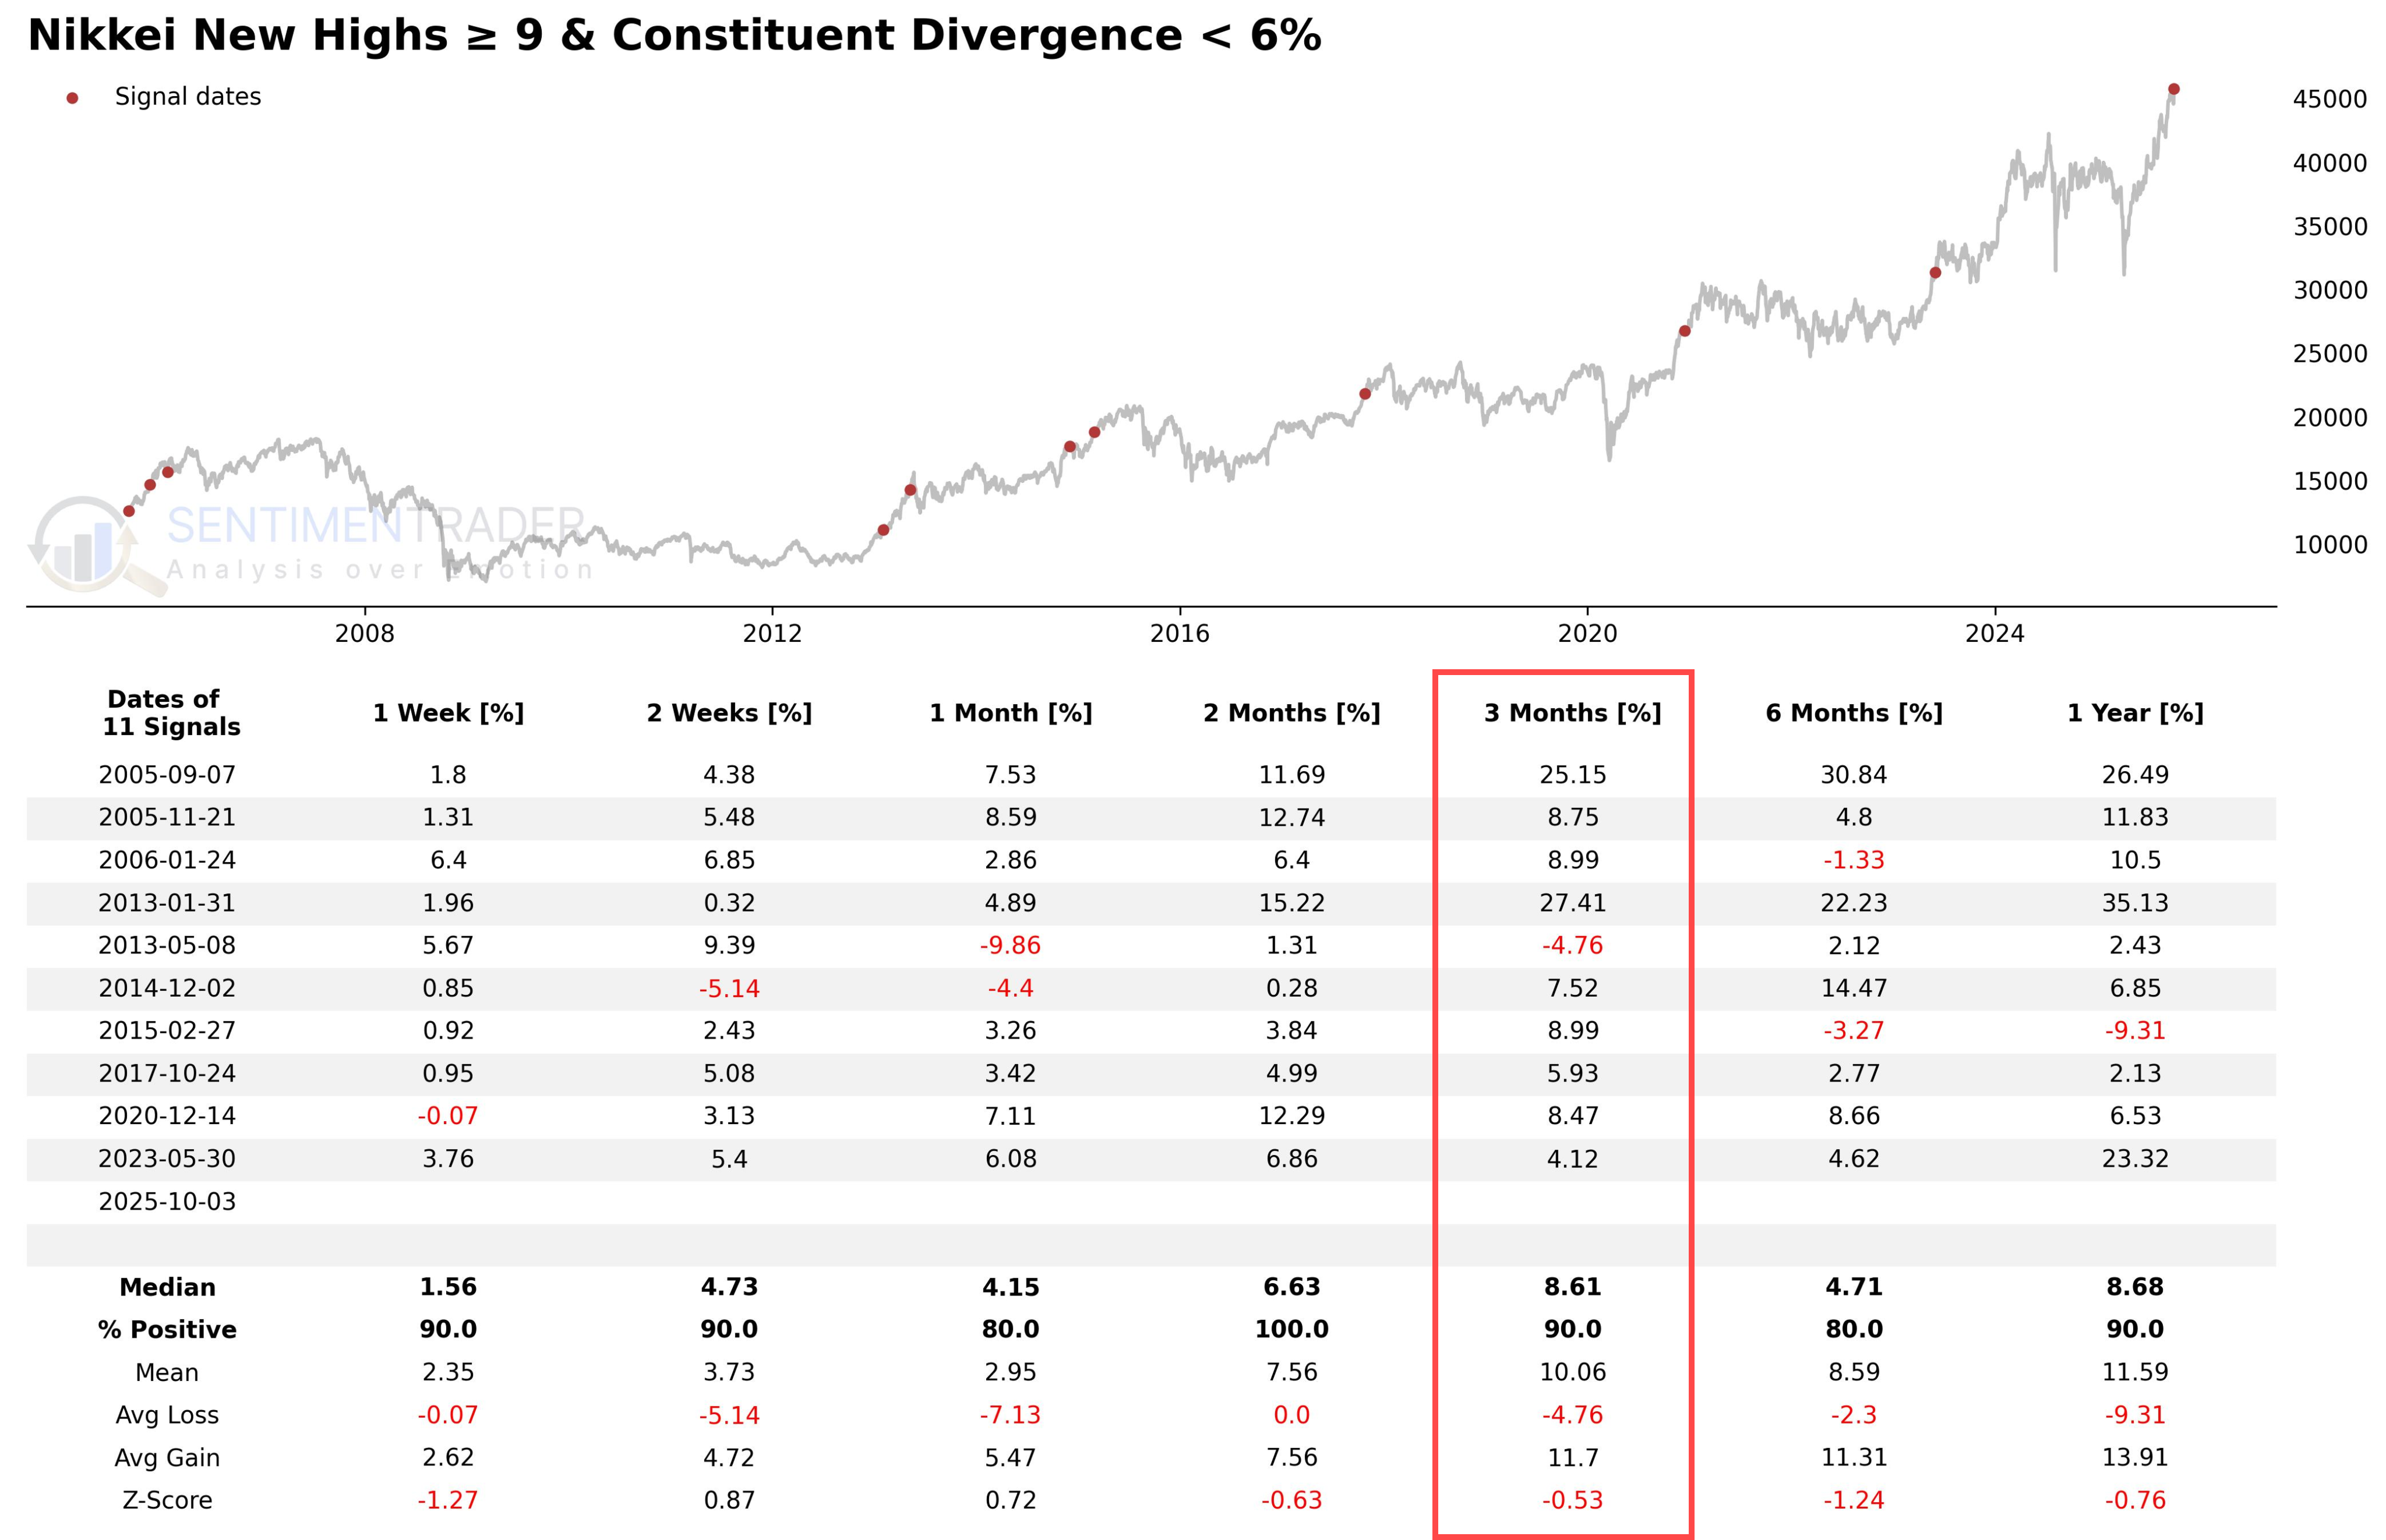
The table below shows past instances where the Nikkei Index recorded at least 9 days of 52-week highs within 21 trading days. This represents a strong upward force in the market.
Next, we added a second filter: only retaining periods with healthy upward NKY Breadth (% > 200 Day Avg) (i.e., the divergence degree of component stocks is below 6%). We refer to this as a \"breadth-confirmed trend.\"
The results showed a significant change: the win rate (% Positive) improved markedly across multiple time horizons, reaching a high of 90% after 3 months.
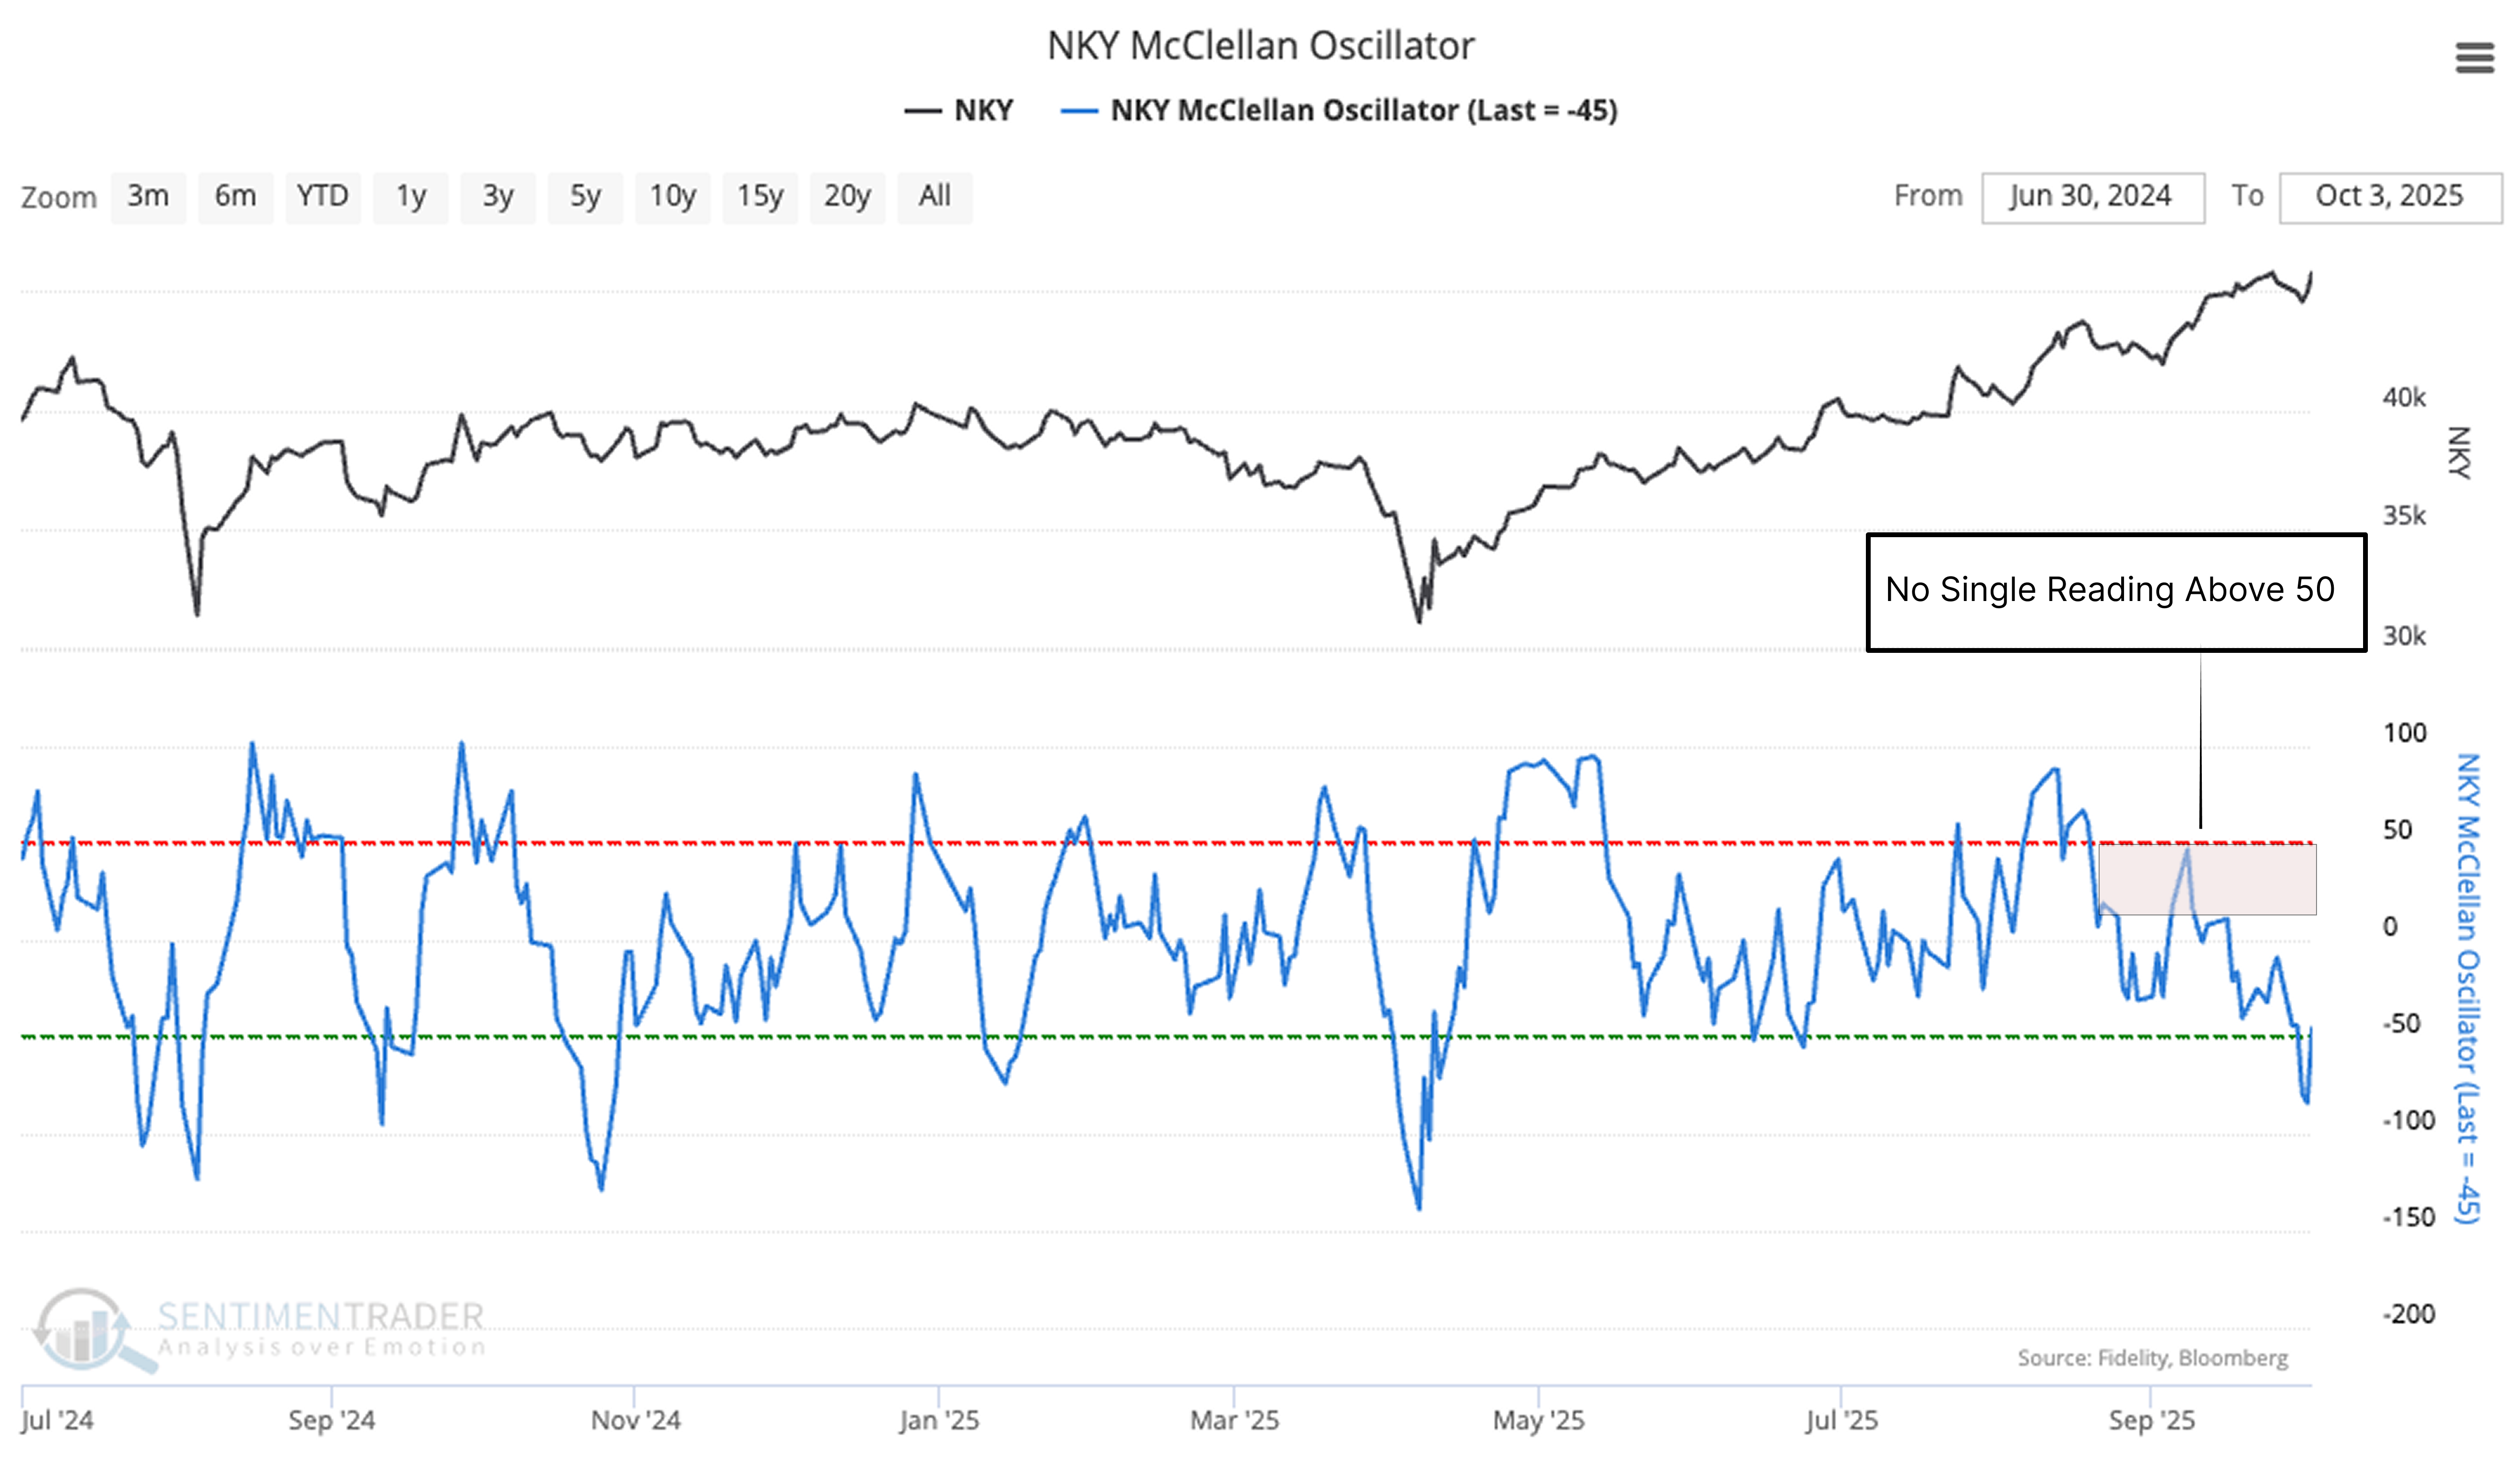
What is even more unusual is that amid the current strong and healthy rally, the market's internal momentum-measured by the NKY McClellan Oscillator (McOsc)-has remained unusually calm, never exceeding the +50 level.
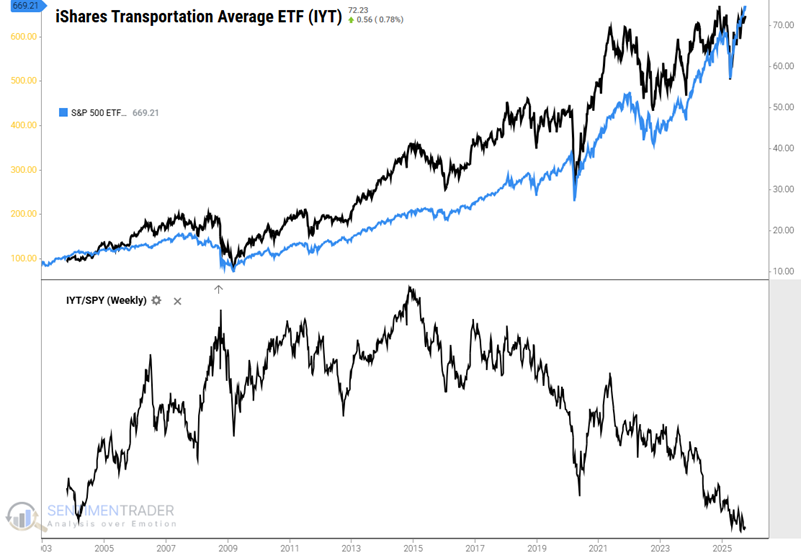
Transportation Stocks Enter Favorable Seasonal Period
The transportation sector has been a dreadful performer in the past year, both on an absolute and relative basis. The top clip below displays the performance of the iShares US Transportation ETF (IYT) in black and the SPDR S&P 500 Trust ETF (SPY) in blue. The bottom clip in the charts below depicts the performance of IYT relative to ticker SPY. The ratio has been in a virtually non-stop decline since late 2021.
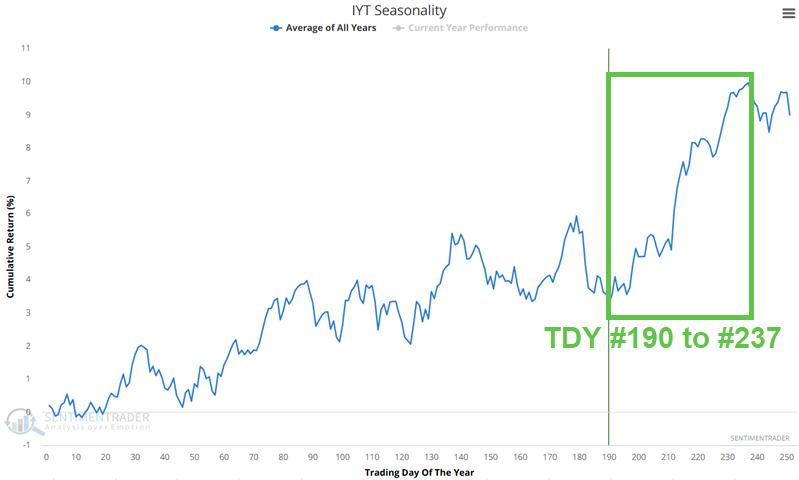
The Annual Seasonal Trend chart for the iShares US Transportation ETF (IYT) highlights a period that extends from Trading Day of the Year (TDY) #190 through TDY #237. For 2025, this period extends from October 6th through December 11th.
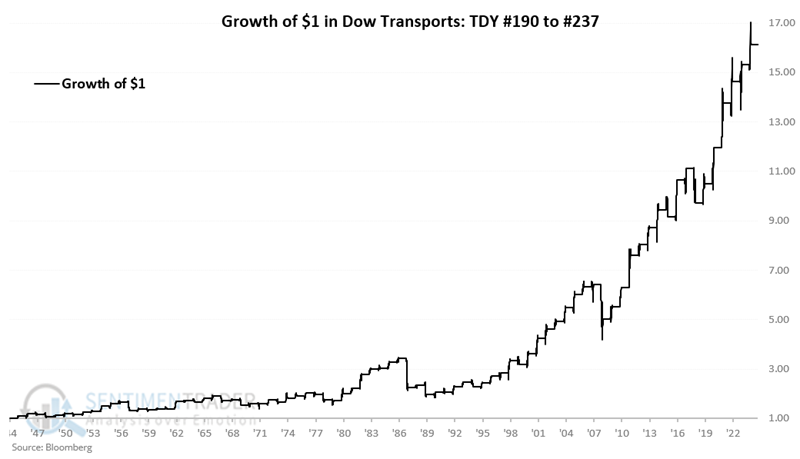
The chart below displays the hypothetical growth of $1 invested in the Dow Jones Transportation Average only during this period every year since 1945.
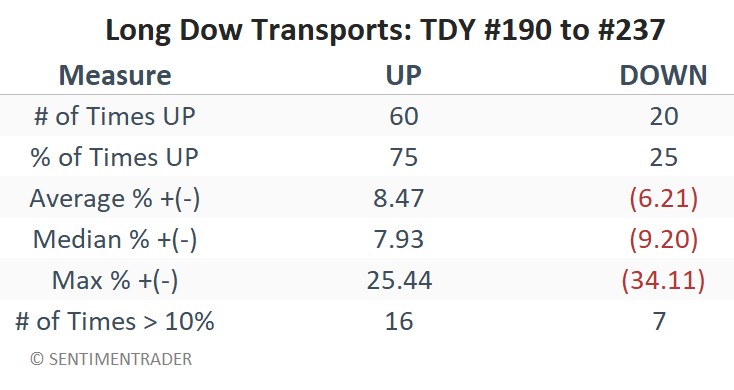
The table below summarizes the results.
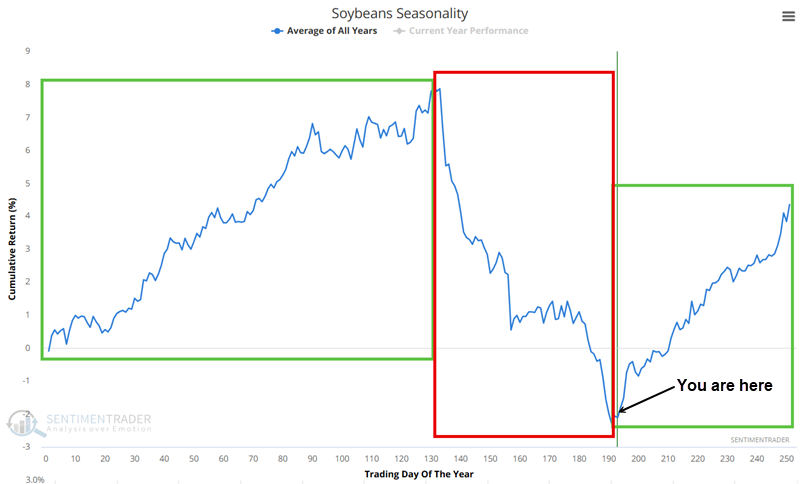
Soybeans Begin Bullish Seasonal Cycle
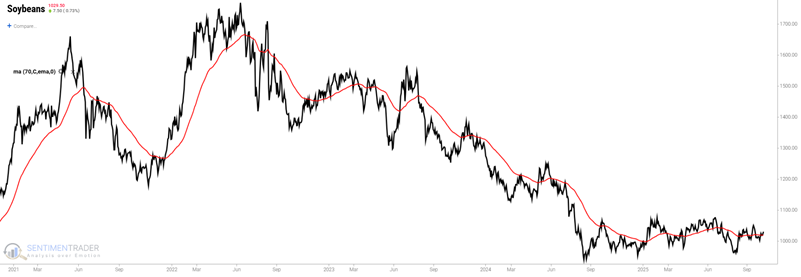
Soybeans trended lower between 2022 and 2024 for more than two years. Since bottoming in August 2024, they have been trending sideways in a relatively narrow range.
The chart below shows the annual seasonal trend for soybean futures. We can see that, in general, there is a bullish period and a bearish period. The bullish period starts at the close on Trading Day of the Year (TDY) #191 and extends through Trading Day #131 of the following year.
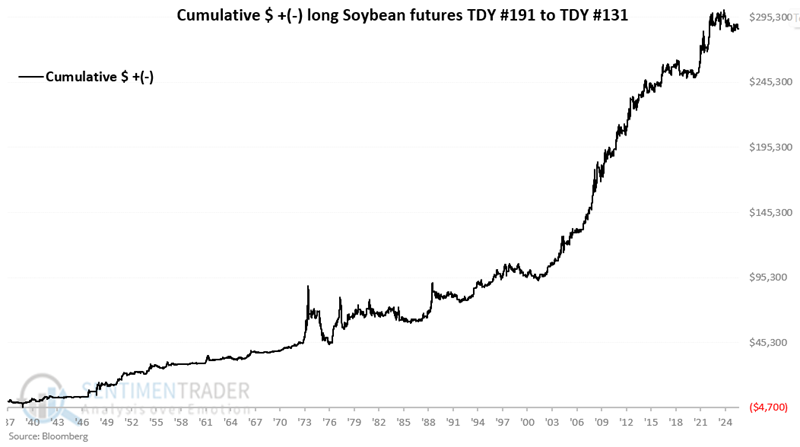
The chart below displays the hypothetical equity curve achieved by holding a long position in soybean futures from TDY #191 through #131 each year since 1937.
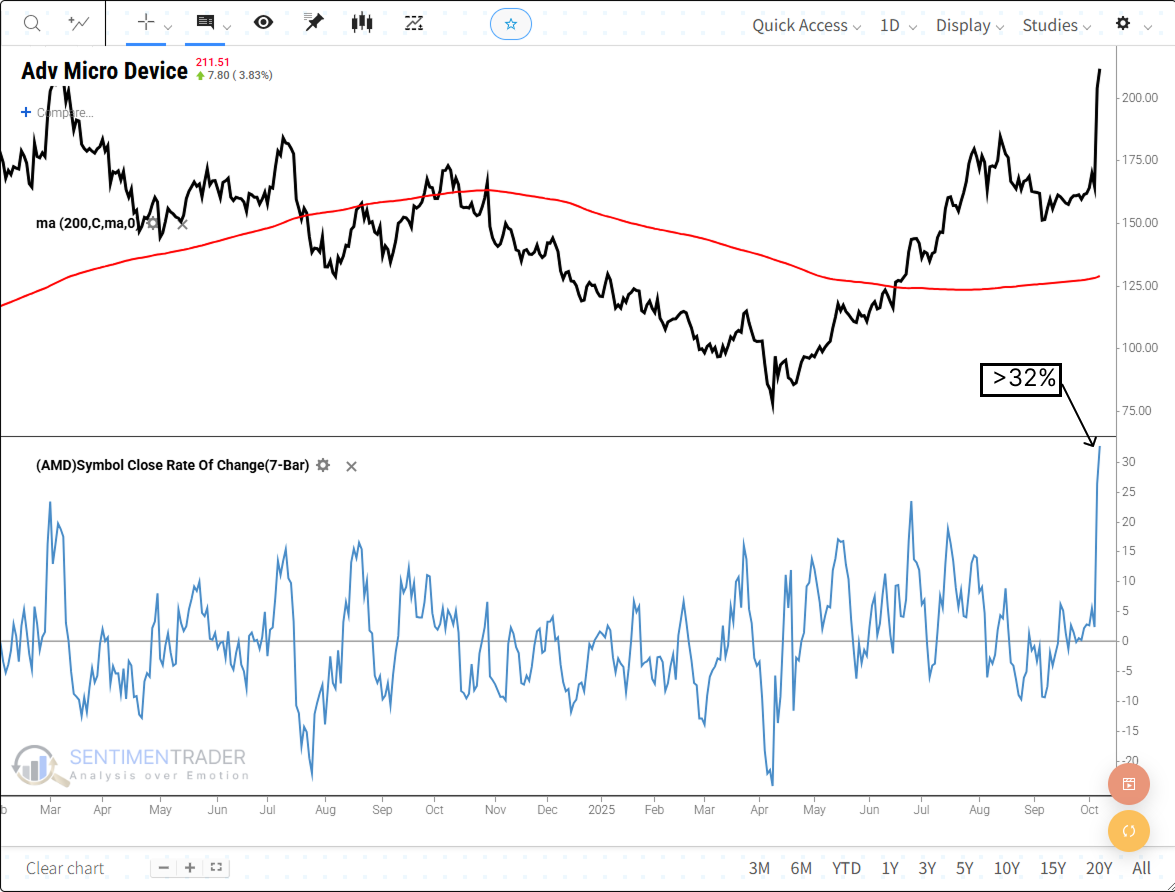
AMD is surging
AMD's price rally on October 6 was fueled by the announcement of a landmark strategic partnership with OpenAI. The multi-year agreement involves OpenAI deploying 6 gigawatts (GW) of AMD GPU computing power, a scale equivalent to powering millions of AI servers. The first 1 GW of AMD's latest MI450 series GPUs is scheduled to launch in the second half of 2026.
Notably, the deal includes an equity tie-up: AMD granted OpenAI warrants to purchase up to 160 million common shares (approximately 10% of AMD's outstanding stock), with vesting tied to milestones such as computing power deployment progress. This \"hardware + equity\" binding model, described by analysts as \"unprecedented in the semiconductor industry,\" is expected to generate tens of billions of dollars in revenue for AMD over the next decade.
Gold Bullish Narrative Clashes With Rare Exhaustion Signals
On the surface, gold's bullish logic has solid market recognition. Since 2025, gold prices have kept breaking key resistance levels, with the market viewing sustained long-term capital allocation as the core driver.
Historical backtests of this signal show clear differences: its short-term (1-3 months) support is unstable, with a median return of -1.3% and 50% positive returns-meaning capital inflows can't fully avoid short-term volatility. But in the medium-to-long term (5+ months), the signal's positive bias emerges: 5-month median return rises to 8.3%, 1-year positive returns hit 67%, and average profits exceed potential losses.
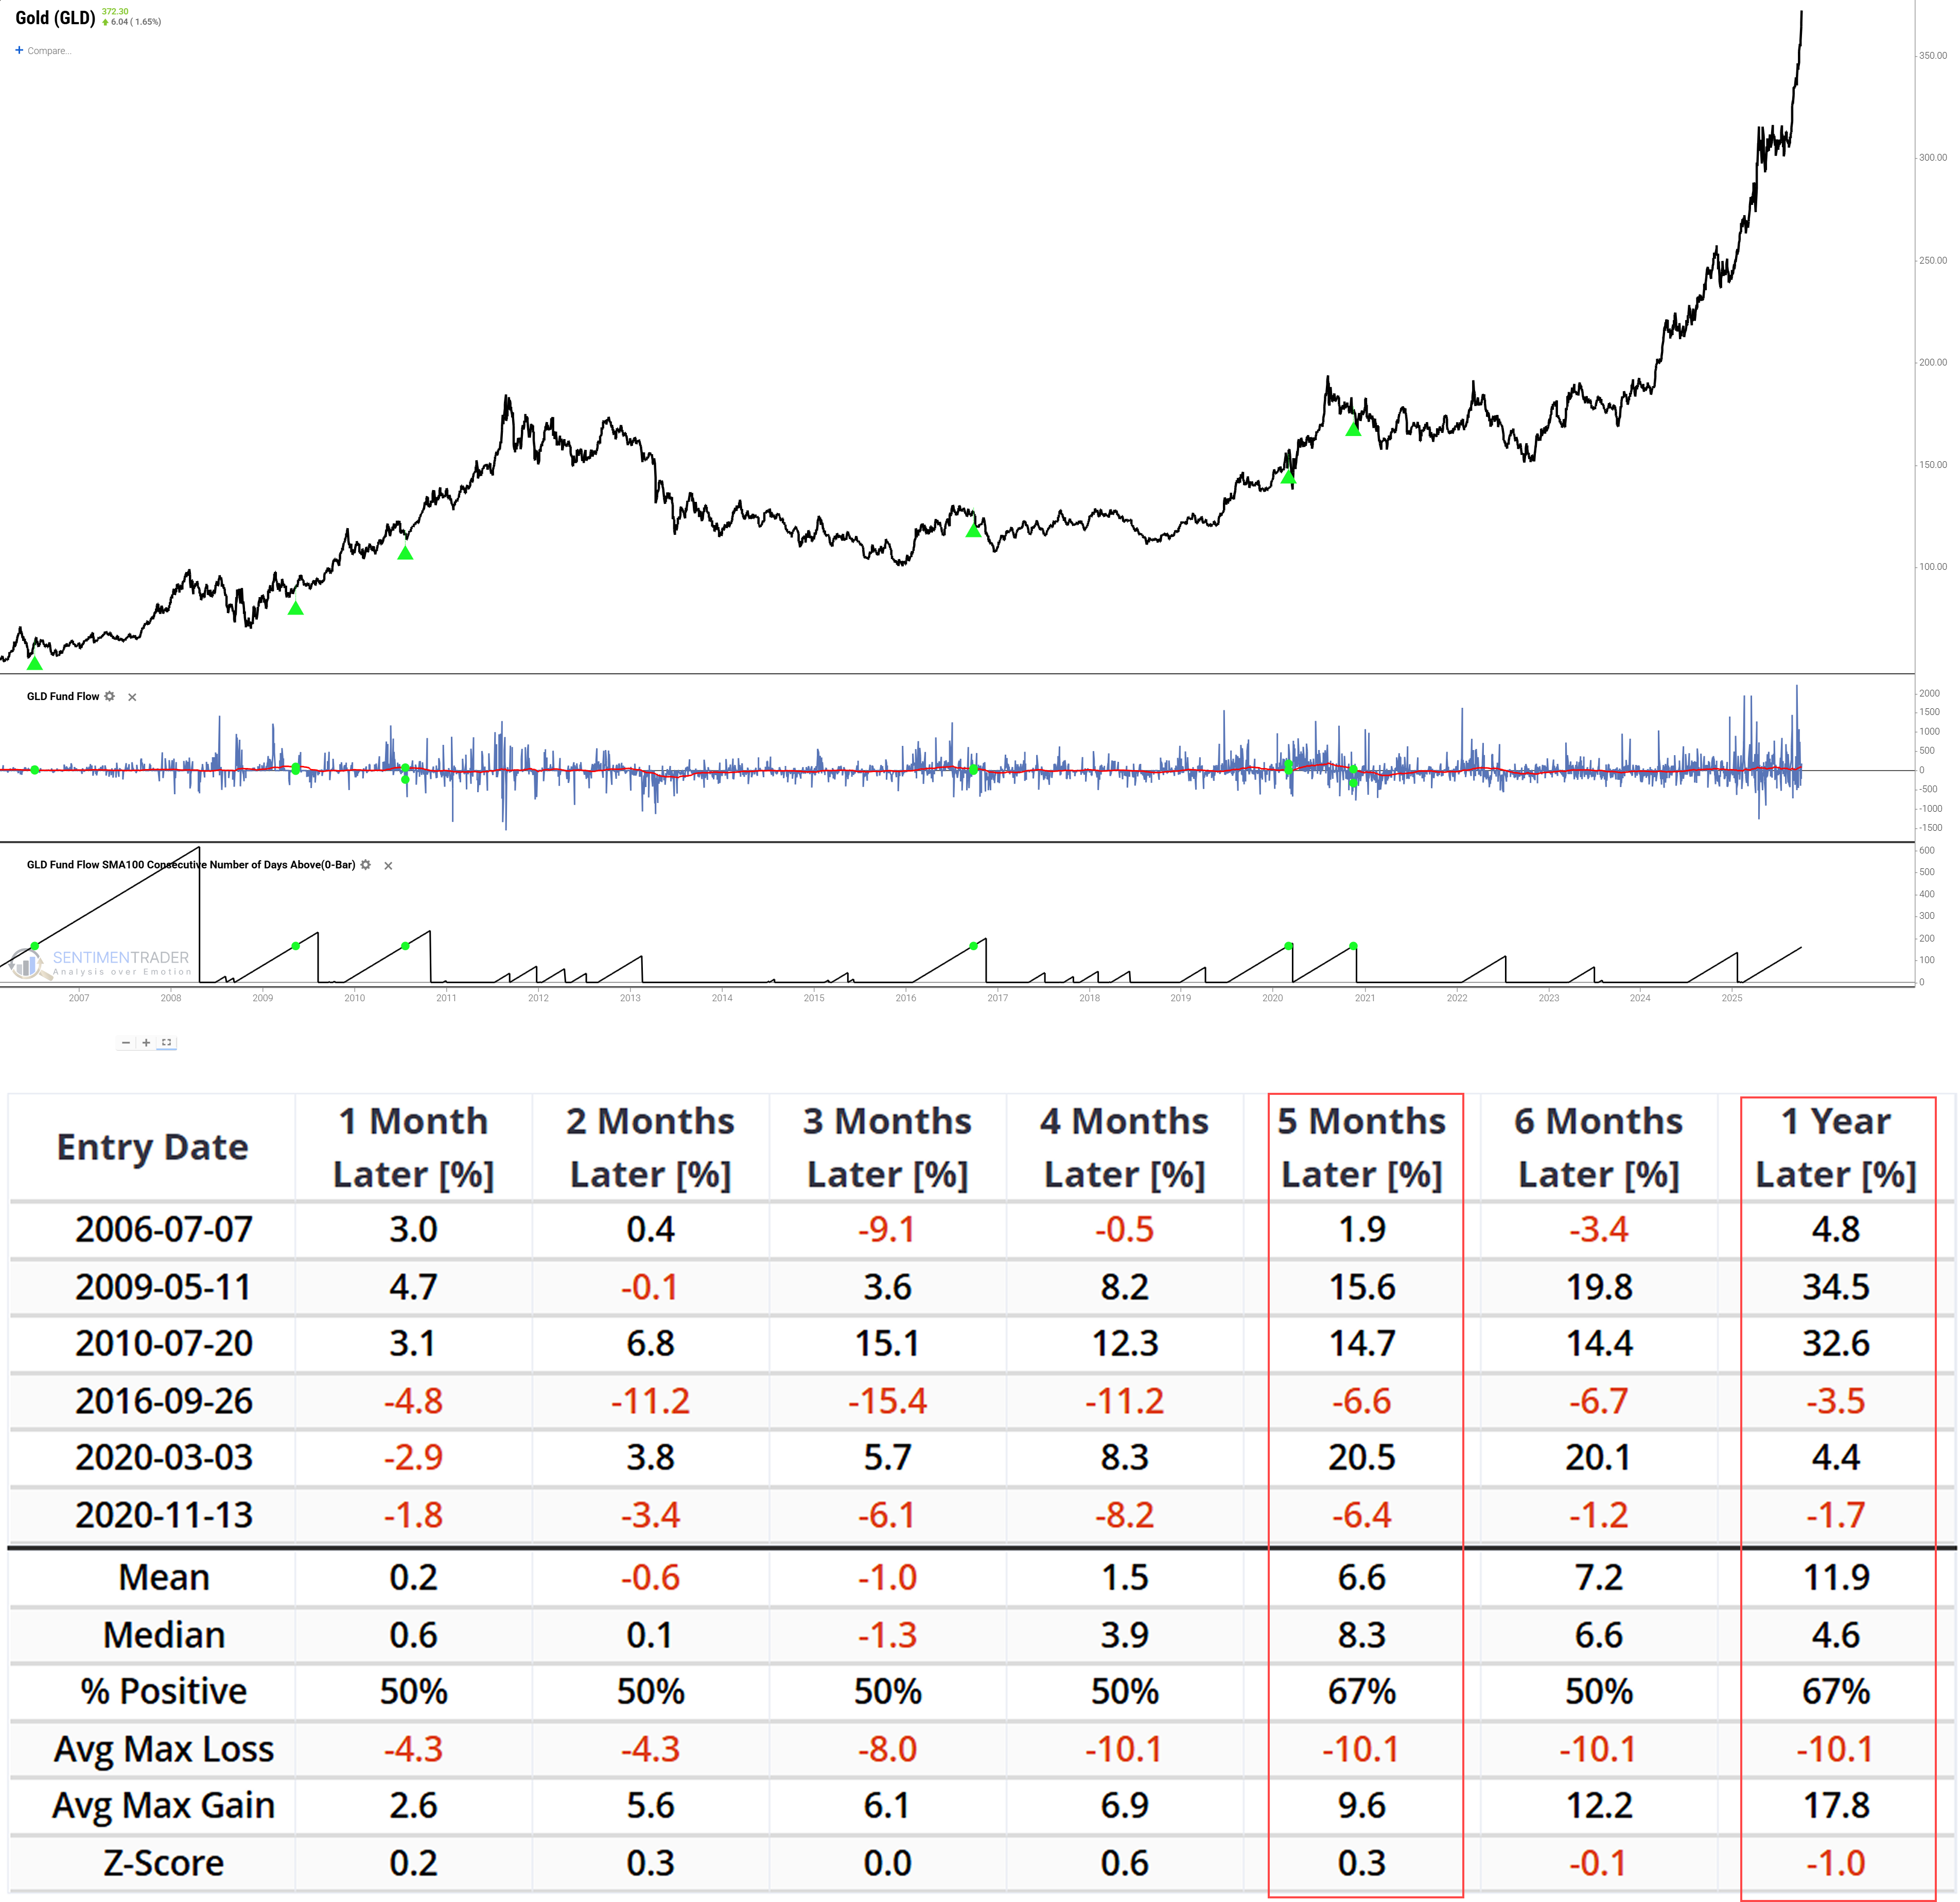
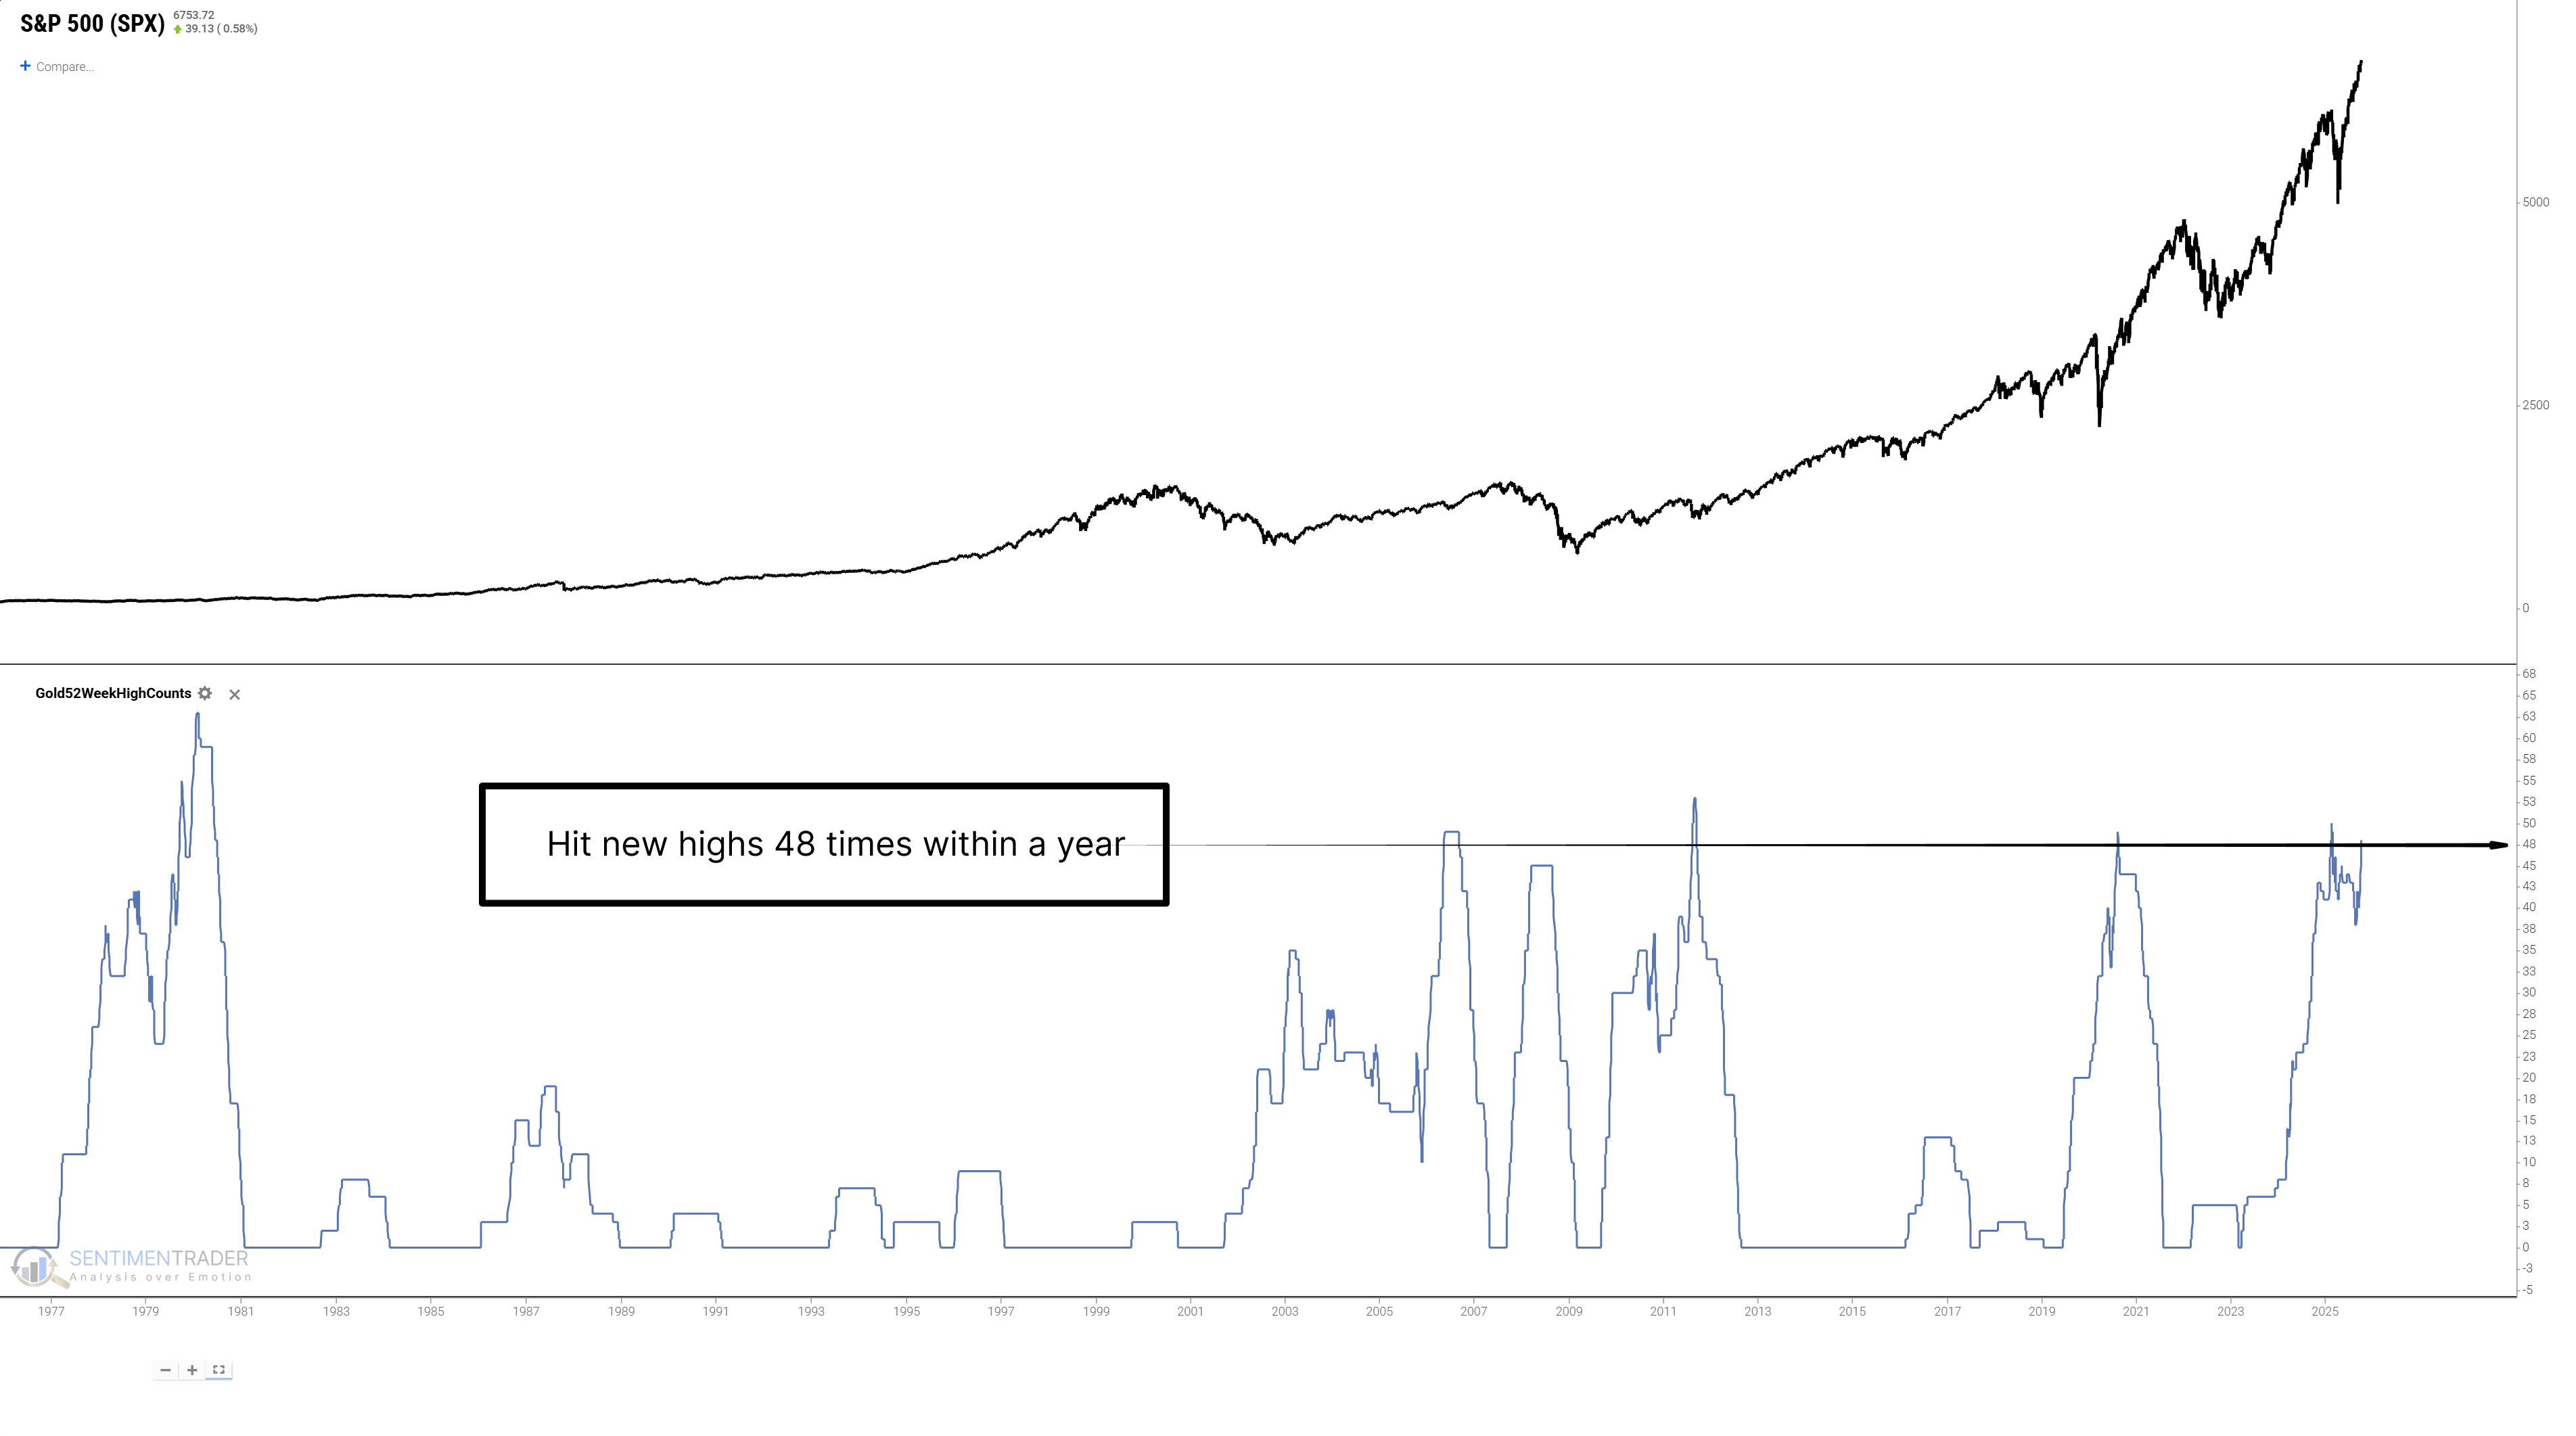
The market's contradiction starts with warnings from gold price behavior. When gold hits a specific number of 52-week highs in a year, this rare signal has high historical reference value-since the 1970s, it has triggered only 5 times, and almost always points to cyclical peaks except in special macro scenarios.
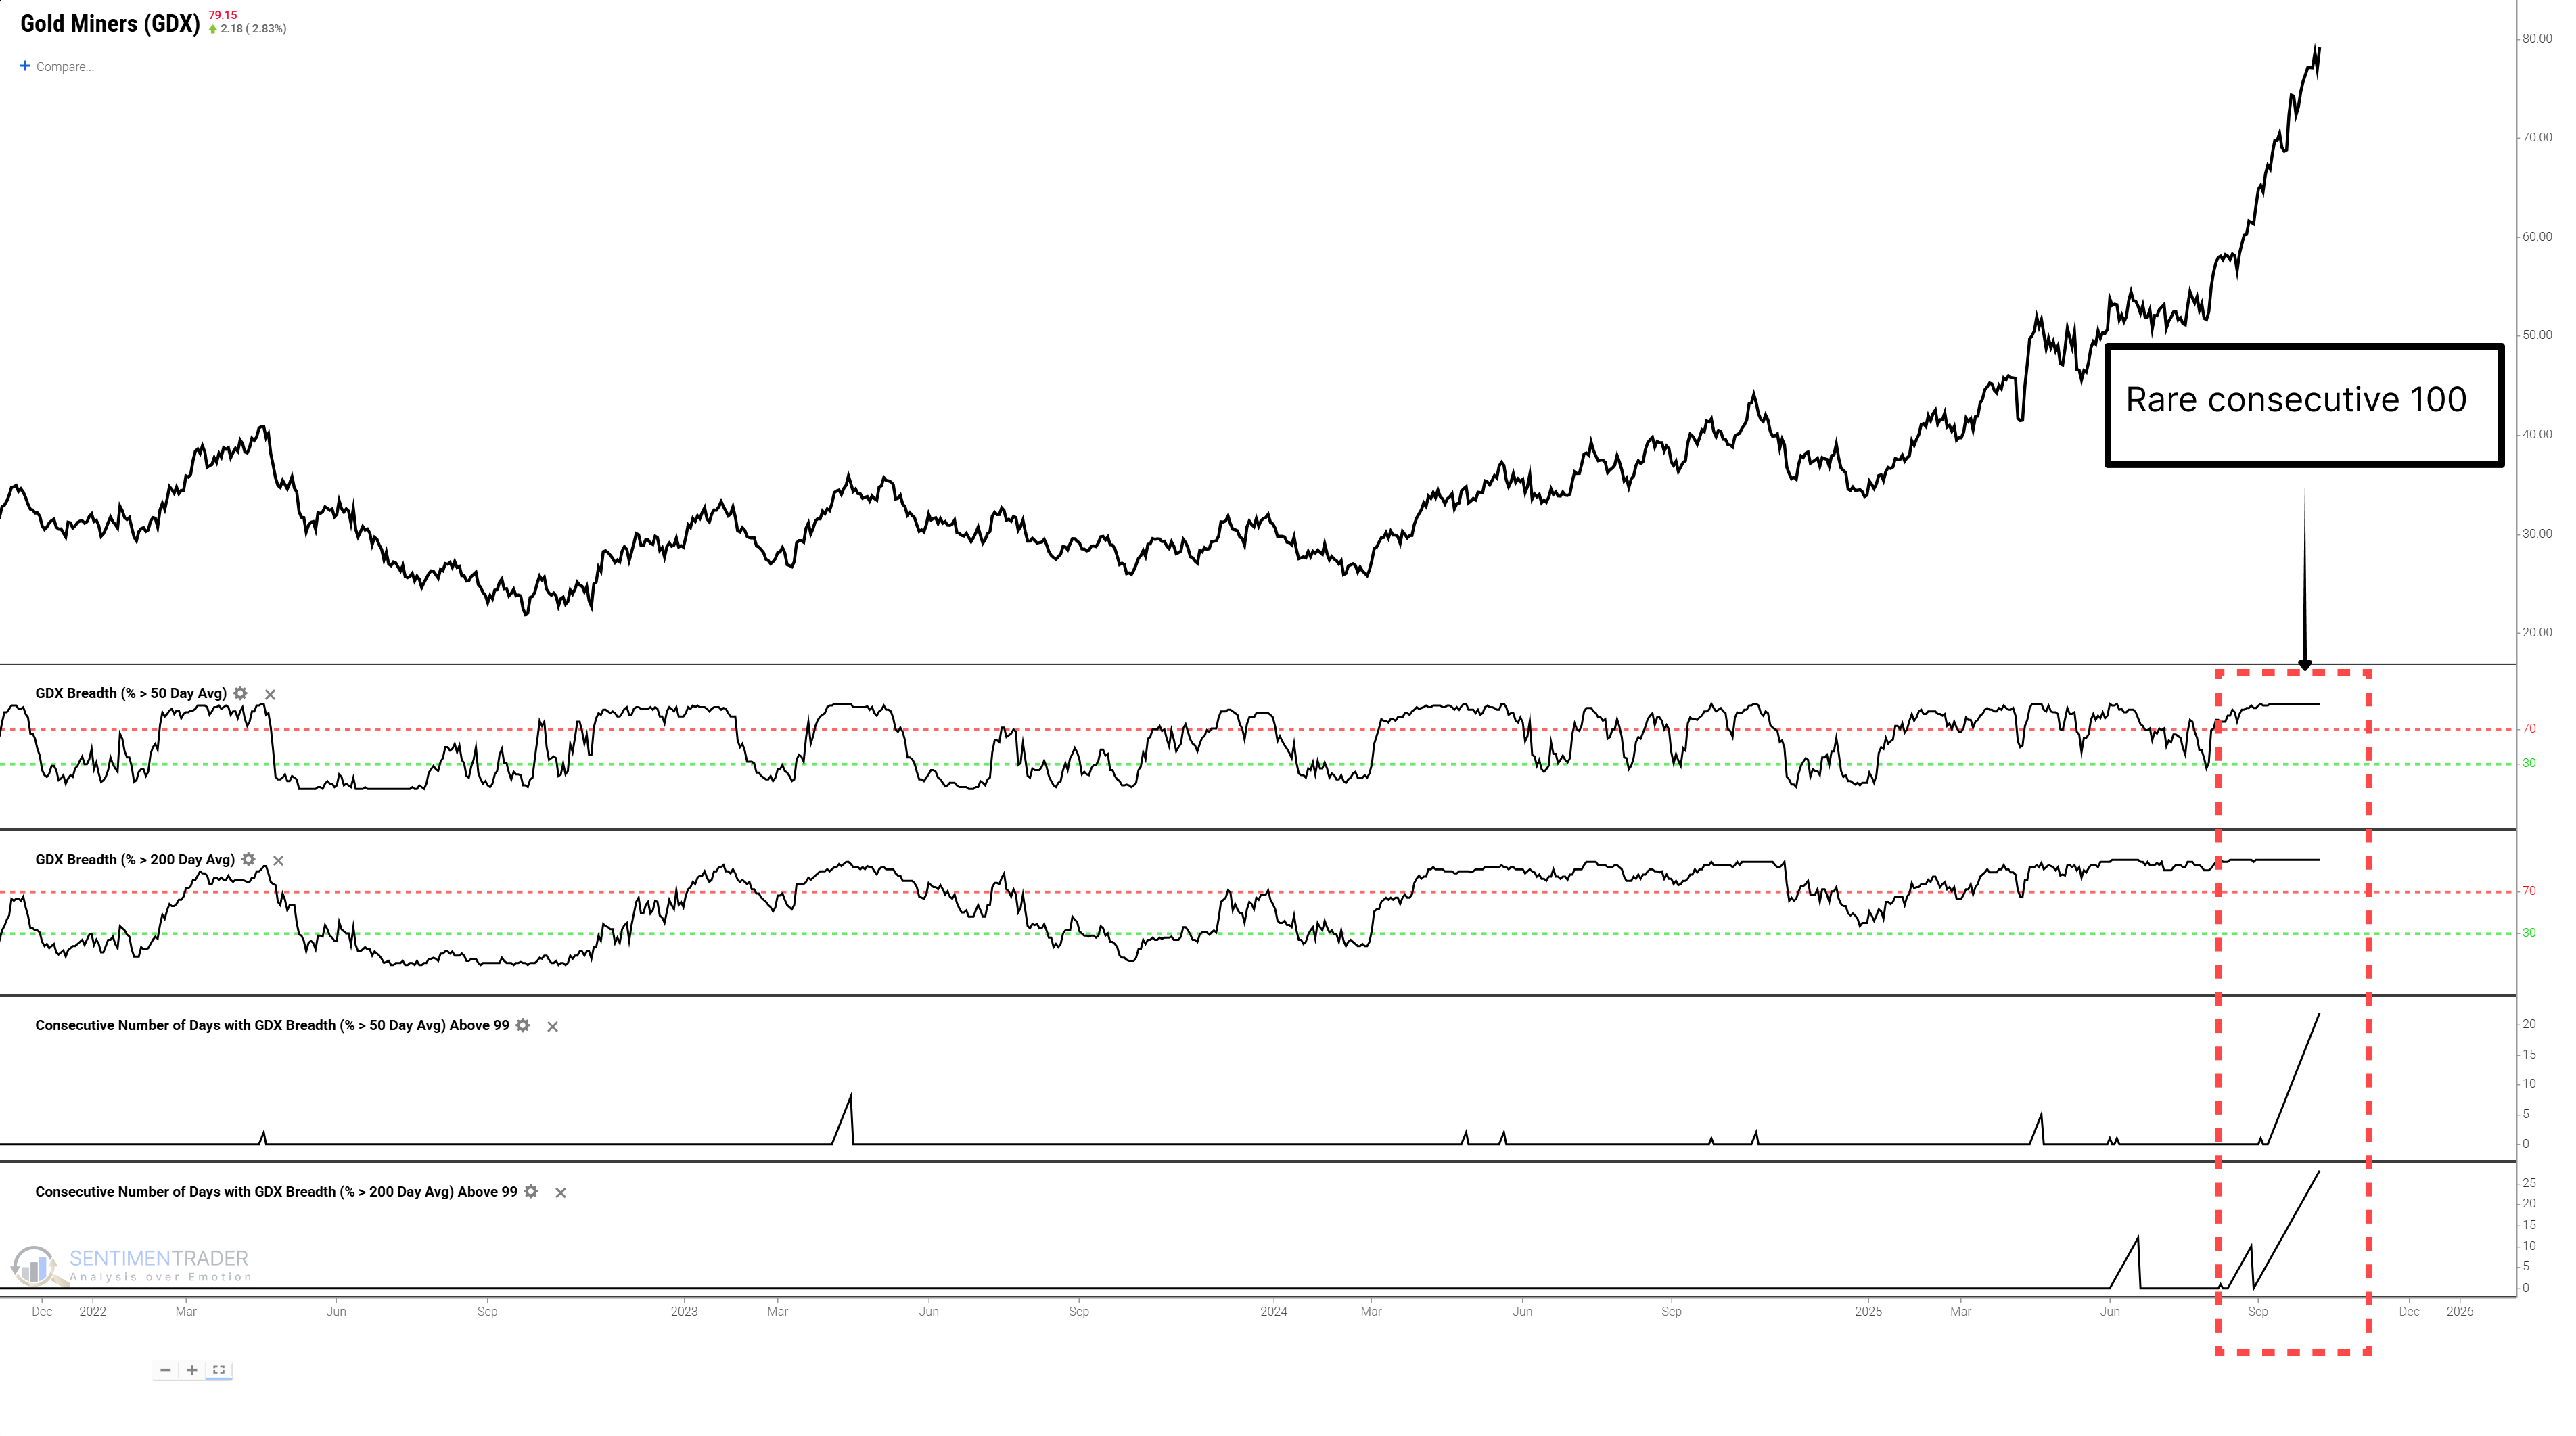
The key to understanding current market fragility lies in gold miners (GDX)-the \"speculative engine\" of the gold industry chain. As a gold market leading indicator, GDX's sector breadth has reached unprecedented extremes.
About TradingEdge Weekly...
The goal of TradingEdge Weekly is to summarize some of the research published to SentimenTrader over the past week. Sometimes there is a lot to digest, and this summary highlights the highest conviction or most compelling ideas we discussed. This is NOT the published research; rather, it pulls out some of the most relevant parts. It includes links to the published research for convenience, and if you don't subscribe to those products, it will present the options for access.