
TradingEdge Weekly for Nov 7 - Natural gas transition, sector strength, market warnings, dollar rally

Key points:
- The view on stocks is modestly bearish short-term (1-4 weeks) due to rising volatility (VIX) and deteriorating market participation (poor breadth). However, the long-term (6-12 month) outlook remains bullish, supported by fundamentals like AI innovation and capital investment.
- Despite major indexes remaining near highs, numerous internal warning signs (including Hindenburg and Titanic signals) are flashing. Market breadth is extremely poor, indicating the rally is being propped up by only a handful of mega-cap stocks.
- Despite the warnings, historical seasonal trends point to potential strength in the Consumer Discretionary (XLY) and Health Care (XLV) sectors in the coming weeks. Natural Gas is showing signs of a potential base breakout, though related stocks are lagging.
House View:
Stocks:
- Short-term: Modestly bearish. This week, the VIX volatility index rose, reversing the previous trend of growing market complacency. As valuations in the technology sector continue to climb, market anxiety has resurfaced. While the Nasdaq Composite managed a weekly gain on select earnings beats, the rally was uneven: a majority of index constituents declined, and speculative names faced sharp pullbacks. Breadth metrics deteriorated, with the advance-decline line retreating from recent peaks, signaling narrowing market participation. This time frame covers 1 - 4 weeks.
- Intermediate-term: No view. The market faces conflicting forces: robust earnings results clash with historically elevated valuations and concerns about policy uncertainty. While recent Fed rate cuts provide liquidity support, speculative positioning in tech remains near extremes, and geopolitical risks add to the ambiguity. This tug-of-war between earnings strength and valuation risks leaves the intermediate-term outlook unclear. This time frame covers 1-5 months.
- Long-term: Bullish. Short-term pullbacks, even when sharp, do not undermine the structural drivers of the long-term uptrend-including the productivity boost from AI innovation and expanding capital investment across sectors. Economically sensitive sectors still show underlying strength, and the market's ability to sustain multi-month gains before this week's correction reinforces its resilience. This time frame covers 6-12 months.
- Cyclical momentum continues to favor sectors like financials and industrials, which are less vulnerable to tech valuation swings.
- Defensive sectors have started to regain appeal in the short term but remain secondary to growth-focused areas over the long haul.
- Very long-term trends still point to mean reversion, with small-caps and undervalued segments poised to catch up as the rally broadens beyond large tech.
Bonds: Long-term cycles remain bearish. Despite short-term safe-haven demand from equity market volatility, long-duration assets stayed under pressure as the Fed's "higher-for-longer" stance dominated market sentiment. Seasonal tailwinds typically seen in late autumn failed to materialize, and cyclical indicators reinforce the bearish bias for bonds.
Commodities: Selective opportunities persist in a mixed landscape, with an effective commodity trend model signaling a cautiously constructive bias. Gold held near recent highs as investors sought safety amid market volatility, while oil faced headwinds from seasonal demand weakness and inventory surges. Speculative positioning extremes in oil suggest limited downside, but near-term trends remain cautious.
- Crypto: We follow several simple systems for bitcoin, which we consider the equivalent of the S&P 500 for crypto. Due to bitcoin's explosive growth over long periods, it's dangerous to equate neutral conditions with being bearish for some of these. However, if a system is "out," we consider it bearish for this summary.
- Triple 40: Bearish
- RSI Momentum: Bullish → Bearish
- Trend and Relative Trend: Bearish
- PMI: Bearish
- M2 ROC: Bullish
Where we're at
Most investors have the most riding on equities. We feel that the most significant determinants of success for investors are whether to adjust their allocation to that asset class based on factors that have historically had a good record of preceding above- or below-random returns in the months ahead.
Those factors include the probability of a looming recession, sentiment, price action, volatility, breadth, and the bond market. The chart below summarizes the main indicators and composite models we watch for those factors, and they're mostly in bullish regimes. Valuations are not part of these factors since the relationship has been too inconsistent on time frames under one year.
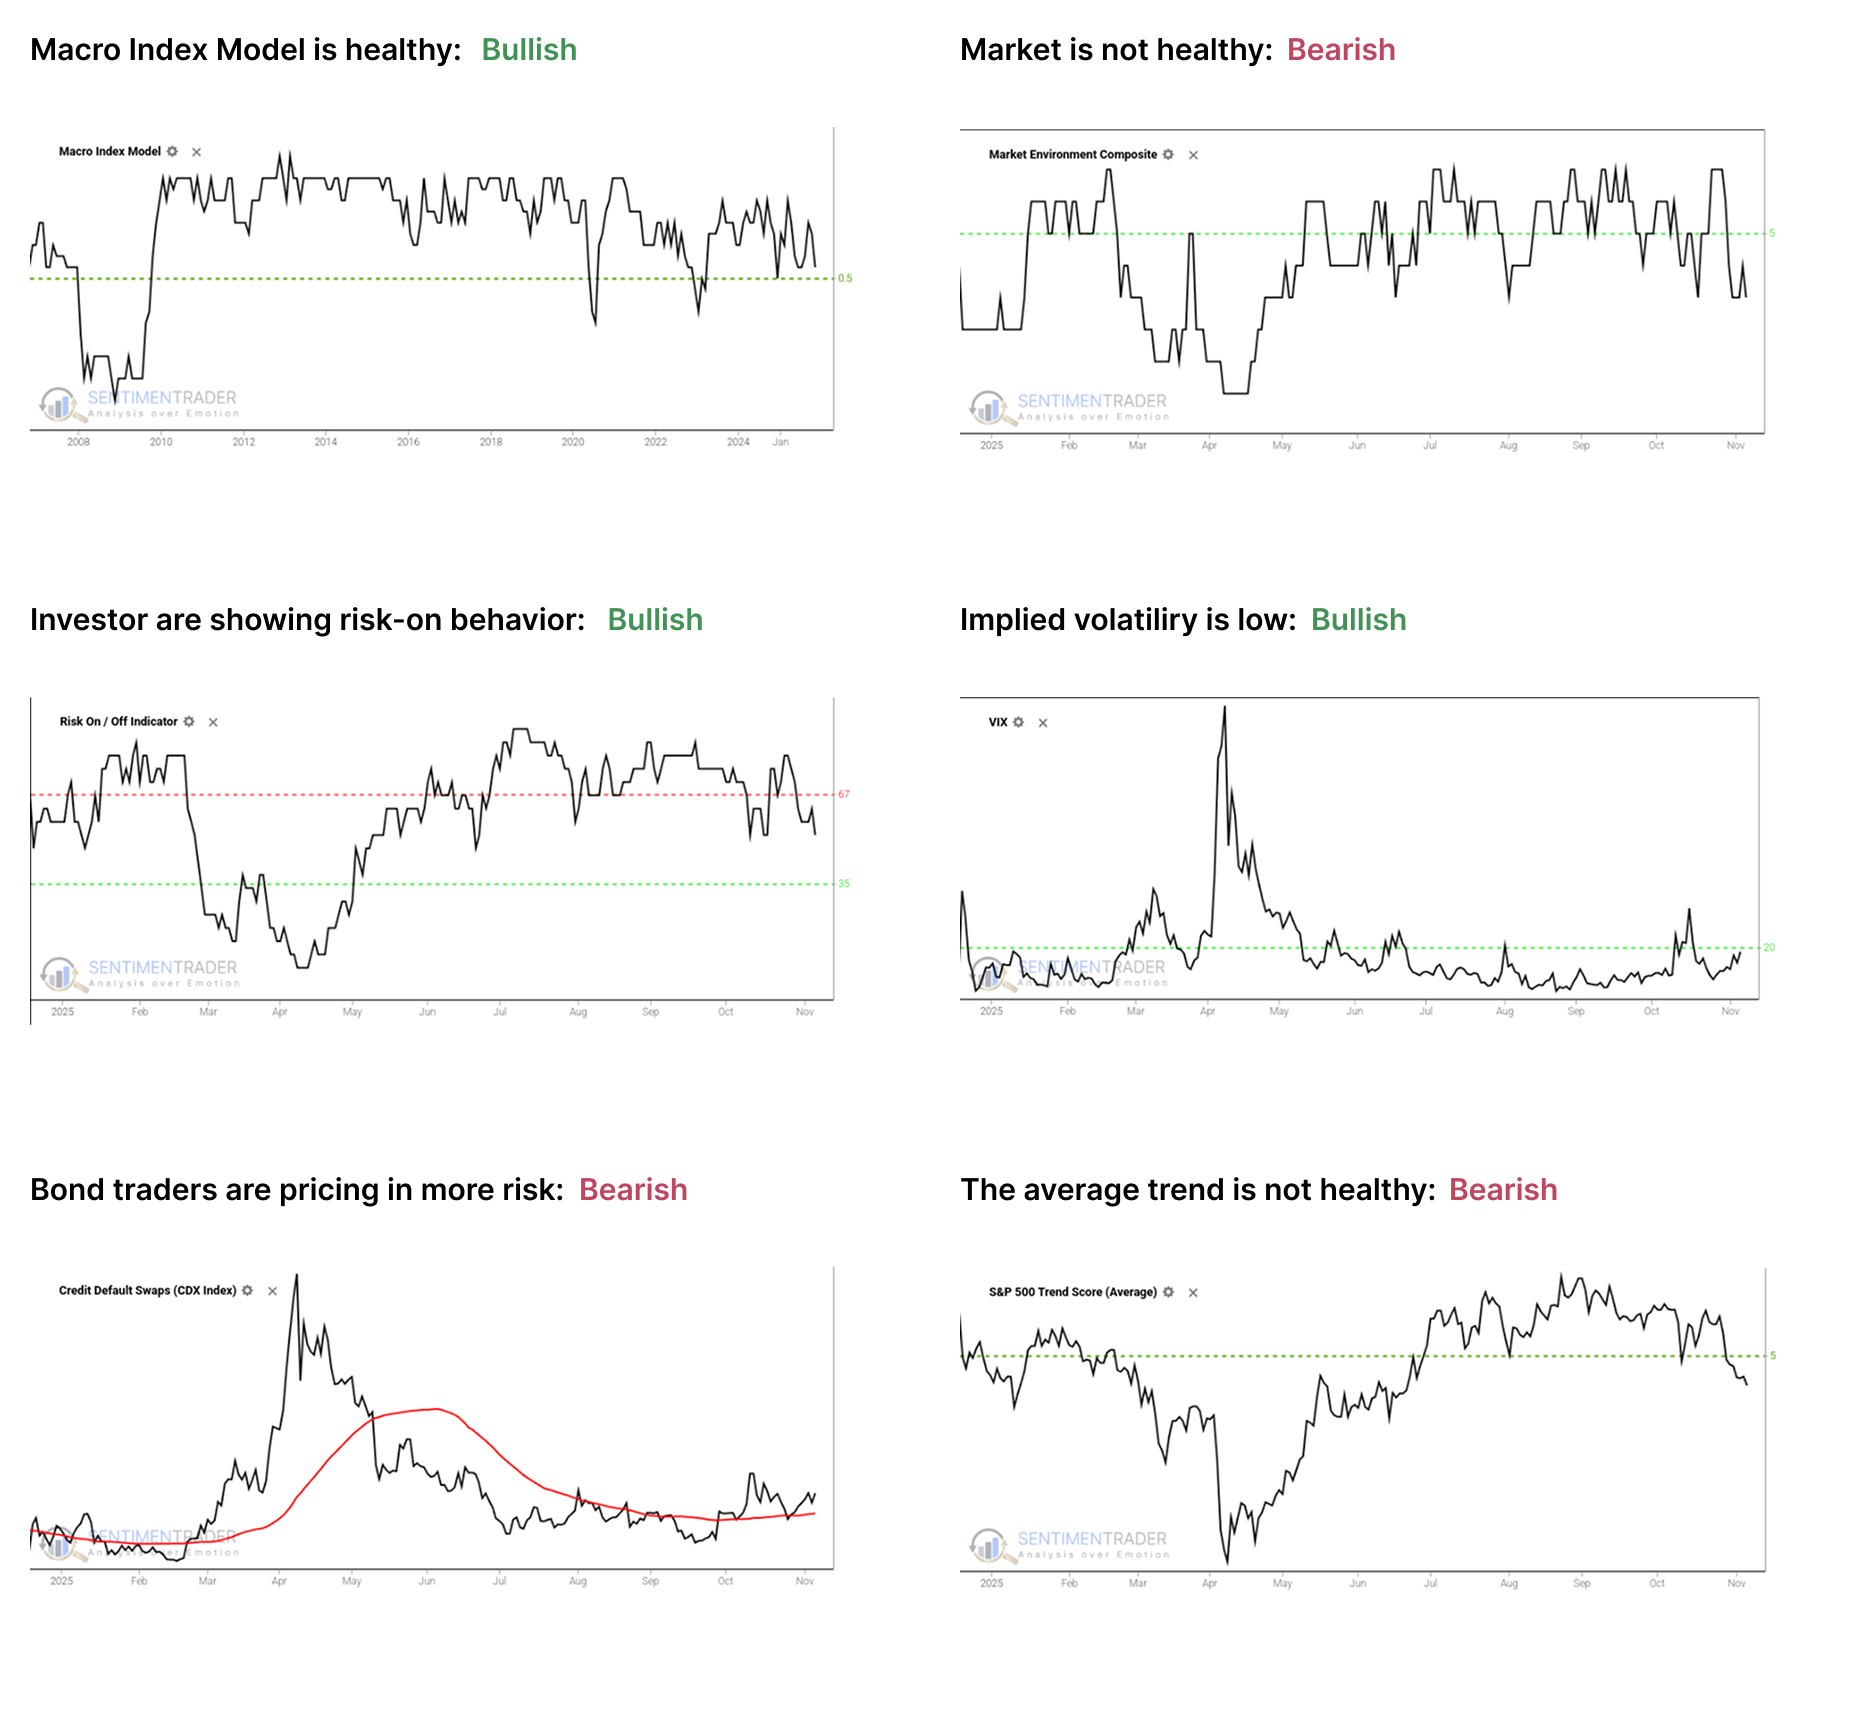
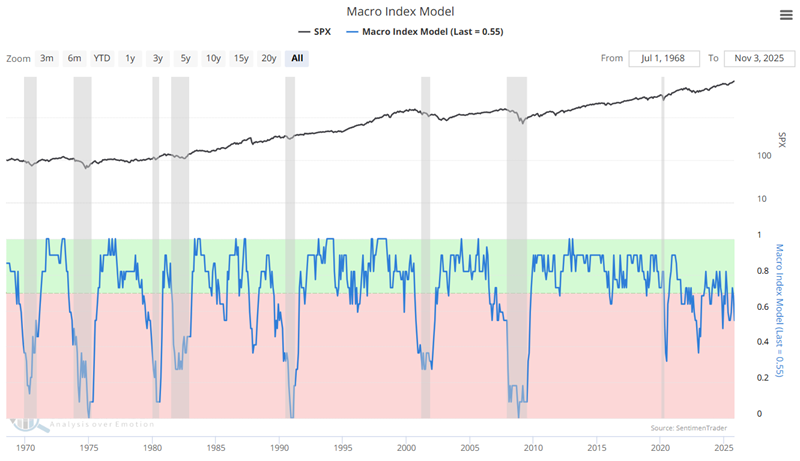
- The Macro Index Model is above the 50% threshold, which has been a vital level as outlined here.
- The Market Environment has been skittish since April, and has slipped into an unhealthy condition. Future returns, especially for higher-beta indices, have historically been notably weaker, with greater risk, when the environment is unhealthy as outlined here.
- The Risk On / Off Indicator shows that investors are still in risk-on mode. This has been a good sign for future returns as outlined here.
- Implied volatility remains below 20, showing a calm environment. The S&P 500 has perfomed well when this is the case as outlined here.
- Credit default swap spreads are above their 50-day moving average, which is modestly concerning as outlined here.
- A composite of trend measures in SPY and the average S&P 500 stock remain below 5, which show unhealthy trend conditions.
Since April, the most compelling studies have had a strongly bullish bias on longer time frames. You can follow these through the Active Studies page. From time to time, when the analysts' studies provide an overwhelming message, it will override the charts above, but there has been no consensus in the studies to suggest overriding the bullish environment.
Other major markets have been mostly rangebound for four months, and there is little among what we follow to suggest a compelling edge either way.
A Potential Bearish-to-Bullish Transition in Natural Gas
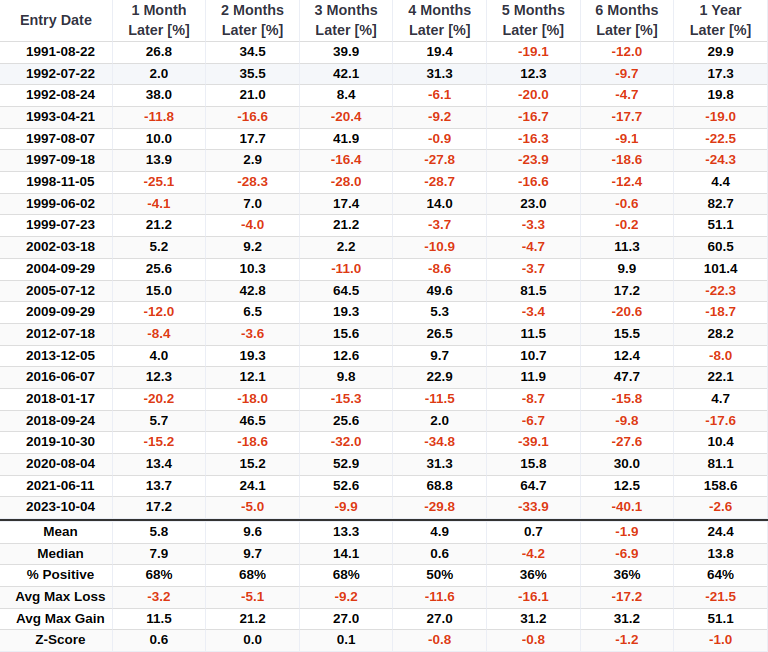
Natural gas futures closed at a 6-month high but not a 9-month high, completing a potential base breakout. Historically, similar breakouts have preceded a gain 68% of the time over the subsequent three months, but the path has been volatile. Despite the potential in the commodity, related natural gas stocks have shown a lackluster and divergent historical performance.
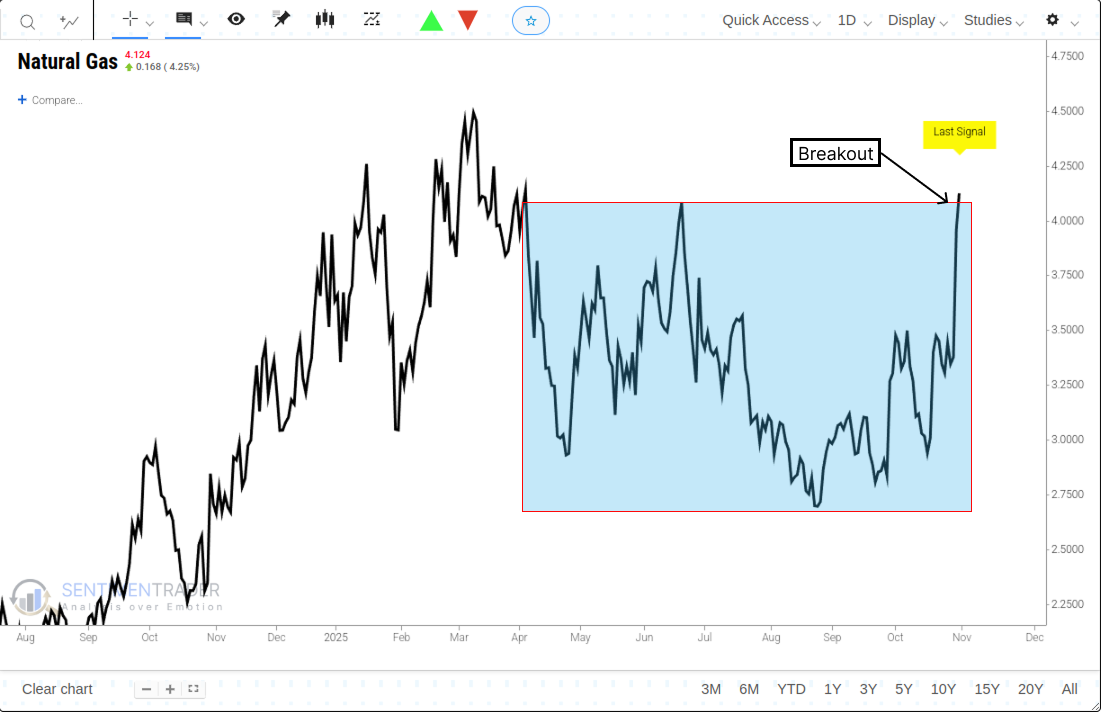
When natural gas completes a base breakout pattern after a 1-year low, the historical performance has been inconsistent and highly volatile. The commodity showed a positive median return and a 68% win rate over the subsequent one and three-month periods, suggesting some potential for a short-term follow-through.
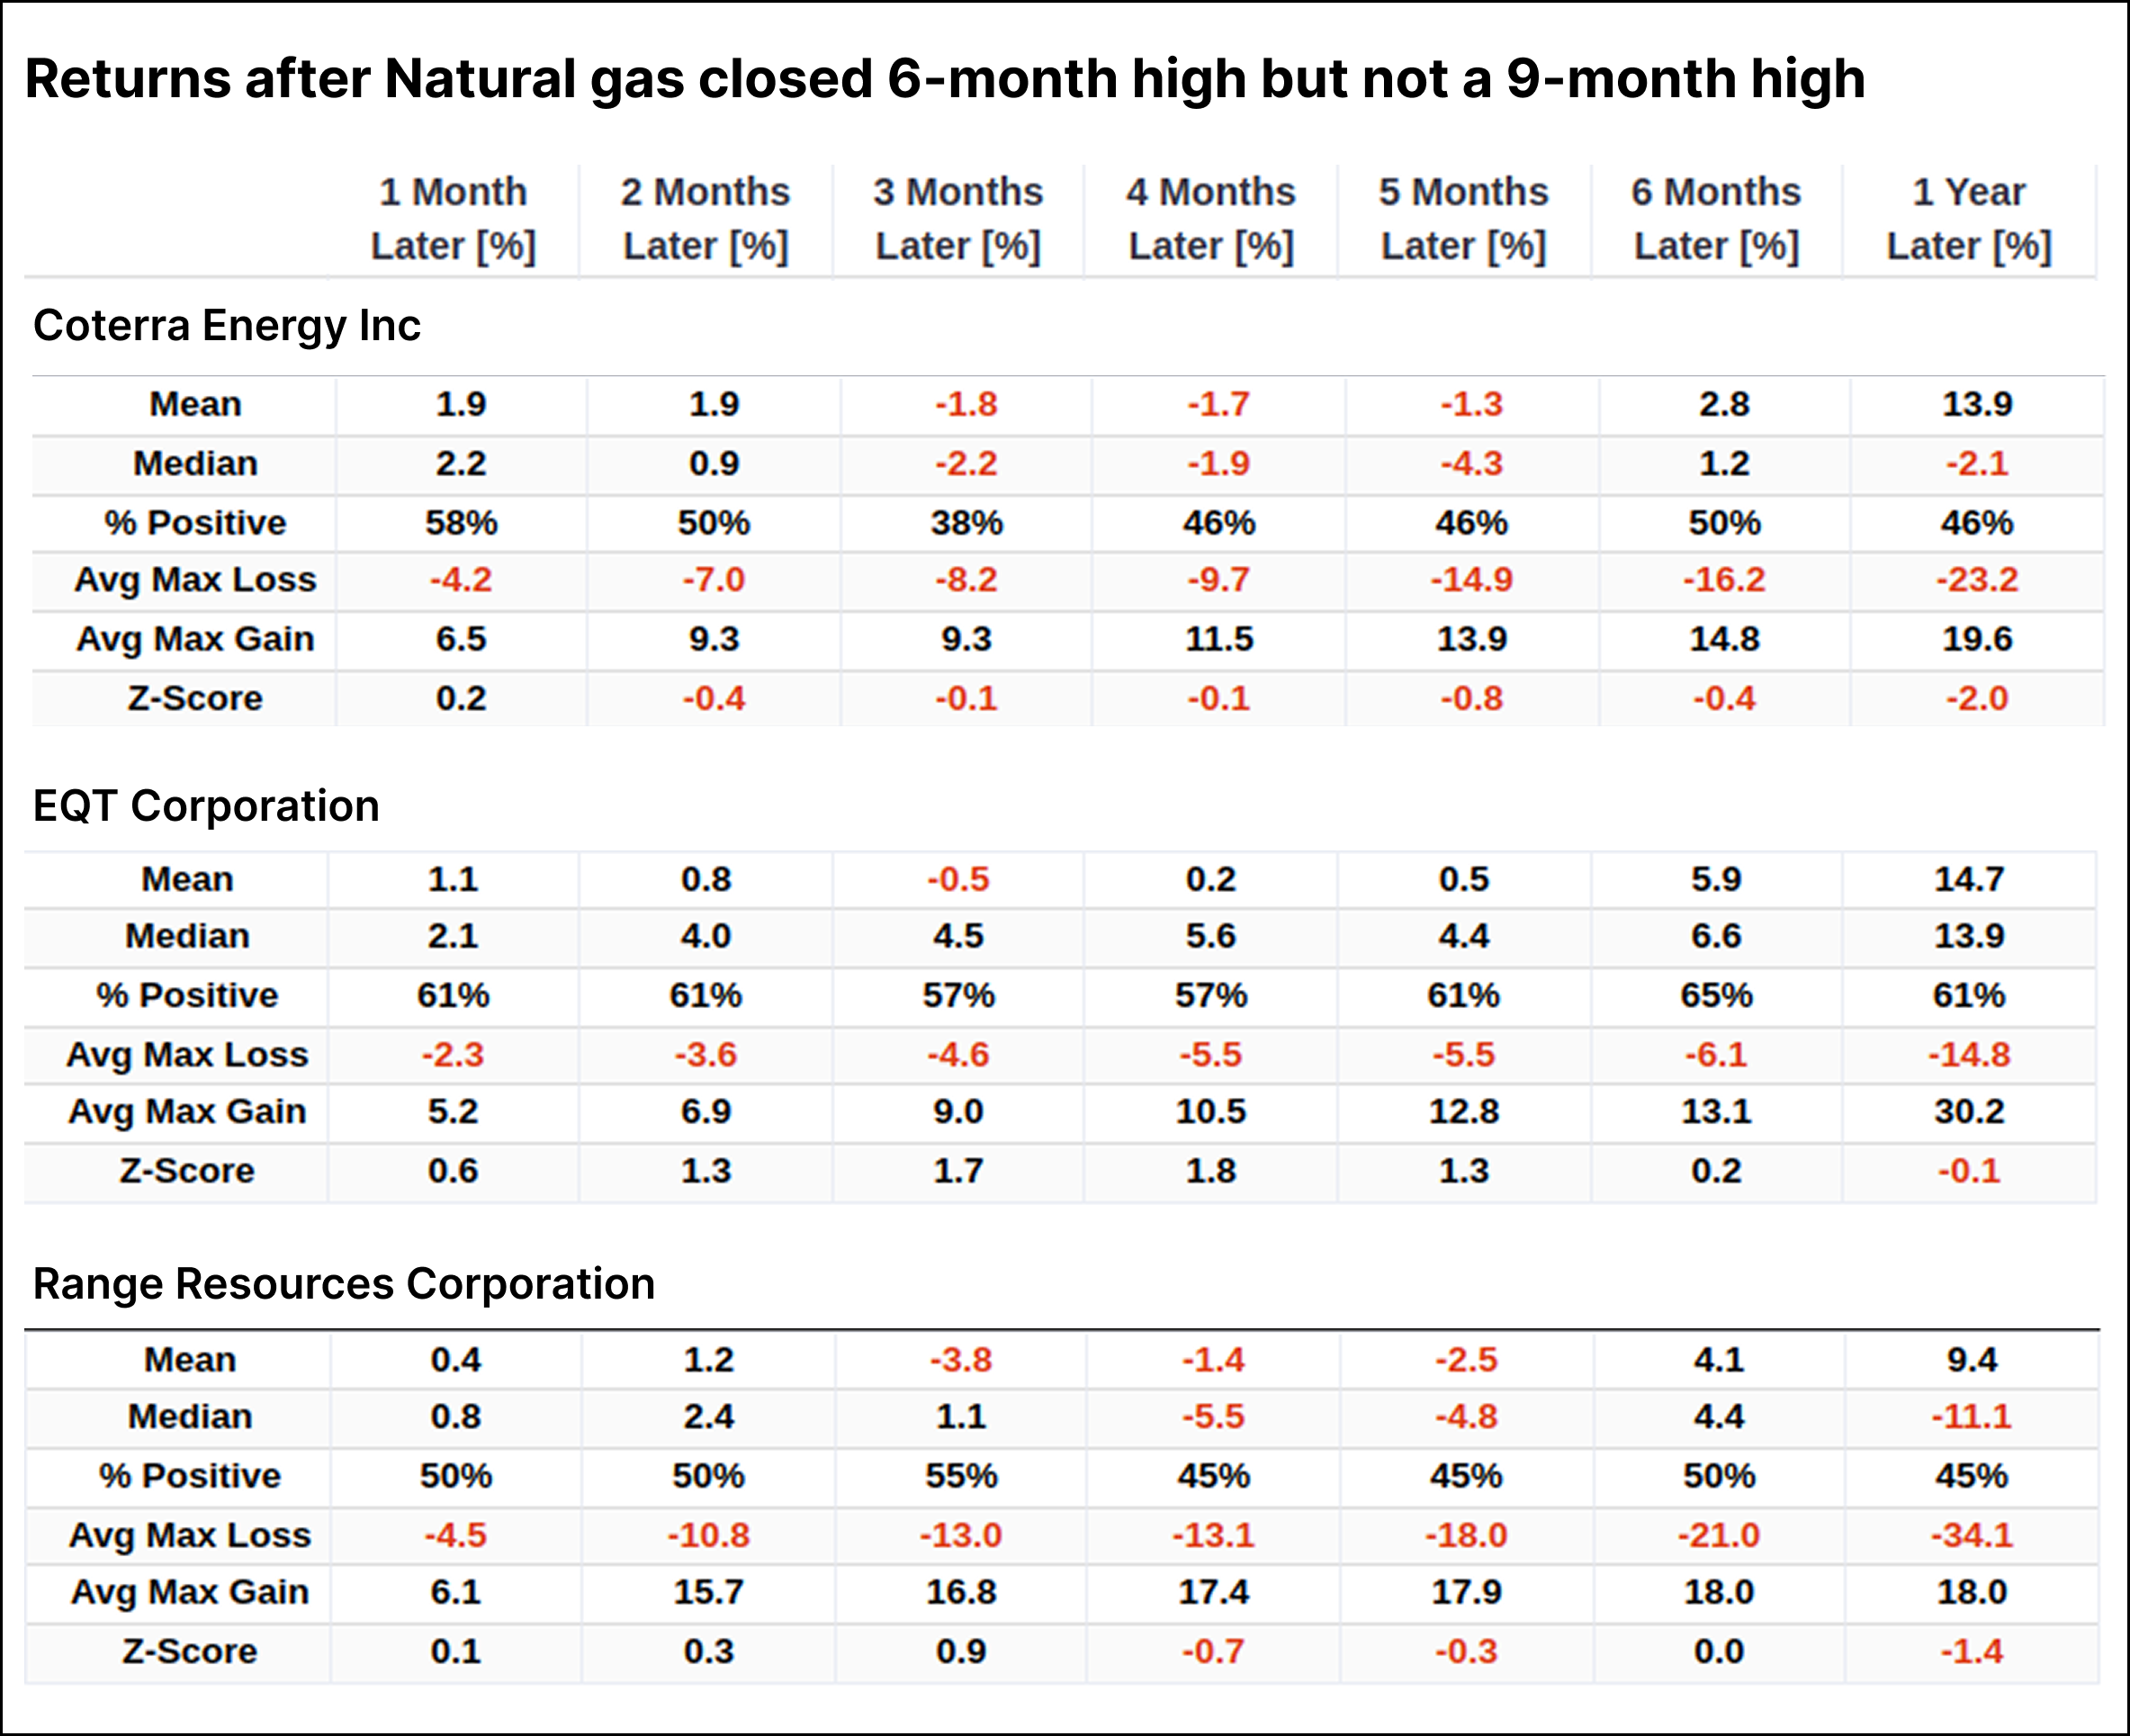
Surprisingly, the returns and win rates of various natural gas stocks appeared lackluster, showing a clear divergence from the commodity's performance. Unlike the commodity, which showed a strong 68% win rate over the next three months, the stocks' performance was mixed to poor.
Two Sectors for Short-Term Traders to Consider
The stock market is showing terrific strength, so a pullback remains a distinct possibility. That said, several sectors are entering periods of historically significant and persistent strength, so traders should be looking for opportunities to play the long side.
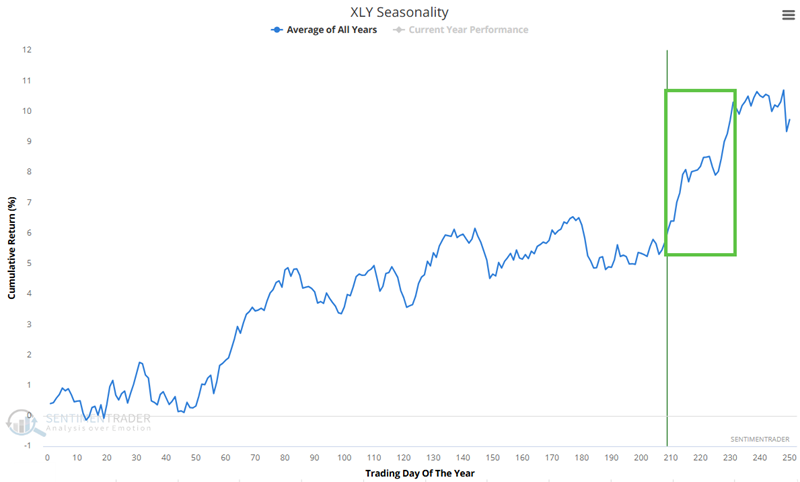
The Annual Seasonal Trend chart for the Consumer Discretionary Select Sector ETF (XLY) is entering a favorable seasonal period of the year while already in an established uptrend. This period extends from Trading Day of the Year (TDY) #209 through TDY #231. For 2025, this period extends from October 31st through December 3rd.
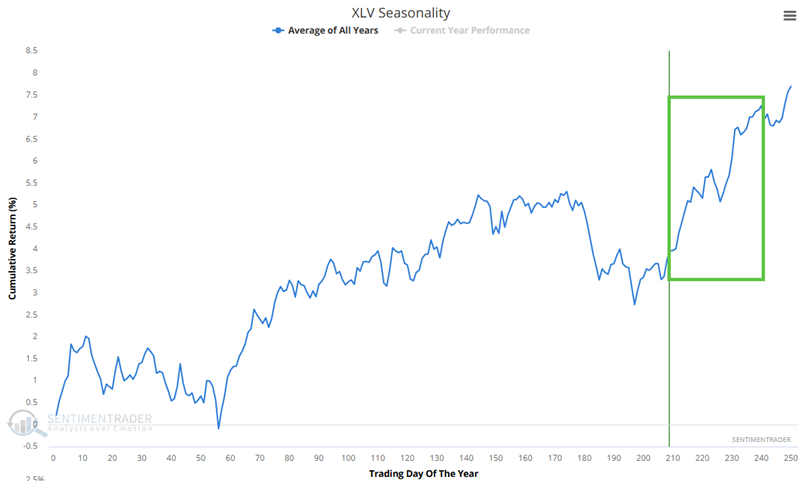
The Health Care Select Sector SPDR Fund ETF (XLV) is entering a favorable seasonal period of the year while already in an established uptrend. This period extends from Trading Day of the Year (TDY) #209 through TDY #240. For 2025, this period extends from October 31st through December 16th.
Euphoric Sentiment and Concentrated Market Structure
Traders often mistakenly assume that signals from each indicator are "actionable orders"-i.e., buy or sell signals. In reality, signals from most indicators are usually best used as evidence to support a bullish or bearish perspective.
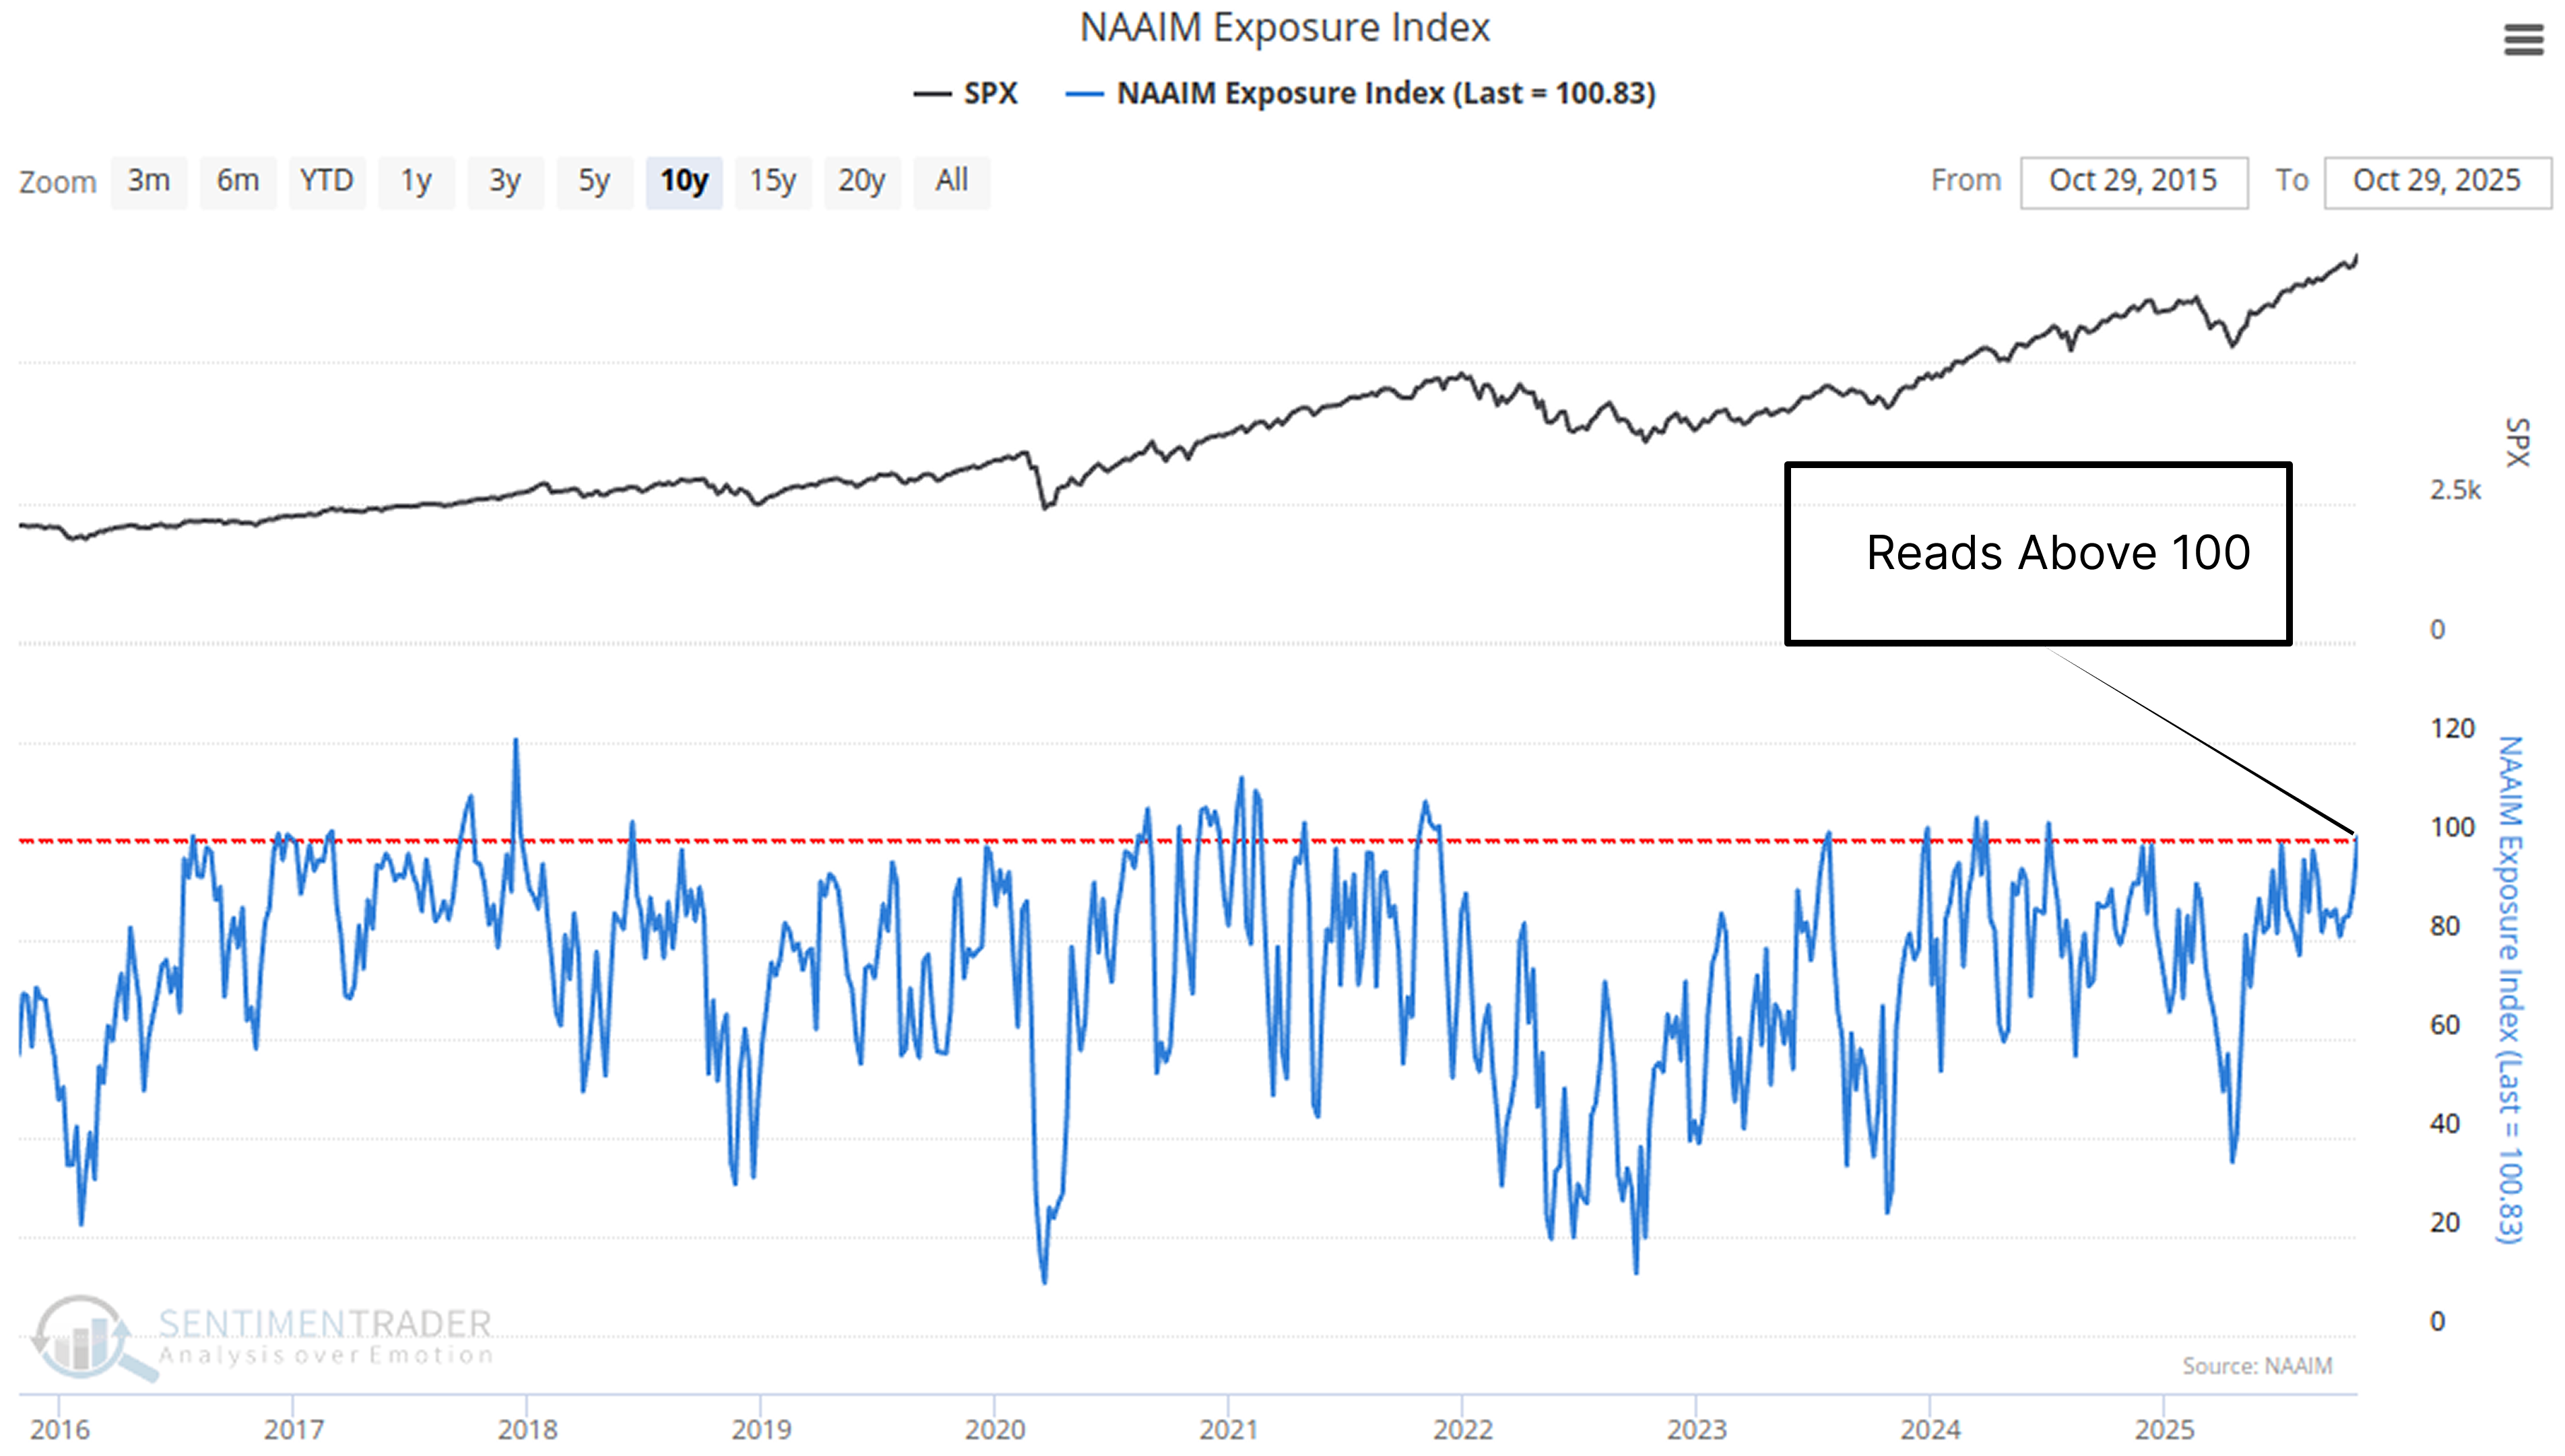
The NAAIM Exposure Index surpassing 100% on October 29, 2025. This is a bullish stance, meaning professional managers are, on average, holding leveraged long positions.
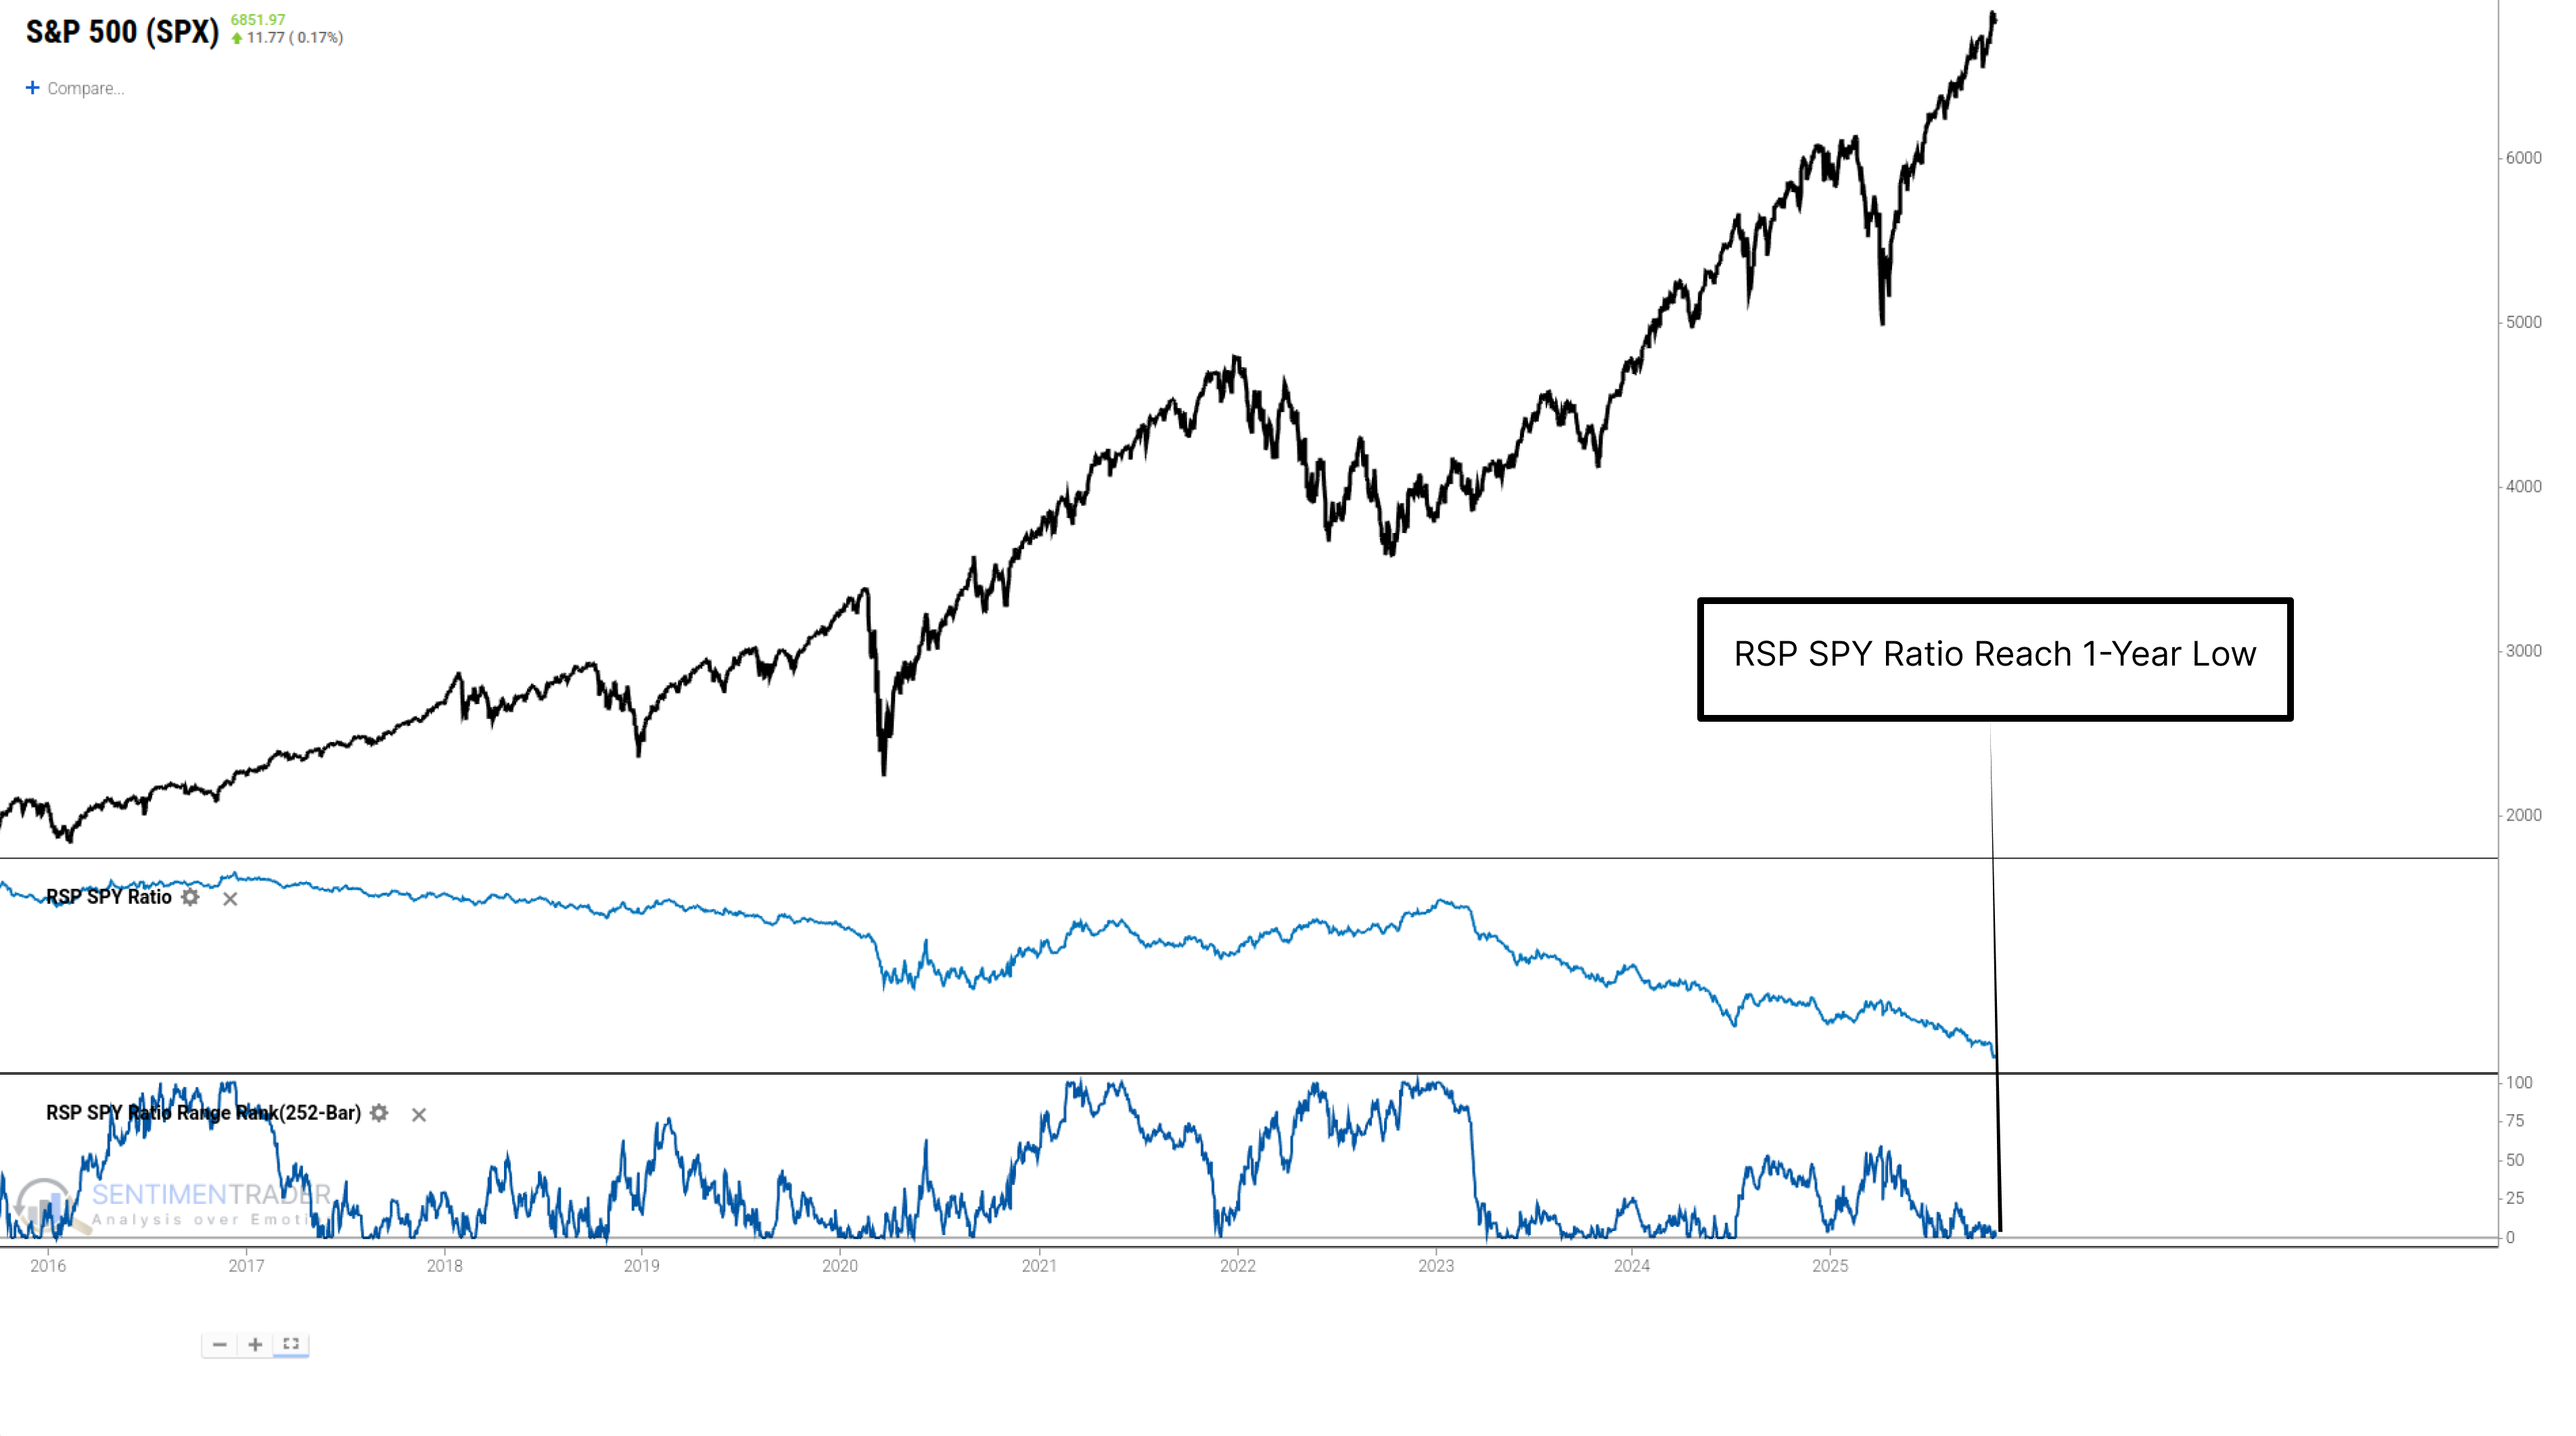
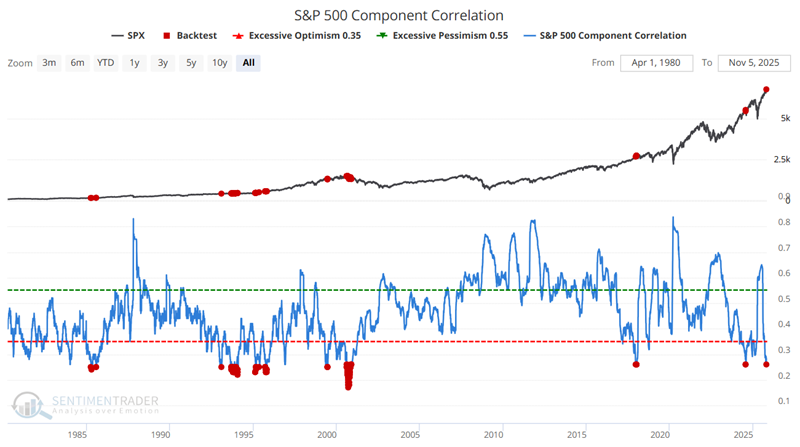
The RSP/SPY Ratio to measure market breadth hit a one-year low on October 27, 2025. This confirms the market is in a state of extreme concentration: the vast majority of stocks are underperforming, and the index is propped up by just a handful of mega-cap stocks.
Introducing the JK Economic Barometer
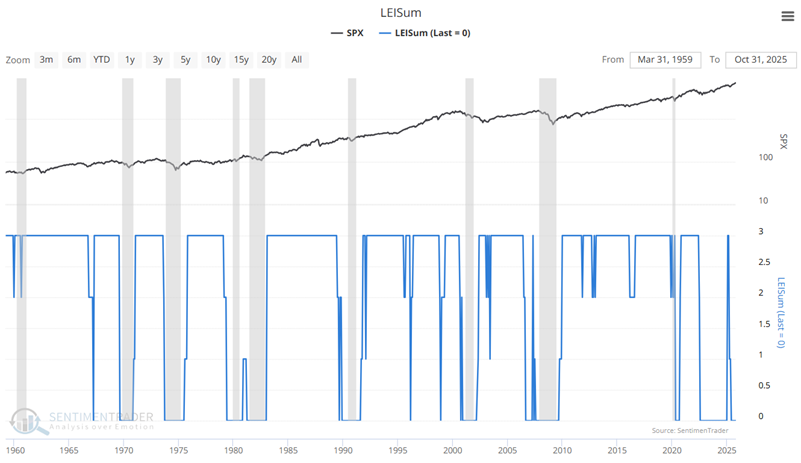
We utilize two primary models to gauge the current trend and potential future trend of the economy - the Macro Index Model and the LEISum indicator. The Macro Index Model comprises eleven economic indicators to form an overall index that ranges from 0.00 to 1.00.
The LEISum indicator examines specific trends in the Conference Board Leading Economic Indicators data series and can range from 0 to 3. Any reading above zero is considered favorable for the economy and the stock market.
Hindenburg and Titanic Signals Are Clustering
While the Nasdaq Composite remains near its all-time highs, the market's internal health has shown signs of significant deterioration. This creates a potentially dangerous divergence, where the headline index is held up by a few names while broad participation crumbles.
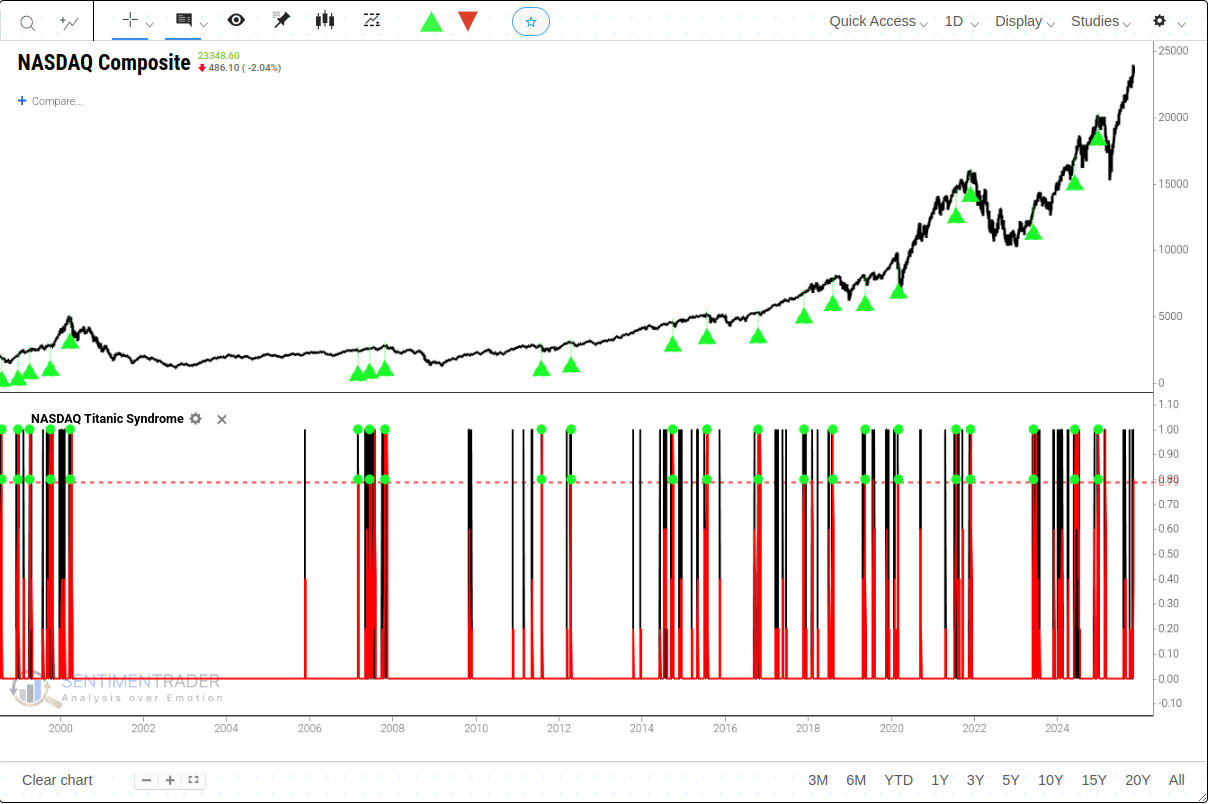
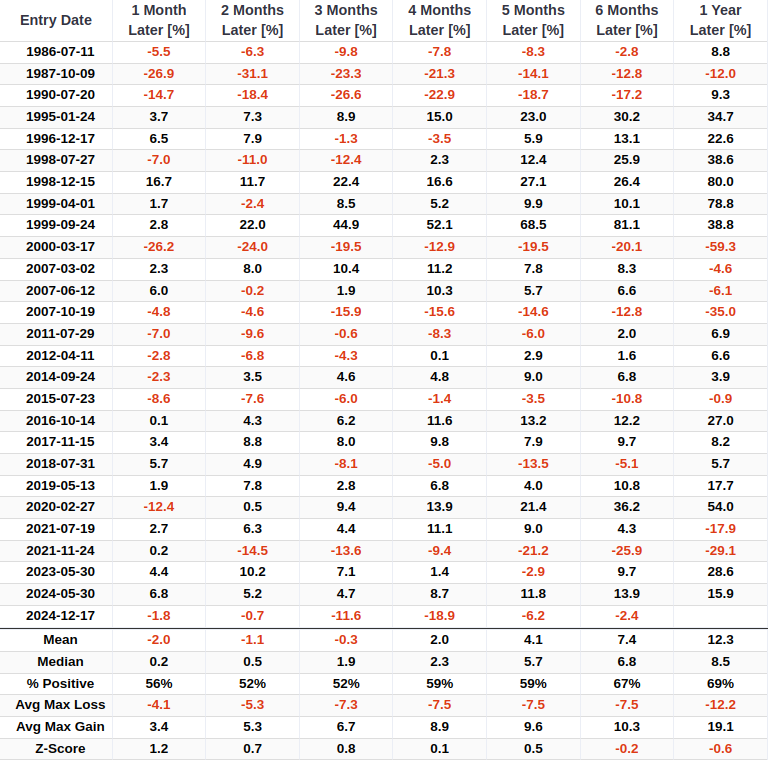
A cluster of classic market warning signals has triggered, even as the Nasdaq hovers near new highs. The Nasdaq Titanic Syndrome and Hindenburg Omen have flashed a combined six times in the last five trading sessions.
Some Warning Sign "Clouds" Gather on the Horizon
Looking solely at price action, it is impossible to deem the current trend of the stock market as anything but favorable. As displayed in the charts below, the major stock market indexes are all trading well above their respective 200-day moving averages.
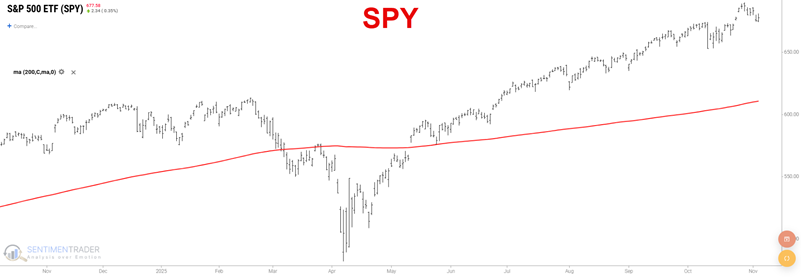
However, it is essential to watch for potential storm clouds as they form in the distance. A few that we see right now are detailed below.
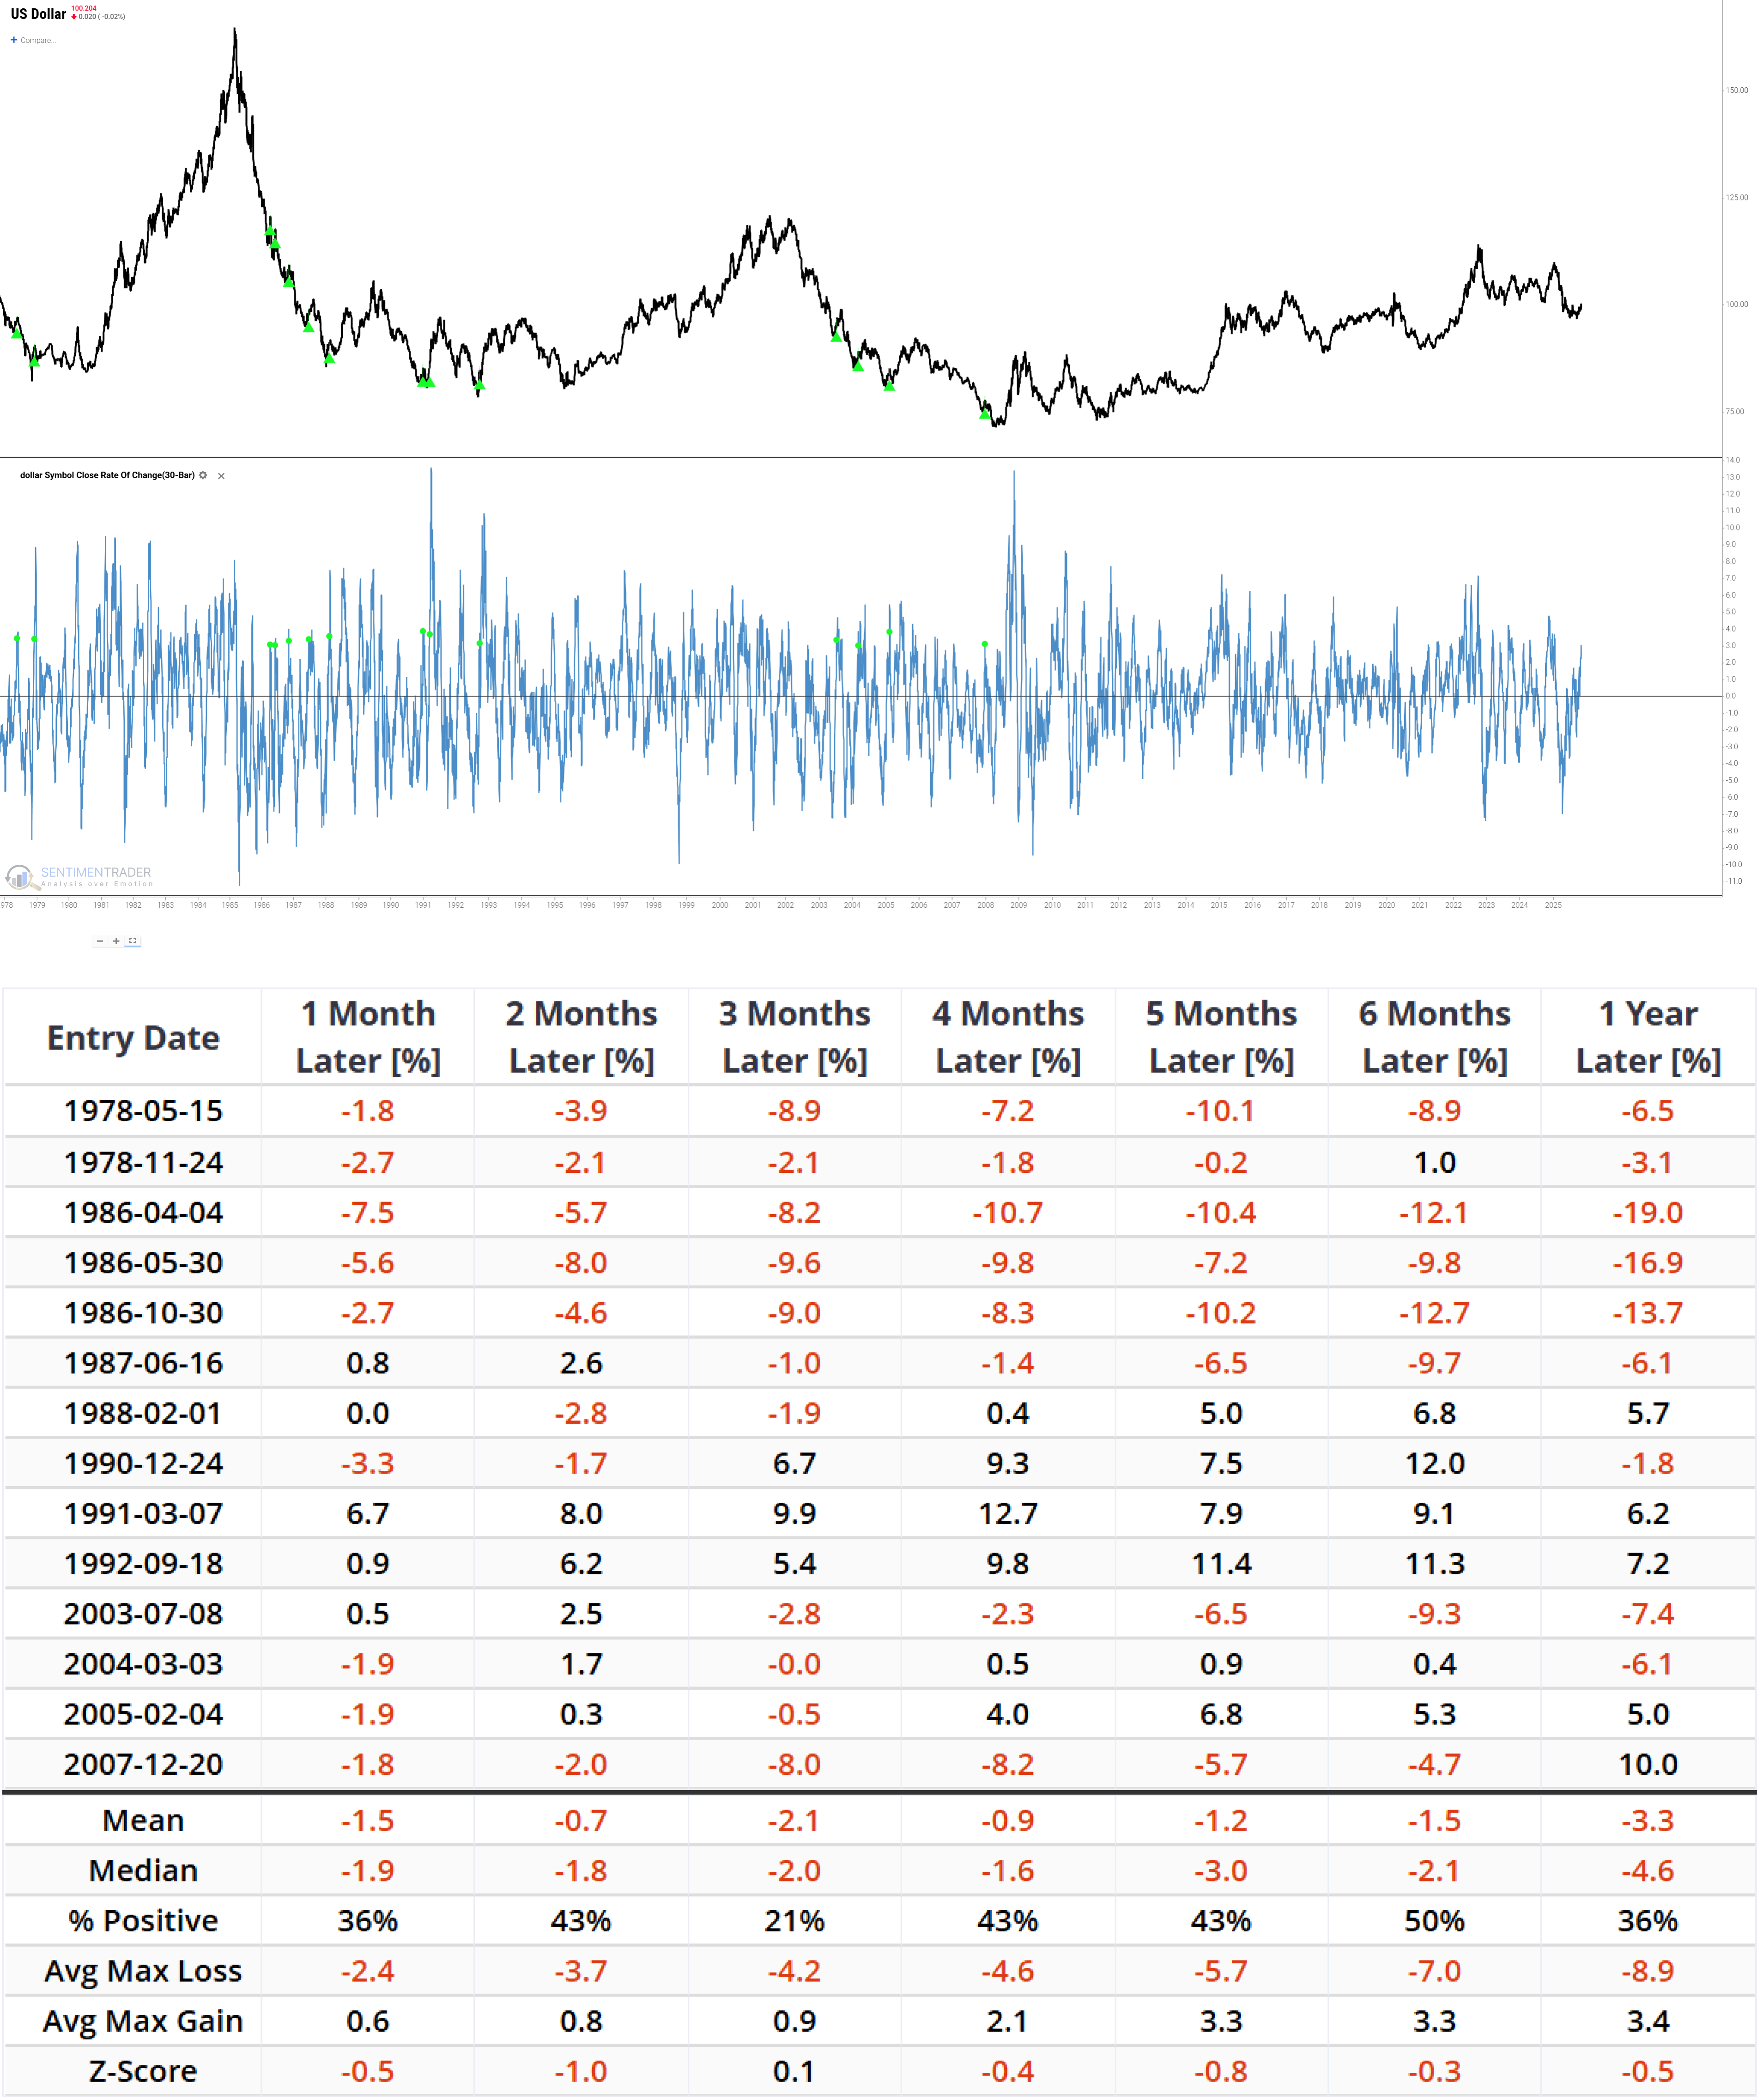
Dollar's Rally from Lows
In recent weeks, investors have flocked to the dual tightening trade of "stronger dollar + rising U.S. Treasury yields," a capital force that has become the core driver of the dollar's sharp rebound.
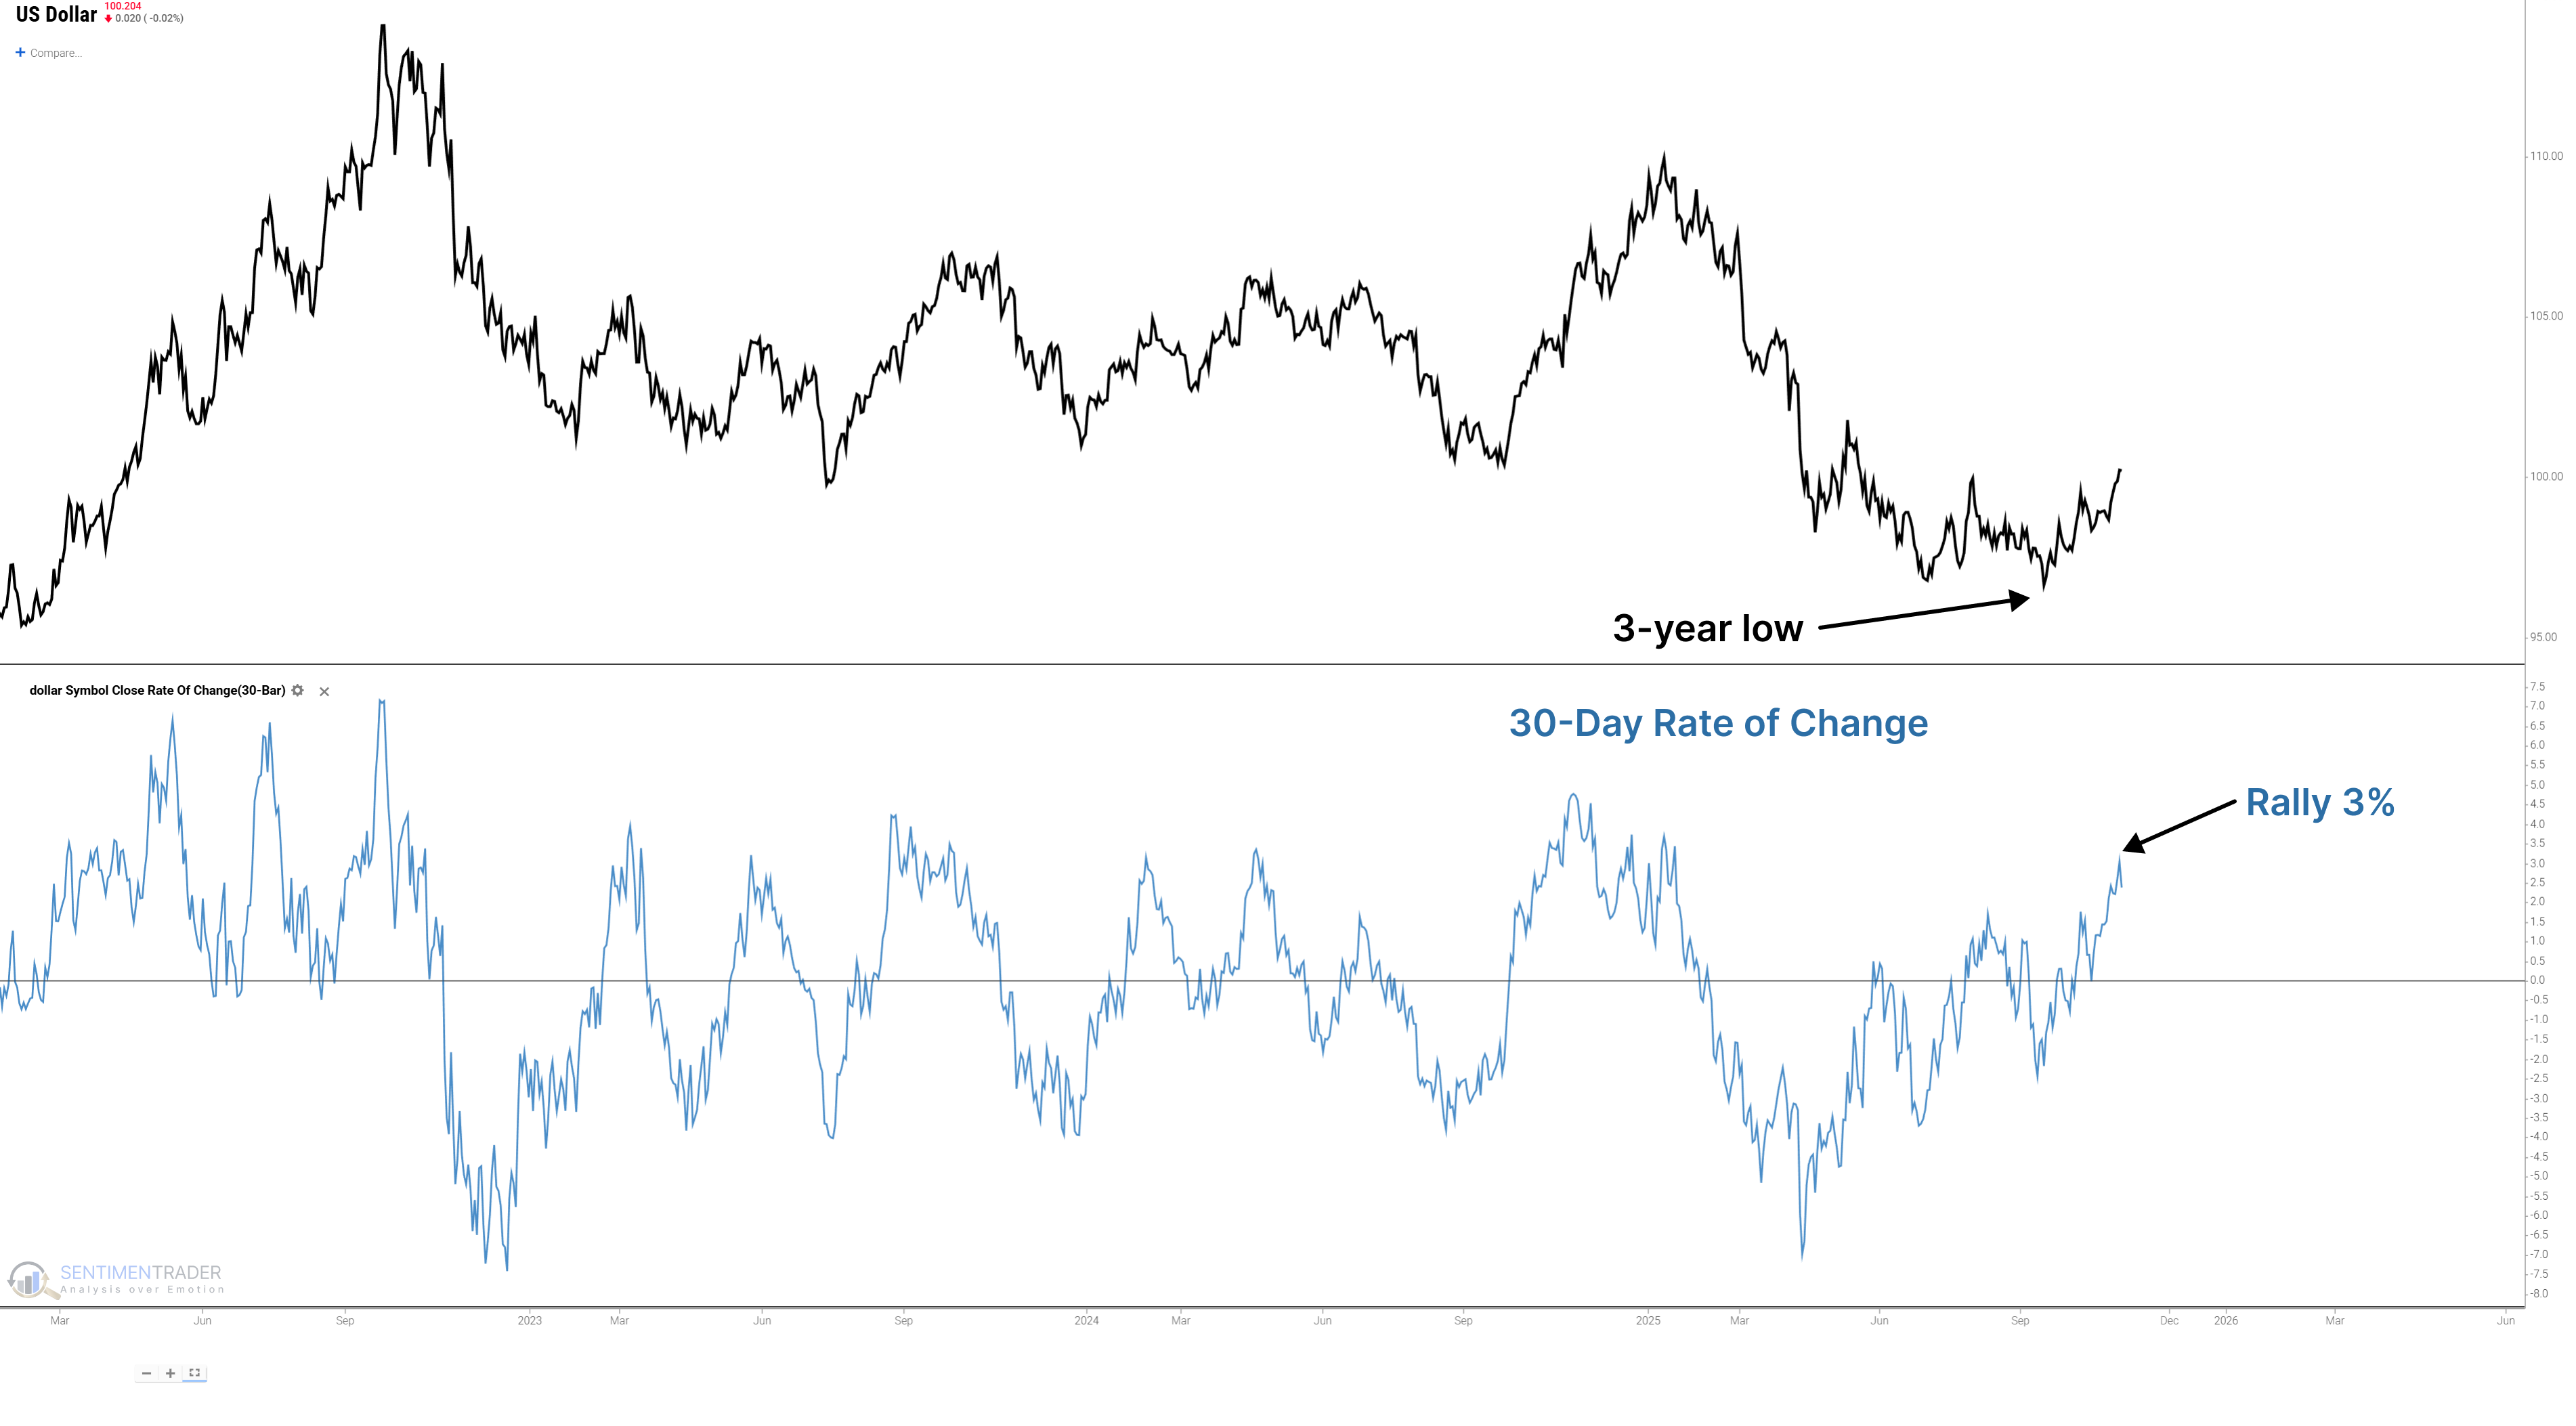
This rally occurred after the Dollar Index touched an absolute 3-year low, recording a gain of over 3% in just 42 trading days.
About TradingEdge Weekly...
The goal of TradingEdge Weekly is to summarize some of the research published to SentimenTrader over the past week. Sometimes there is a lot to digest, and this summary highlights the highest conviction or most compelling ideas we discussed. This is NOT the published research; rather, it pulls out some of the most relevant parts. It includes links to the published research for convenience, and if you don't subscribe to those products, it will present the options for access.