
TradingEdge Weekly for Nov 28 - JK Economic Barometer, oversold conditions, TCTM Composite Washout Model, commodities speculation, bond sentiment, gold sentiment

Key points:
- Analyzing the JK Economic Barometer's signals for S&P 500 performance
- Key indicators suggesting oversold conditions in stocks
- Deep dive into the Sentimentrader's TCTM Composite Washout Model components
- Short-term speculative opportunities in commodities like US Dollar and unleaded gas
- Crowding risks in bond options markets and elevated gold sentiment
House View:
- Stocks:
- Short-term: Bullish. Major U.S. indices extend a four-day rally with broadening market breadth, driven by tech sector recovery and firming Fed rate cut expectations. Sentiment is buoyed by the "no-news-is-good-news" dynamic amid delayed economic data releases. This time frame covers 1-4 weeks.
- Intermediate-term: No view. The market operates in a "data black hole" with key GDP and inflation data postponed until late December, creating fragile sentiment. The Fed's December policy meeting remains a pivotal event, with rate cut expectations already largely priced in. This time frame covers 1-5 months.
- Long-term: Bullish. Structural growth is anchored by AI capital expenditure, which expands beyond cloud training to edge computing and enterprise deployment. This time frame covers 6-12 months.
- Cyclical momentum favors AI hardware, semiconductor equipment, and enterprise tech-resilient to short-term volatility due to structural demand.
- Defensive resilience persists in sectors with stable cash flows and inflation-hedging properties, though they lag in relative strength.
- Very long-term (one year+) favors mean reversion to undervalued small-cap value segments, which trail large-cap growth but show signs of catching up.
- Bonds: Long-term cycles remain bearish. Treasury yields trade in a narrow range amid thin pre-holiday liquidity and the absence of key economic data. Short-term yields are anchored by market expectations of a Fed rate cut in December. Cyclical indicators confirm no near-term reversal in the long-term bear trend.
- Commodities: A massive divergence is underway. An effective commodity trend model is currently bullish for precious metals.
- Precious metals: Strengthen significantly, supported by central bank buying amid de-dollarization efforts, rate cut expectations that reduce opportunity costs, and concerns over fiscal dominance. Gold maintains resilience despite easing geopolitical tensions, as investors focus on currency debasement risks from expanding global deficits.
- Crude oil: Plummets sharply amid fading geopolitical risk premiums from potential Russia-Ukraine peace talks, rising inventories, and weak global demand signals. The market faces heightened uncertainty ahead of the upcoming OPEC+ meeting, with supply glut concerns overriding production cut expectations.
- Crypto: We follow several simple systems for bitcoin, which we consider the equivalent of the S&P 500 for crypto. Due to bitcoin's explosive growth over long periods, it's dangerous to equate neutral conditions with being bearish for some of these. However, if a system is "out," we consider it bearish for this summary.
- Triple 40: Bearish
- RSI Momentum: Bearish
- Trend and Relative Trend: Bearish
- PMI: Bearish
- M2 ROC: Bullish
- Notable Moves in Global Markets :
- Japan (Nikkei 225): Rallies to key psychological levels, fueled by gains in AI supply chain stocks (semiconductor equipment, materials), corporate governance reforms, and yen weakness supporting export competitiveness. The market benefits from spillover momentum from U.S. tech rallies and its role as a low-valuation play on global AI infrastructure buildout.
- Hong Kong (Hang Seng): Demonstrates limited upside momentum near key levels, held back by lingering property market pressures and slow earnings recovery in mainland China. Financials and utilities provide defensive support, while tech stocks consolidate amid cautious foreign capital flows waiting for clearer policy catalysts.
- Europe (STOXX 600): Market performance was mixed, with M&A activity providing localized bright spots while the technology sector trended downward. The European Central Bank's dovish stance offered some support to eurozone-related stocks.
Where we're at
Most investors have the most riding on equities. We feel that the most significant determinants of success for investors are whether to adjust their allocation to that asset class based on factors that have historically had a good record of preceding above- or below-random returns in the months ahead.
Those factors include the probability of a looming recession, sentiment, price action, volatility, breadth, and the bond market. The chart below summarizes the main indicators and composite models we watch for those factors, and they're mostly in bullish regimes. Valuations are not part of these factors since the relationship has been too inconsistent on time frames under one year.
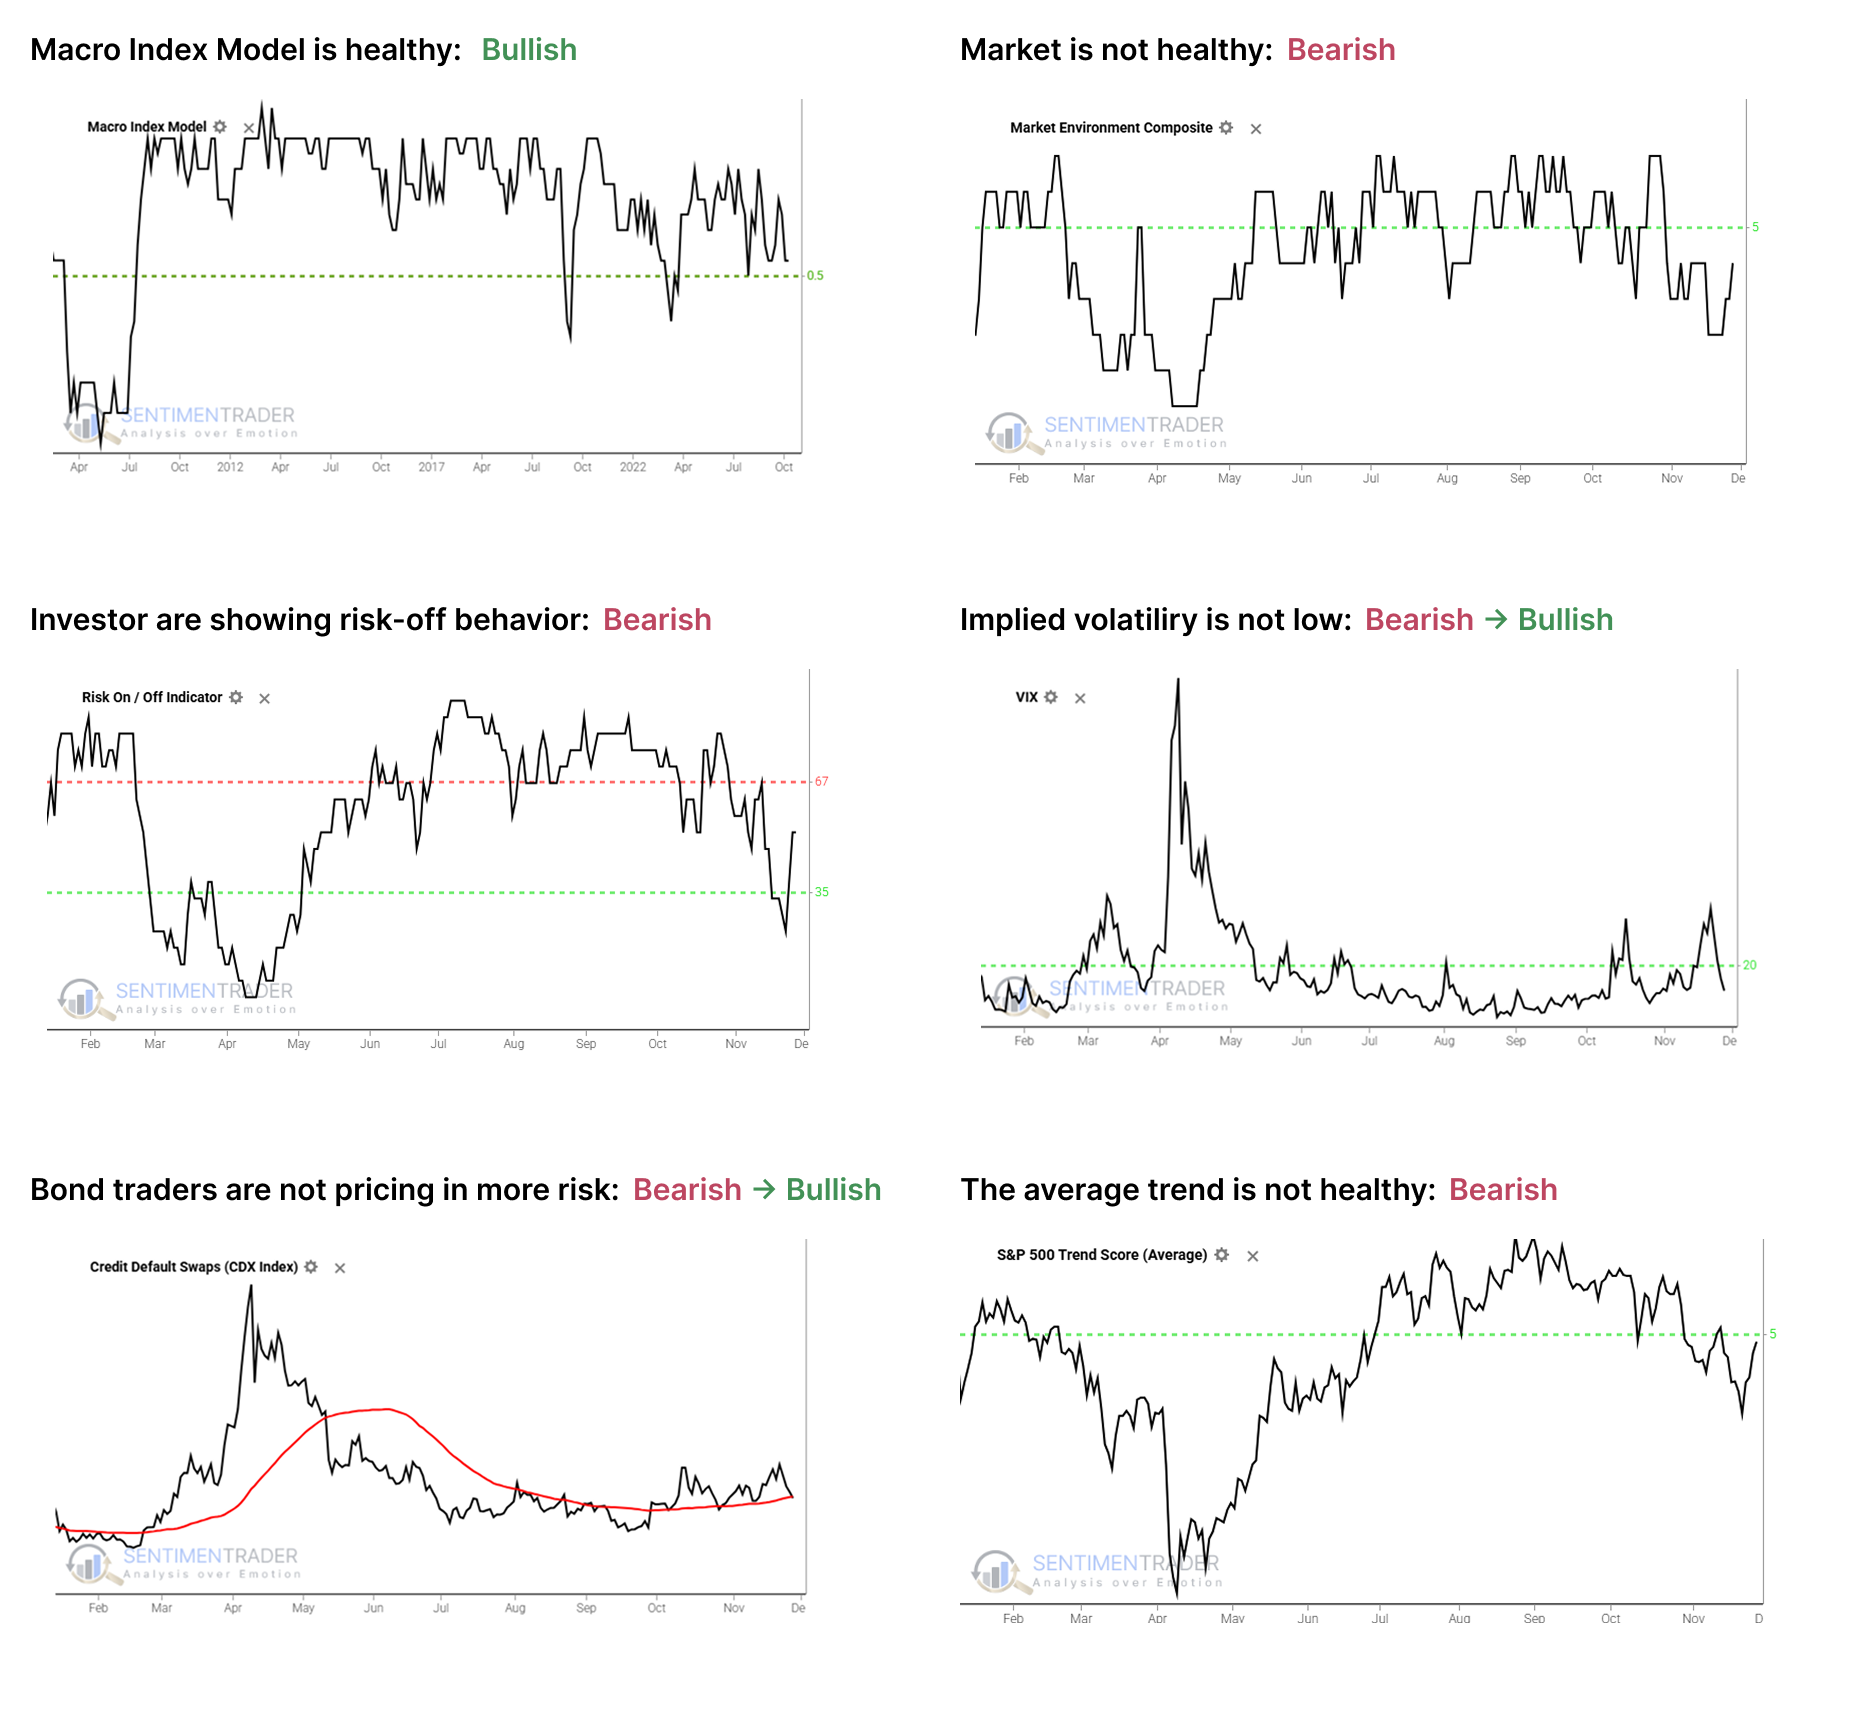
- The Macro Index Model is above the 50% threshold, which has been a vital level as outlined here.
- The Market Environment has been skittish since April, and has slipped into an unhealthy condition. Future returns, especially for higher-beta indices, have historically been notably weaker, with greater risk, when the environment is unhealthy as outlined here.
- The Risk On / Off Indicator shows that investors have shifted to risk-off mode. This serves as a warning sign for future returns as outlined here.
- Implied volatility remains below 20, showing a calm environment. The S&P 500 has perfomed well when this is the case as outlined here.
- Credit default swap spreads are below their 50-day moving average, which drastically improves stock returns as outlined here.
- A composite of trend measures in SPY and the average S&P 500 stock remain below 5, which show unhealthy trend conditions.
Since April, the most compelling studies have had a strongly bullish bias on longer time frames. You can follow these through the Active Studies page. From time to time, when the analysts' studies provide an overwhelming message, it will override the charts above, but there has been no consensus in the studies to suggest overriding the bullish environment.
Other major markets have been mostly rangebound for four months, and there is little among what we follow to suggest a compelling edge either way.
JK Economic Barometer signals for S&P 500
The JK Economic Barometer combines the Macro Index Model and LEISUM indicator to identify economic contraction periods. Currently reading 0.55, towards the low end of its historical range but still above the critical 0.30 level.
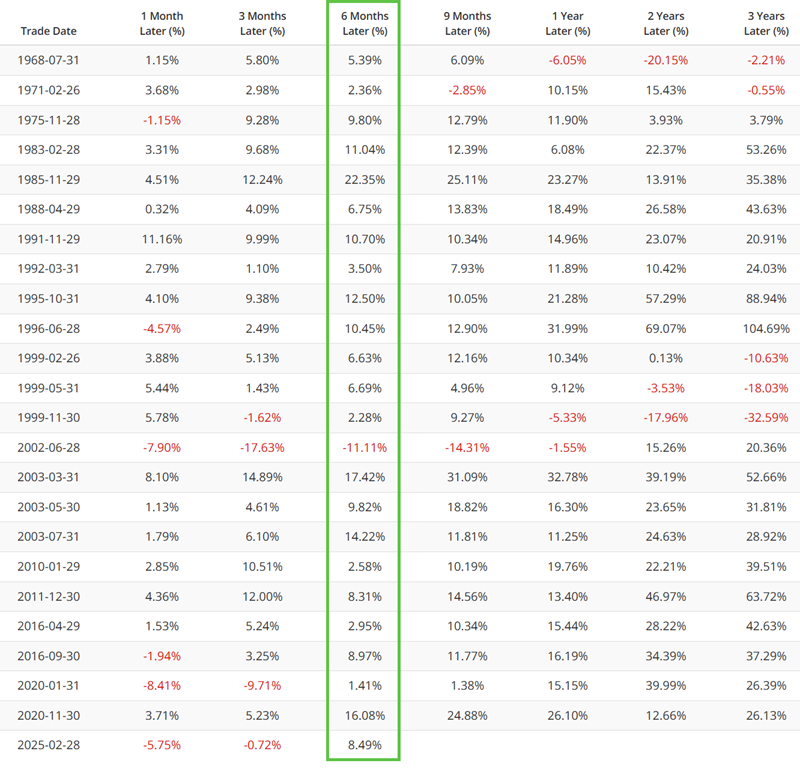
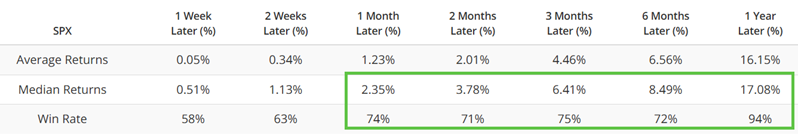
When the 3-month moving average crosses above 0.55, subsequent S&P 500 performance shows decent but not spectacular results:
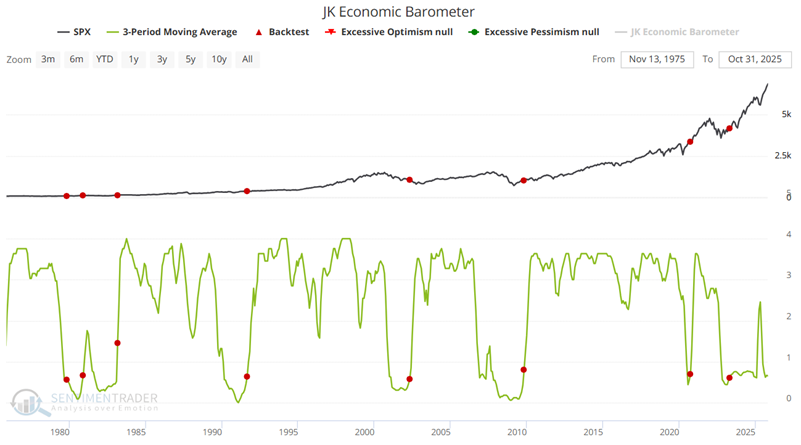
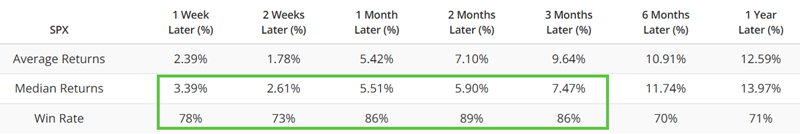
The indicator provides more reliable signals when crossing above 2.5 during strong economic conditions, with 6-9 month win rates in the high 80s%.
Oversold conditions in major sectors
Major Sector Breadth (% > 50 Day Avg) recently dropped below 10 while S&P 500 remained above its 200-day moving average - a rare oversold signal with historical win rates of 75-91% across timeframes.
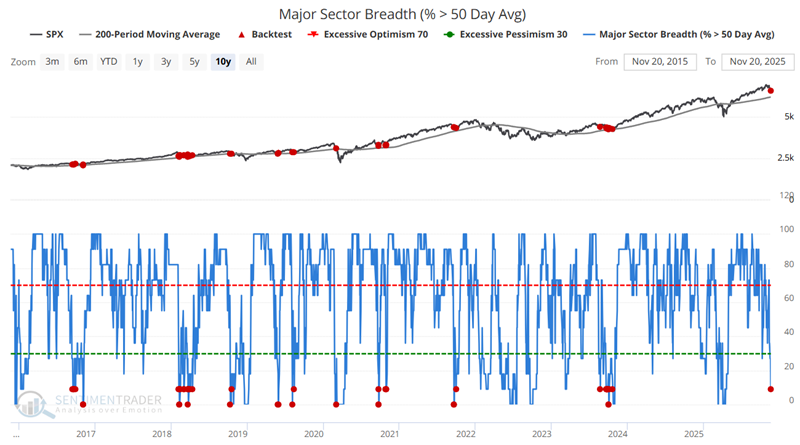
The Risk On/Risk Off indicator below 30 combined with S&P 500 above 200-day MA suggests an oversold condition forming:
Fear & Greed Model at 3 or lower (scale of 0-100) shows particularly strong performance in 1-3 month windows following signals:
TCTM Composite Washout Model components
Our new Composite Washout Model combines nine algorithms to identify market bottoms:
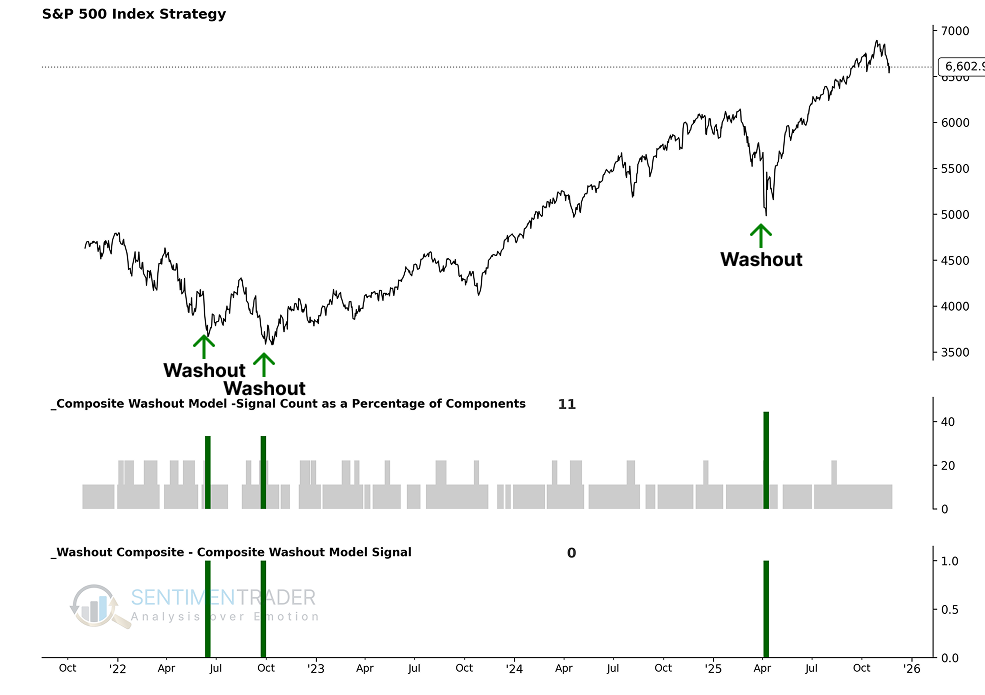
Key components include:
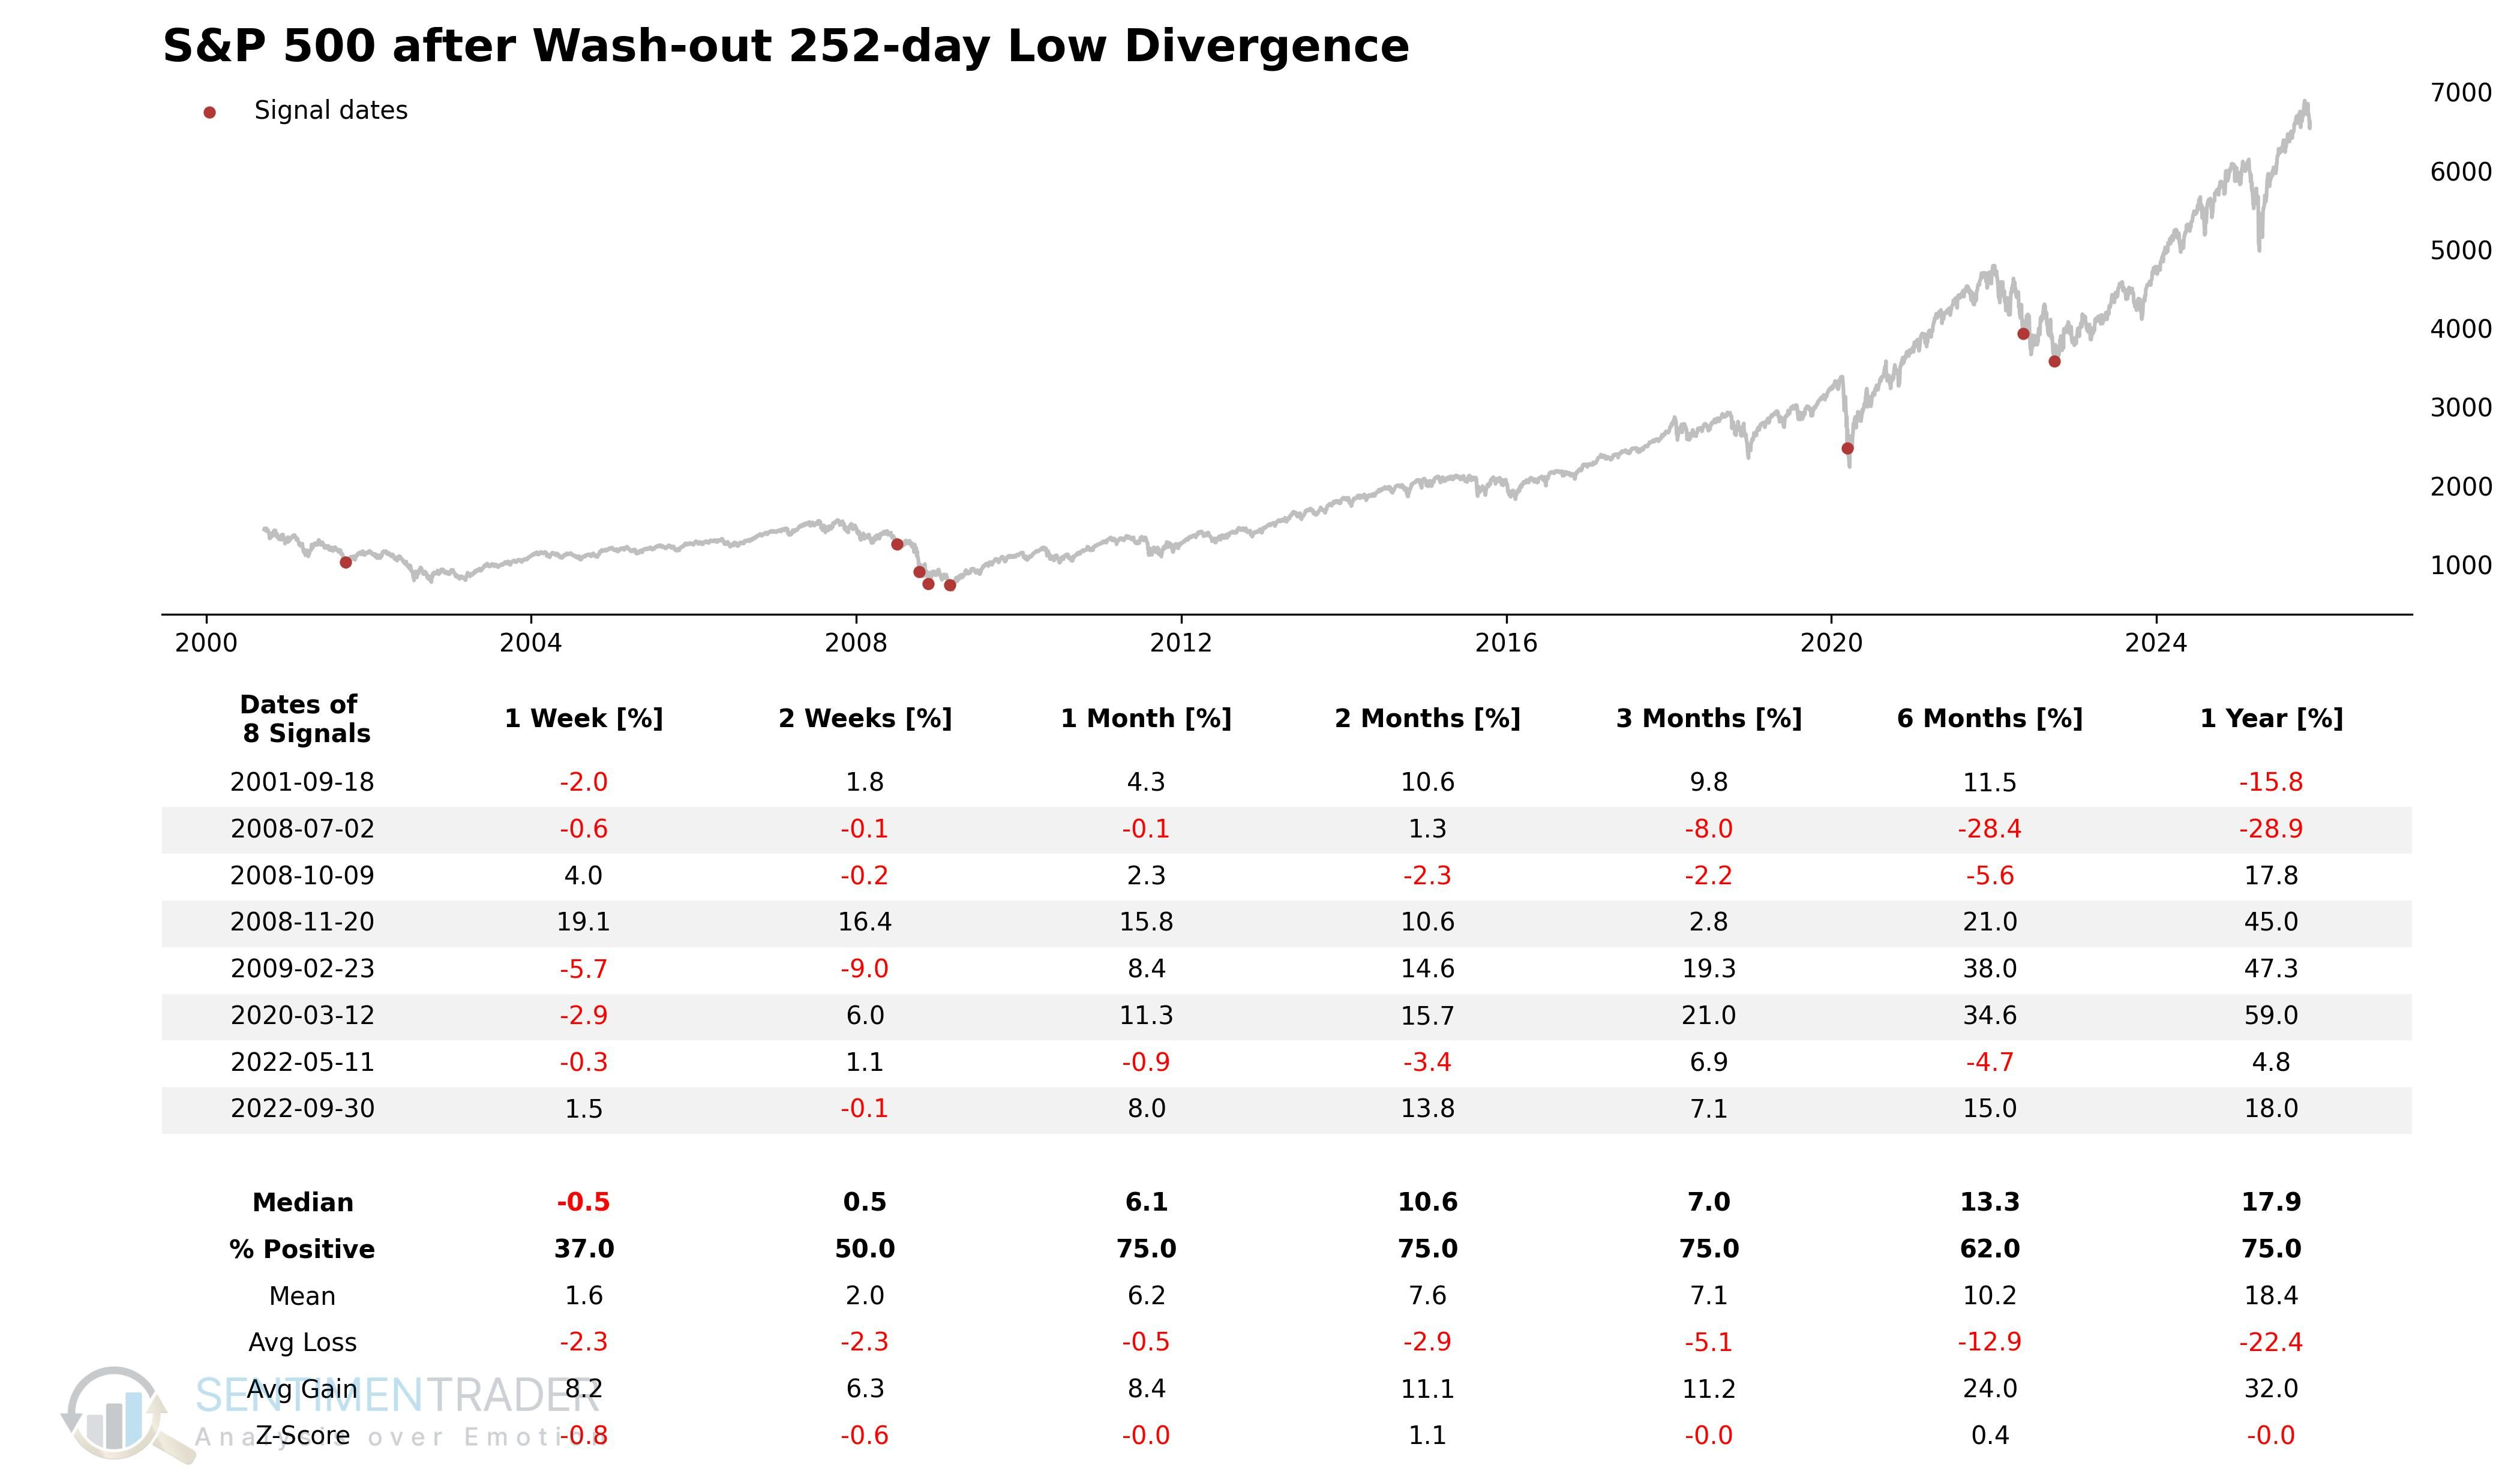
252-day Low Divergence - identifies bottoms when new index lows occur with improving breadth:
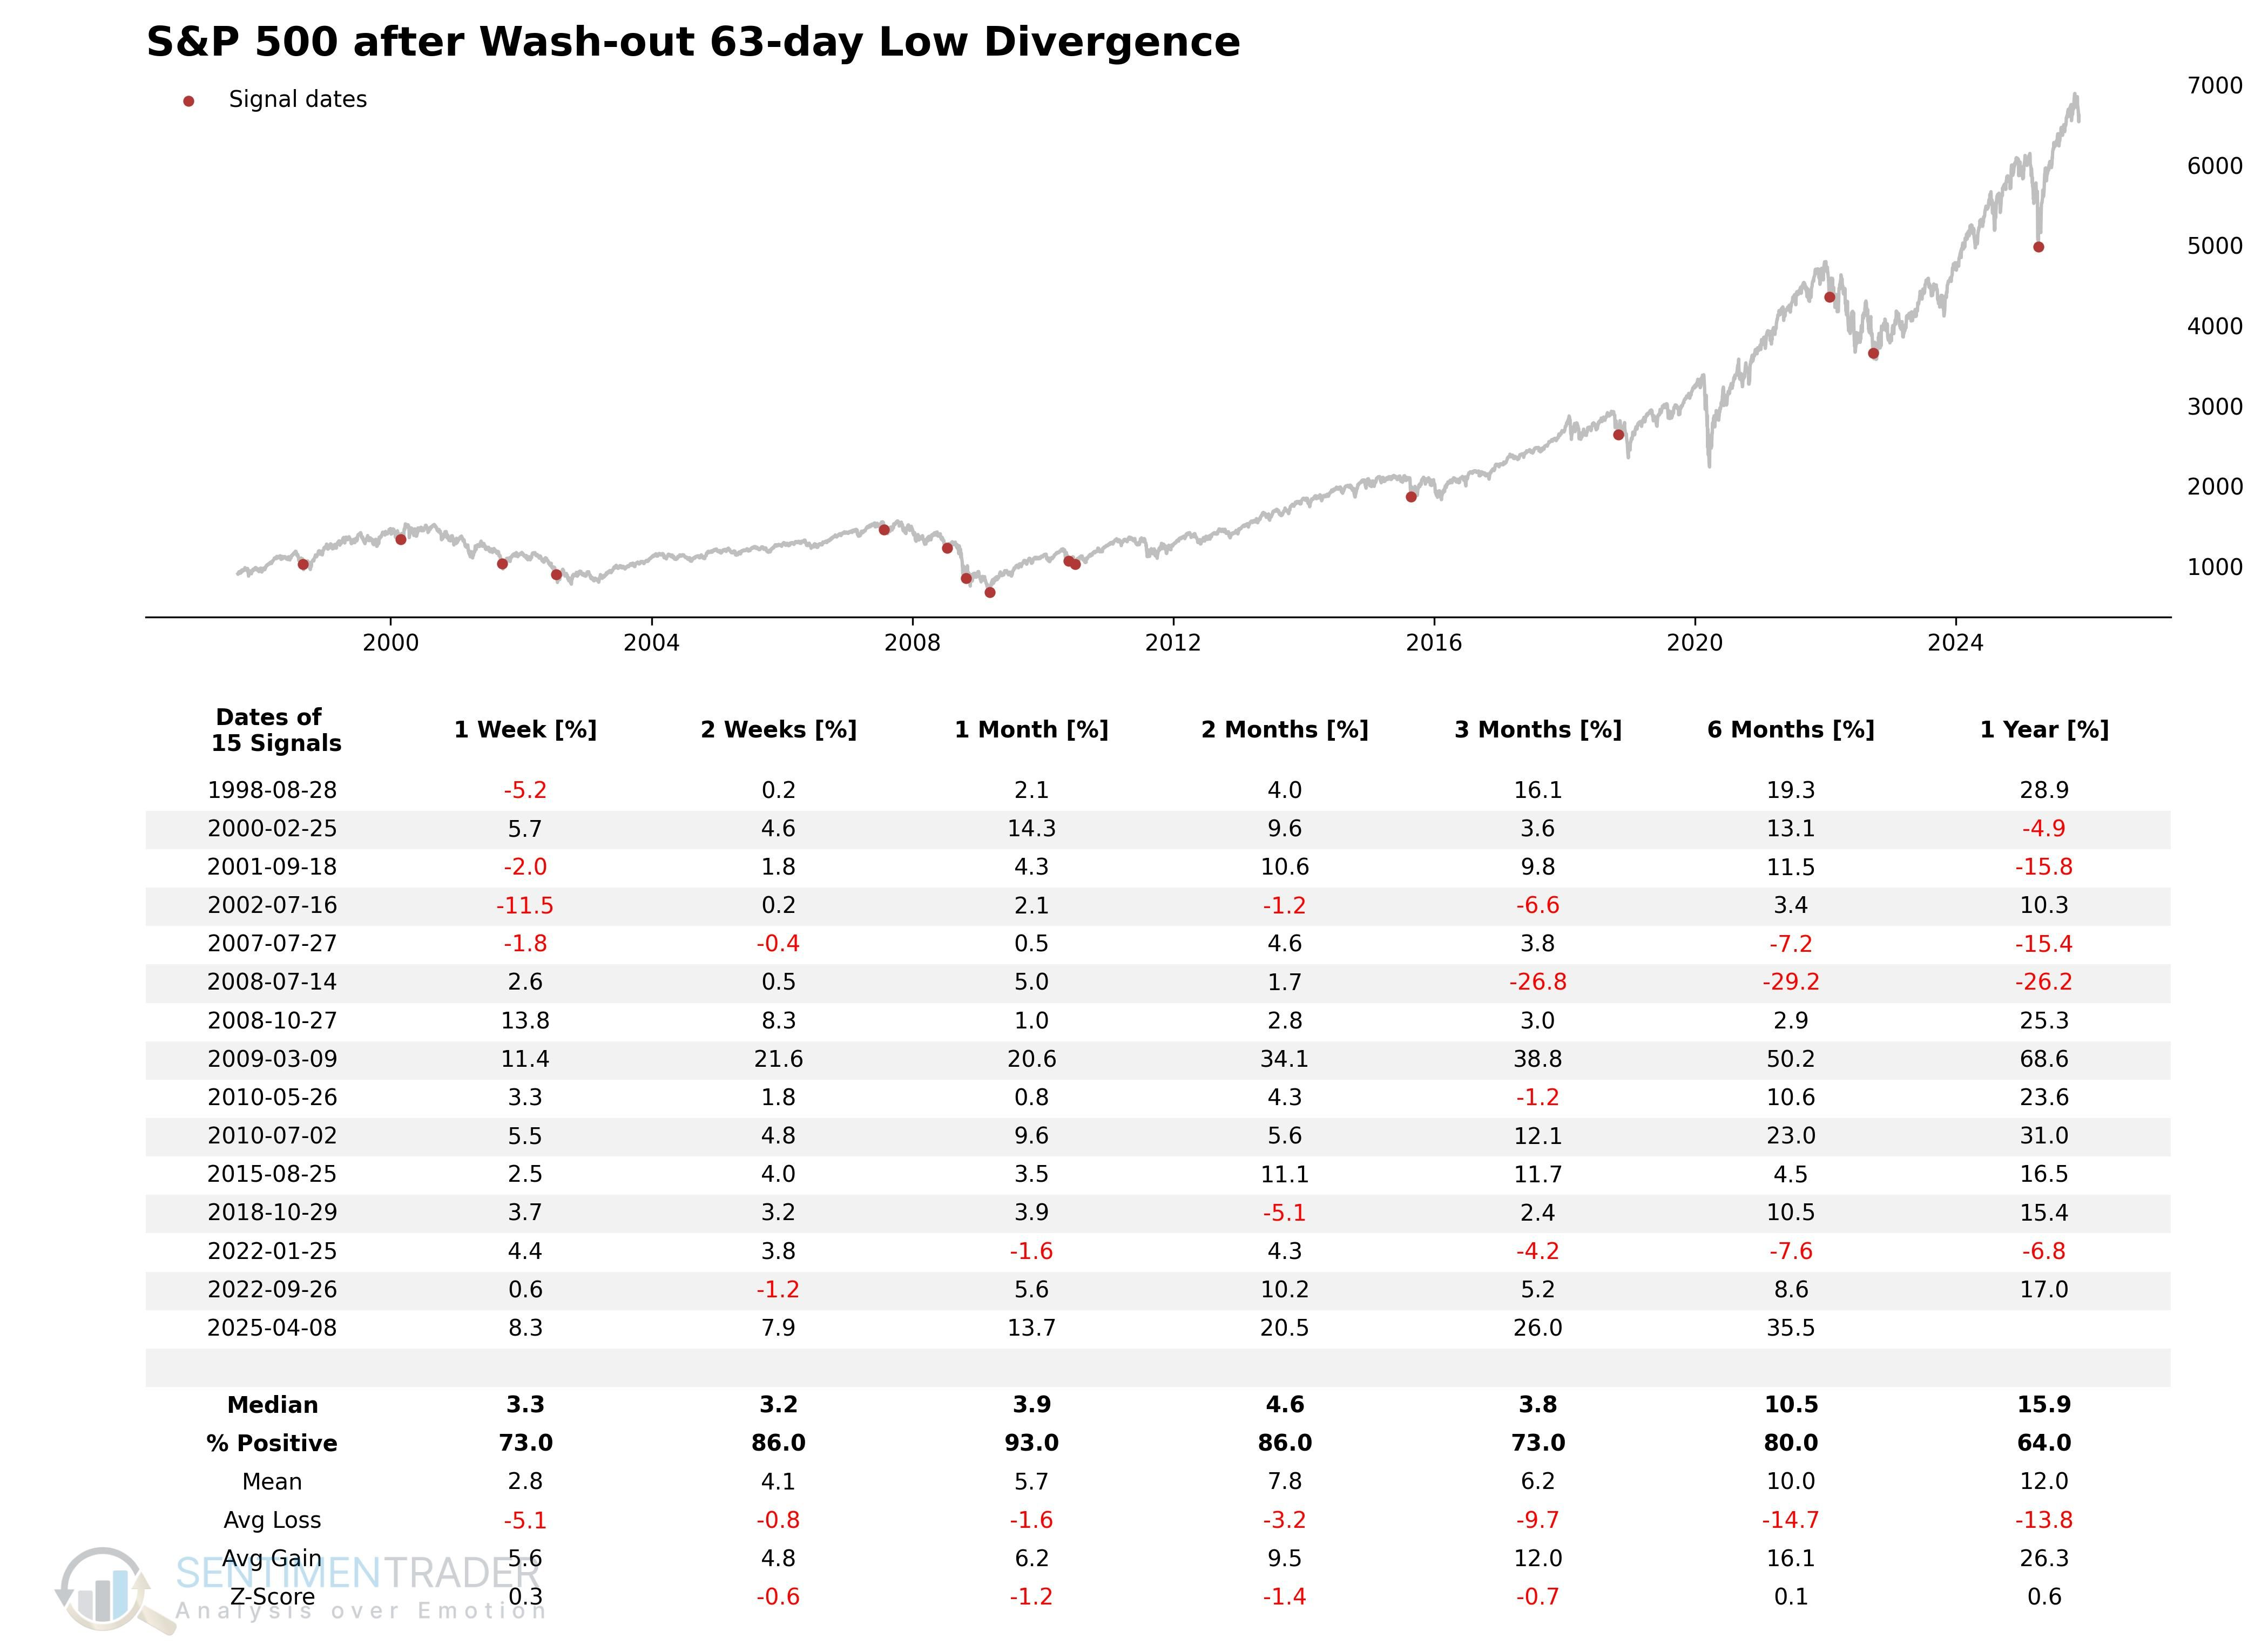
63-Day Low Divergence - focuses on intermediate-term corrections:
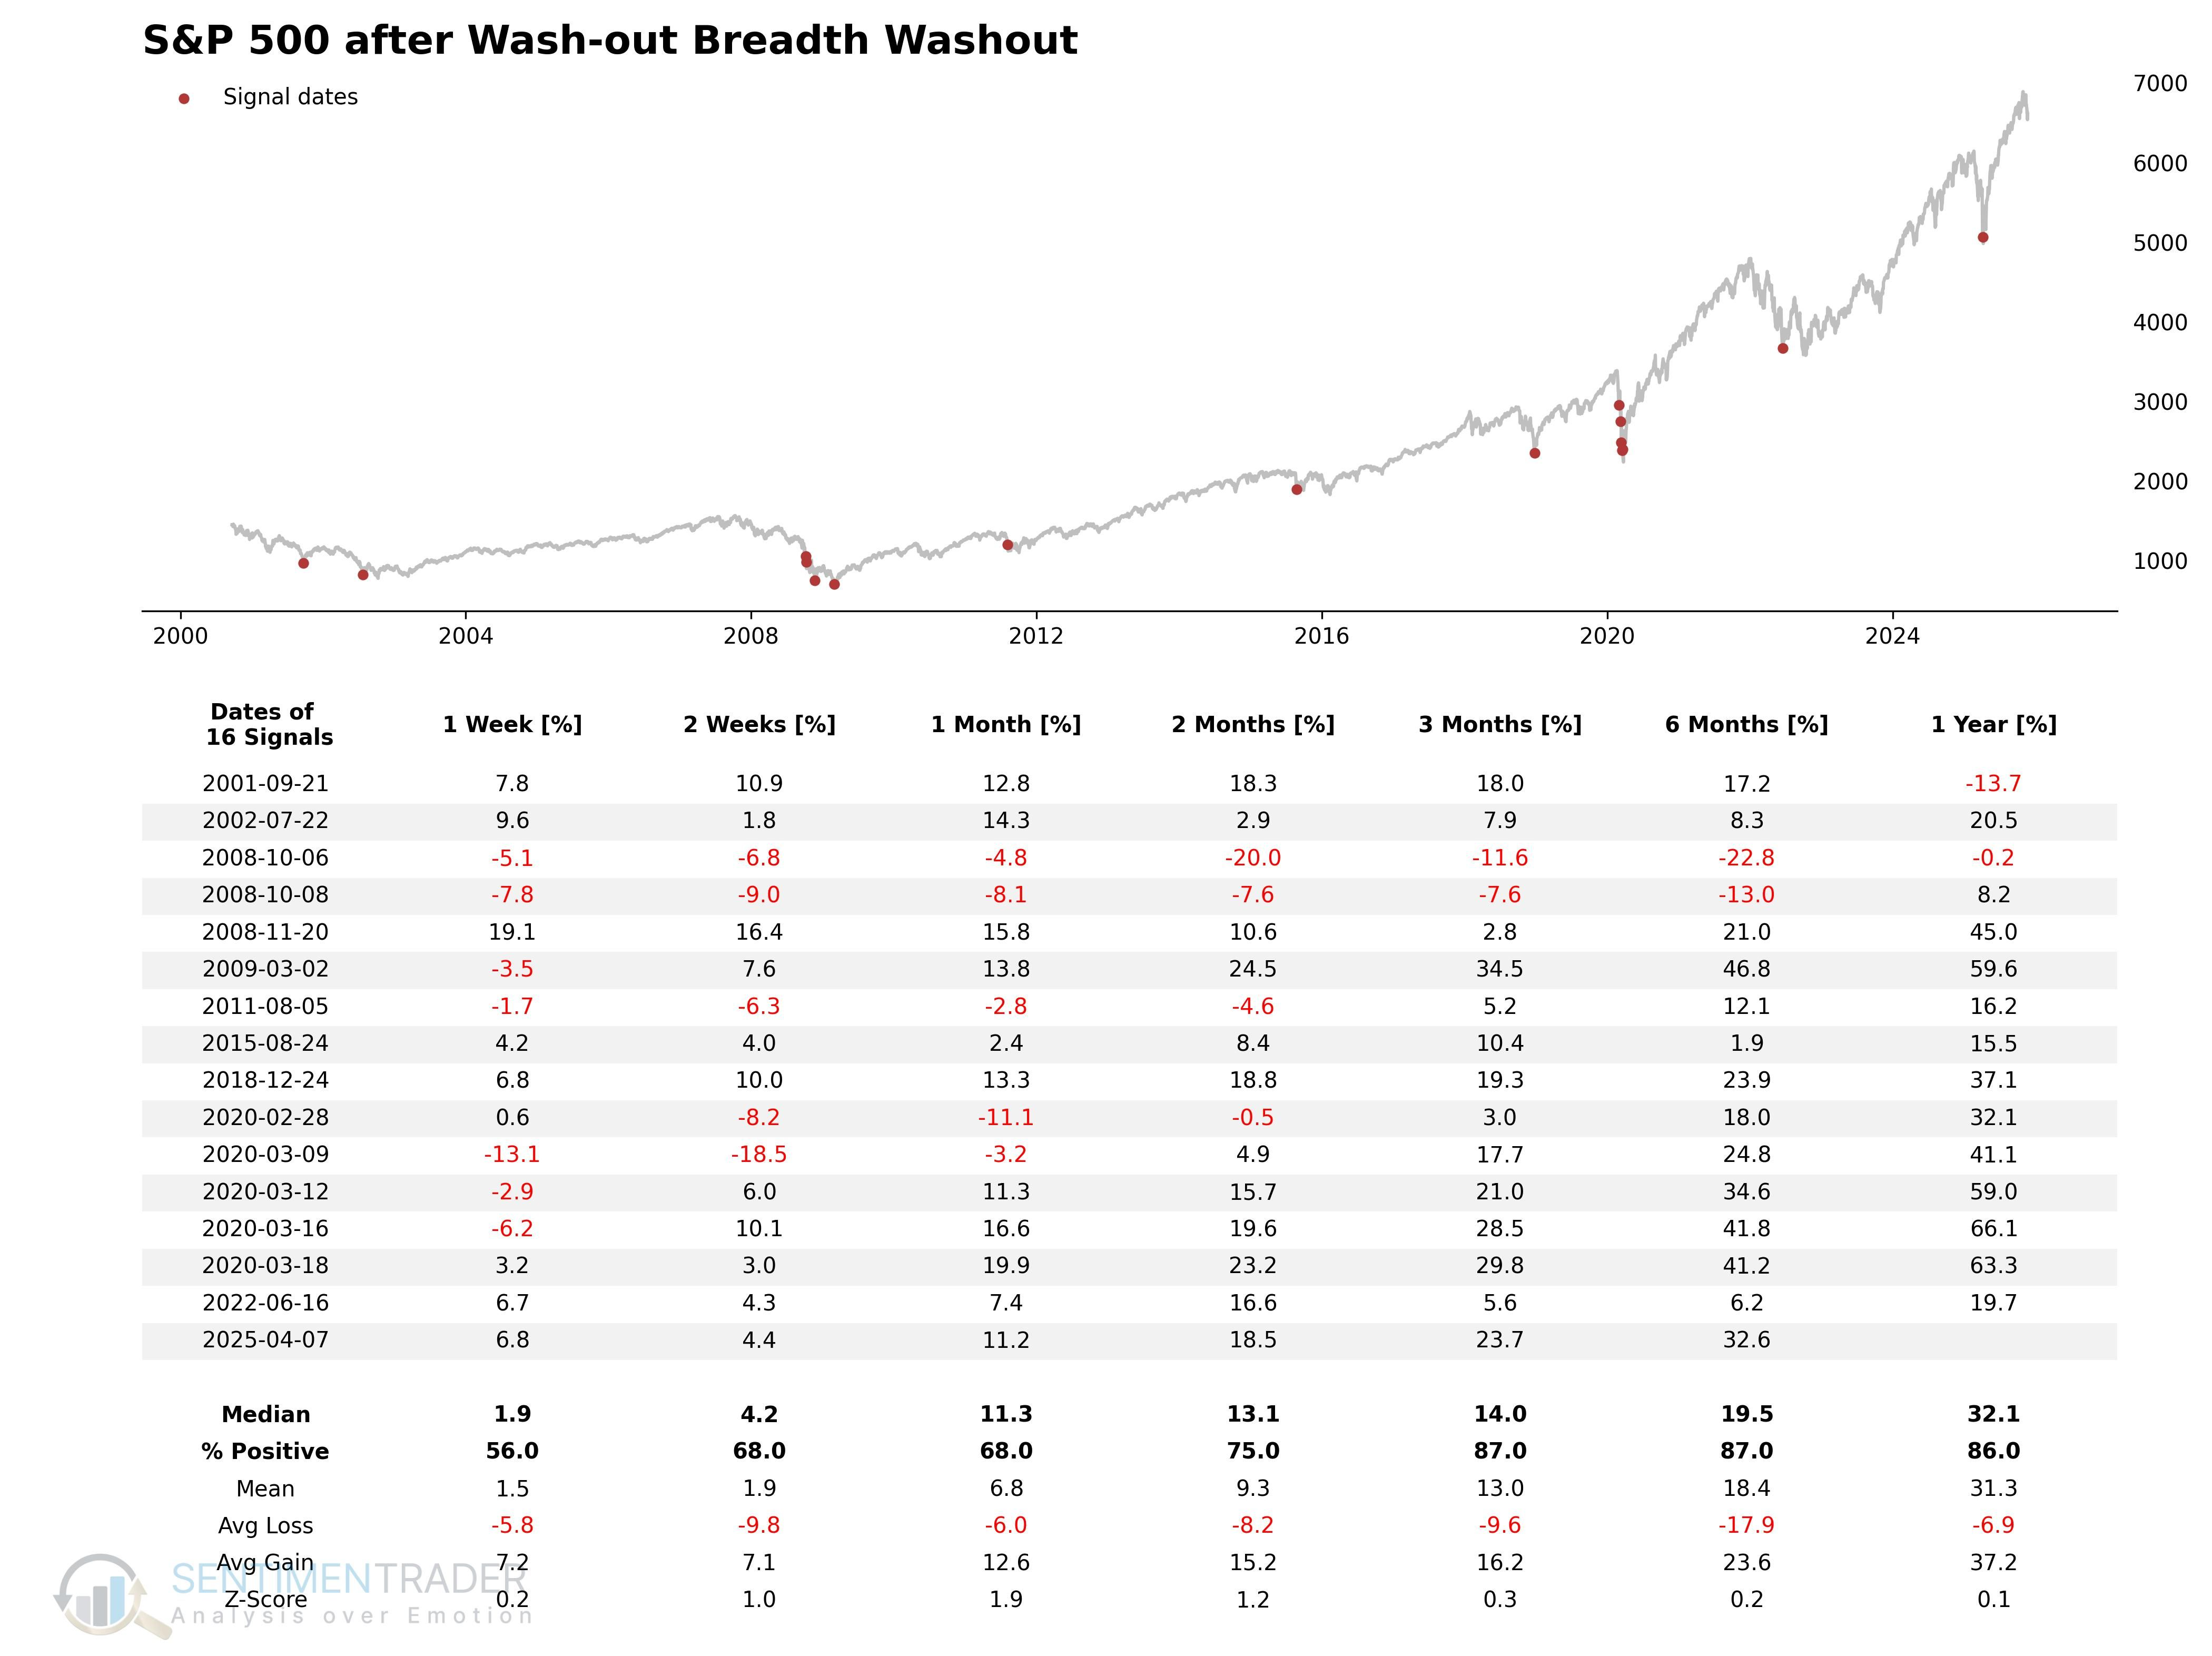
Breadth Washout - combines multiple breadth dimensions to identify capitulation:
Explore more content on our website.
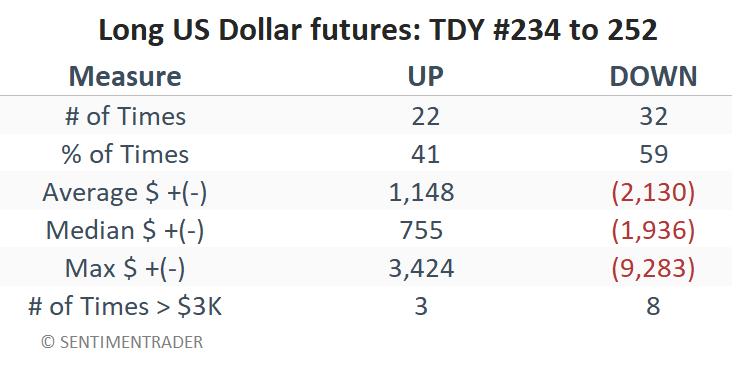
Commodities speculation opportunities
US Dollar shows seasonal weakness from Nov 25-Dec 19:
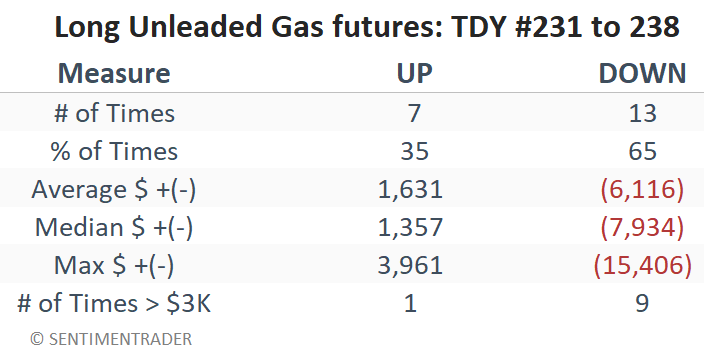
Unleaded Gas vulnerable to downdraft from Nov 24-Dec 3:
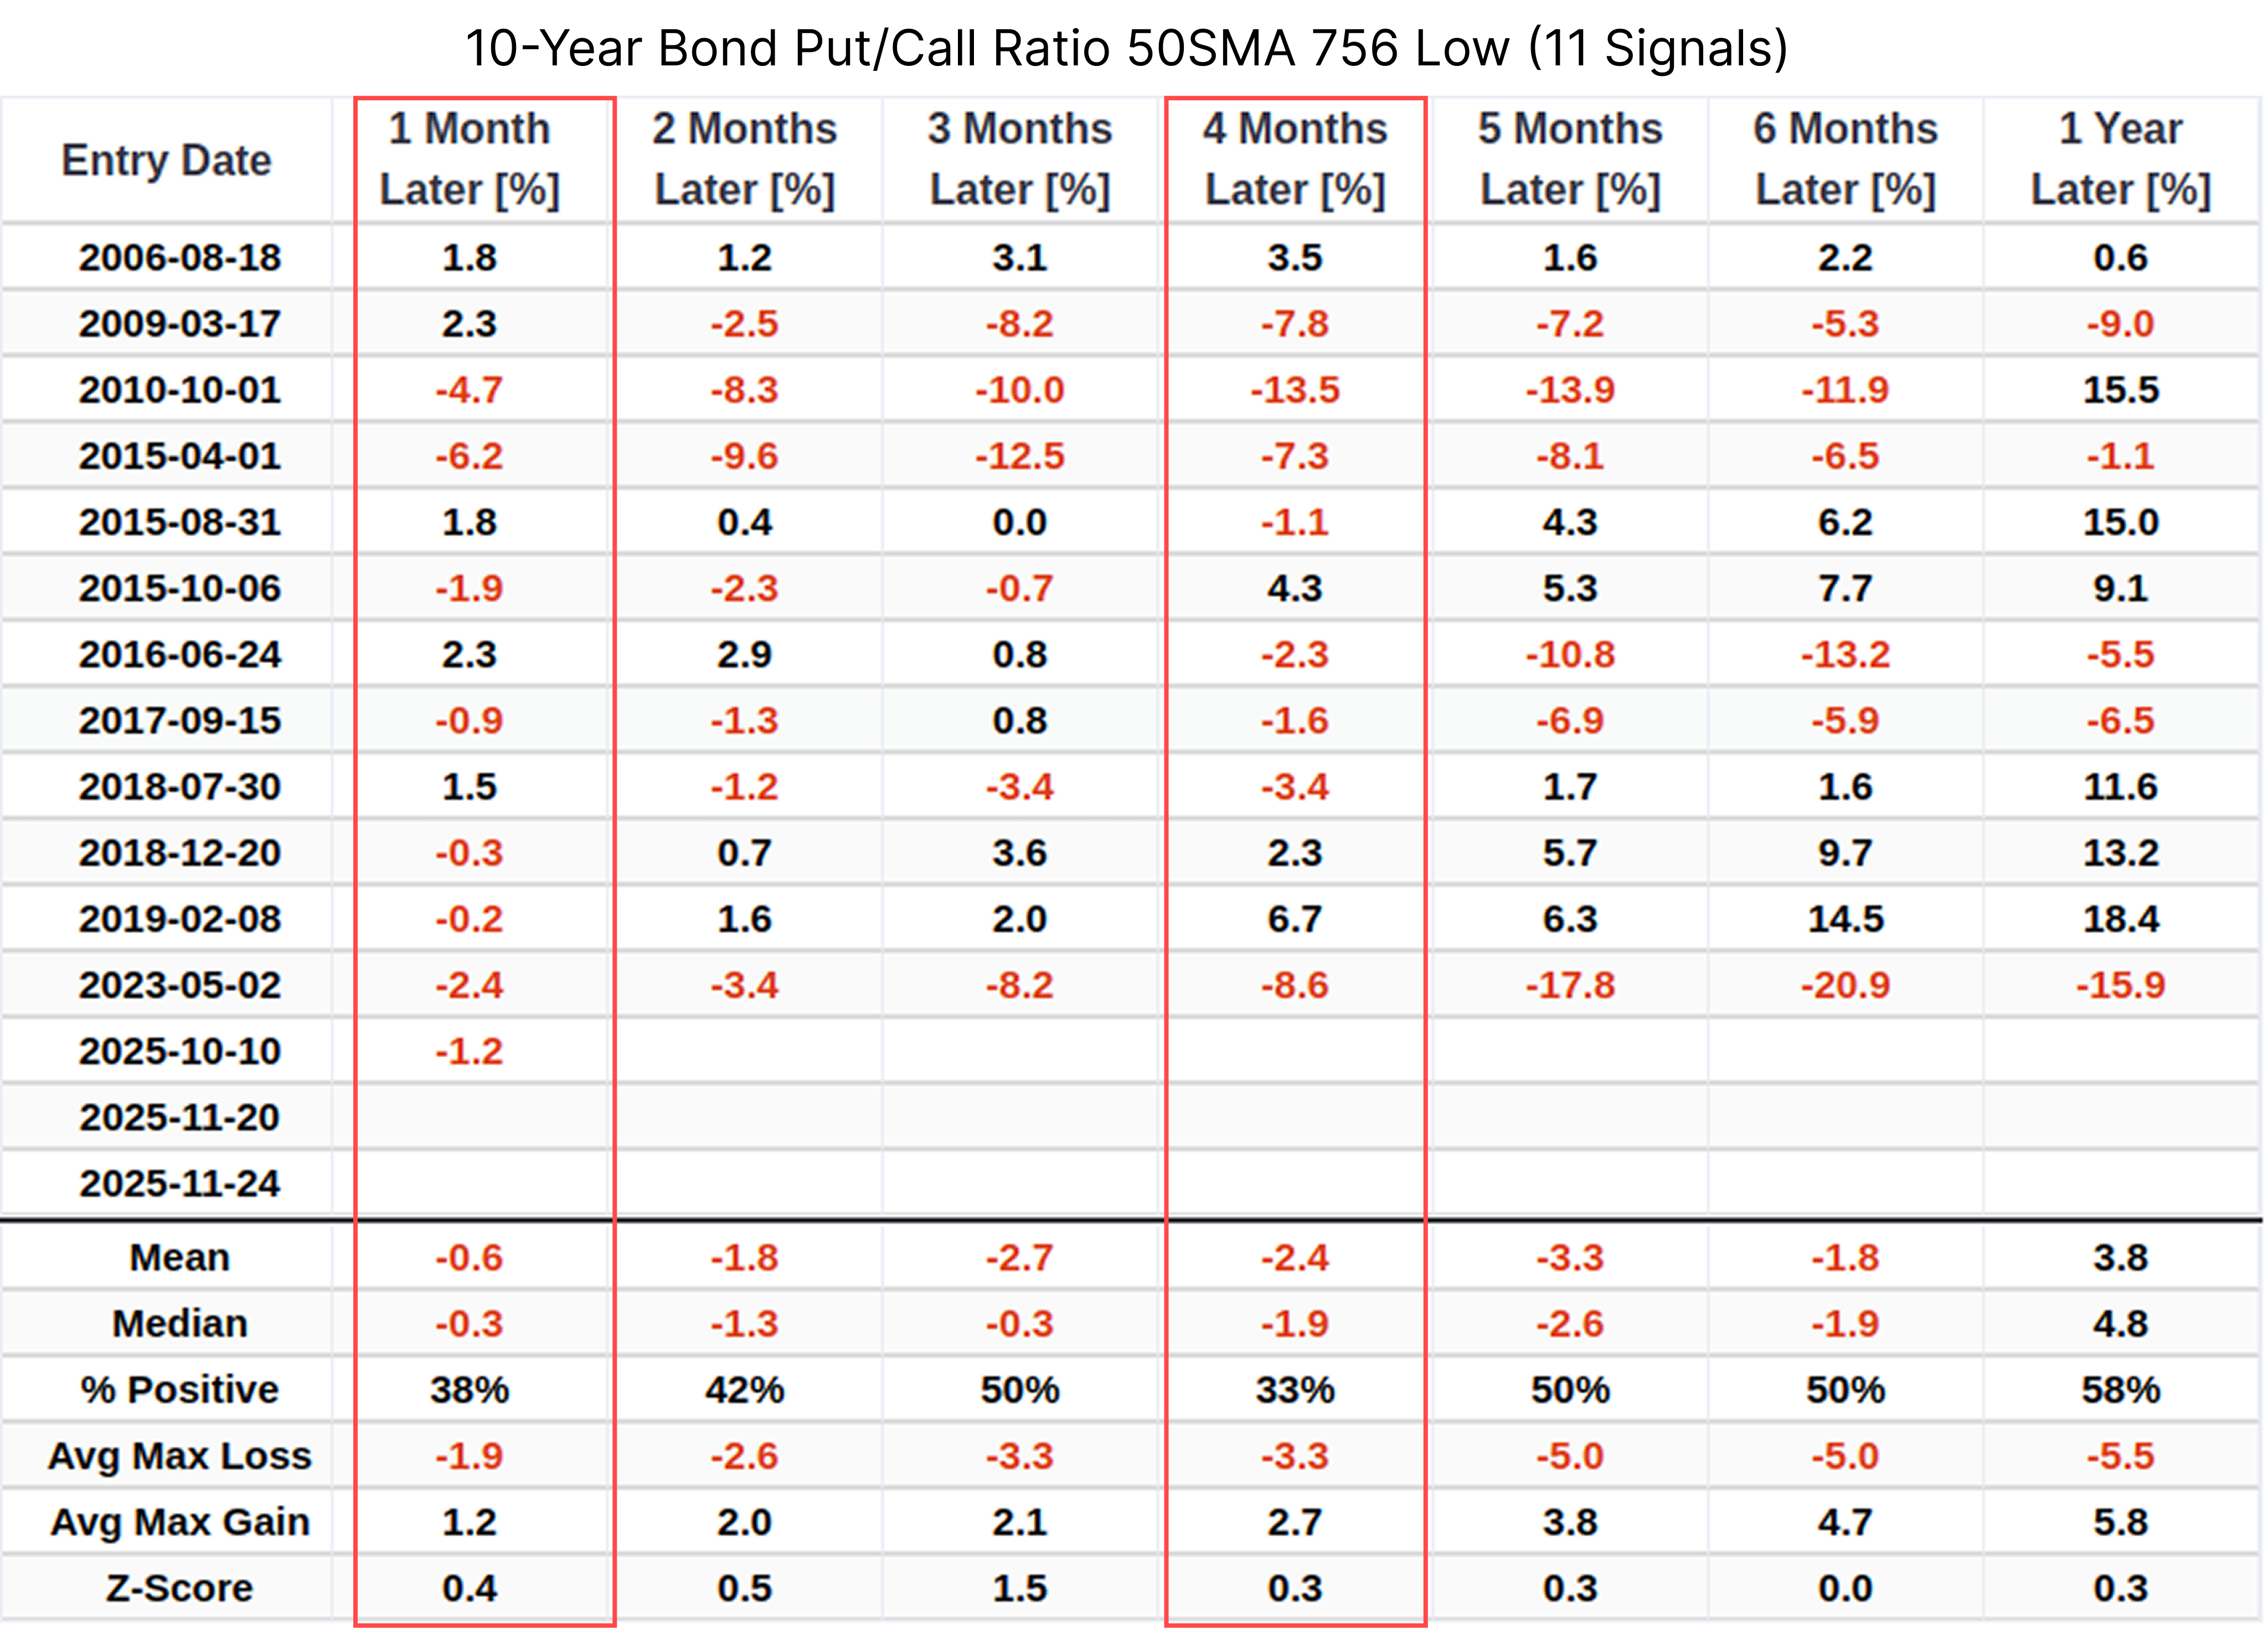
Bond option sentiment signals crowding
10-year Treasury Put/Call Ratio 50-day MA at 3-year low suggests crowded long positions:
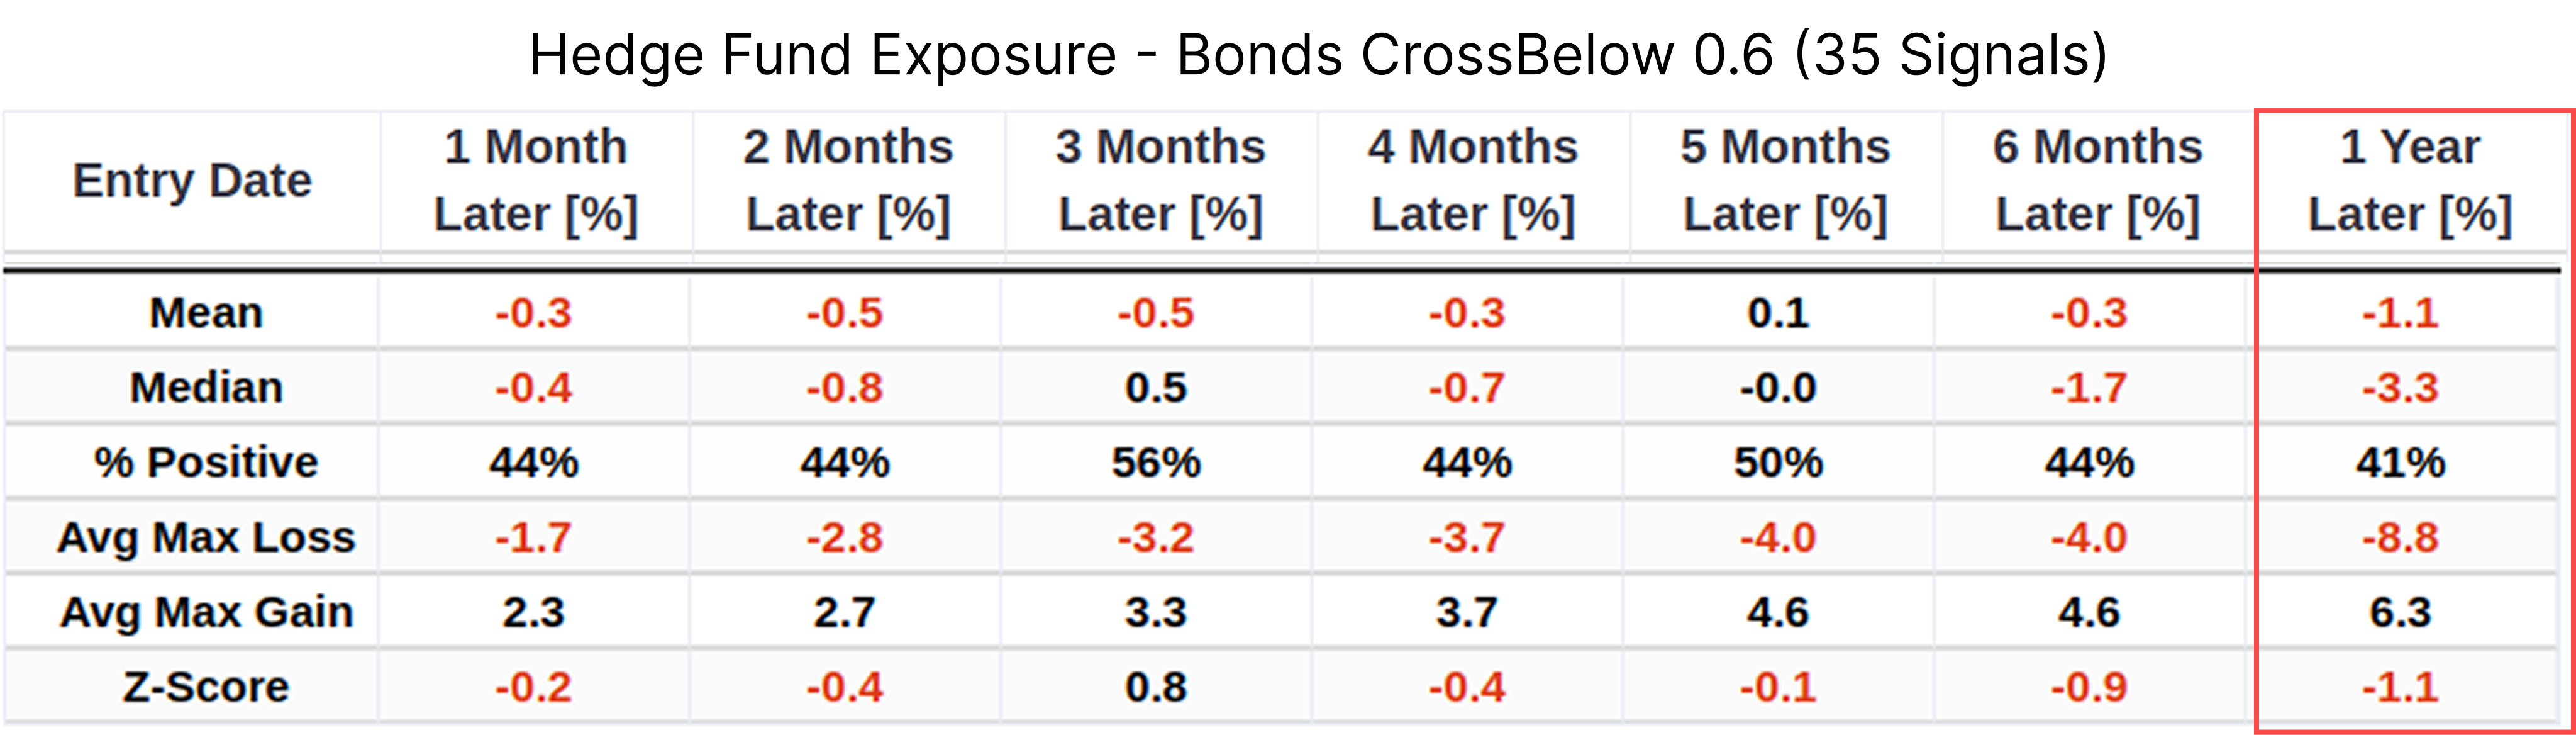
Hedge funds reducing bond exposure while retail sentiment remains elevated:
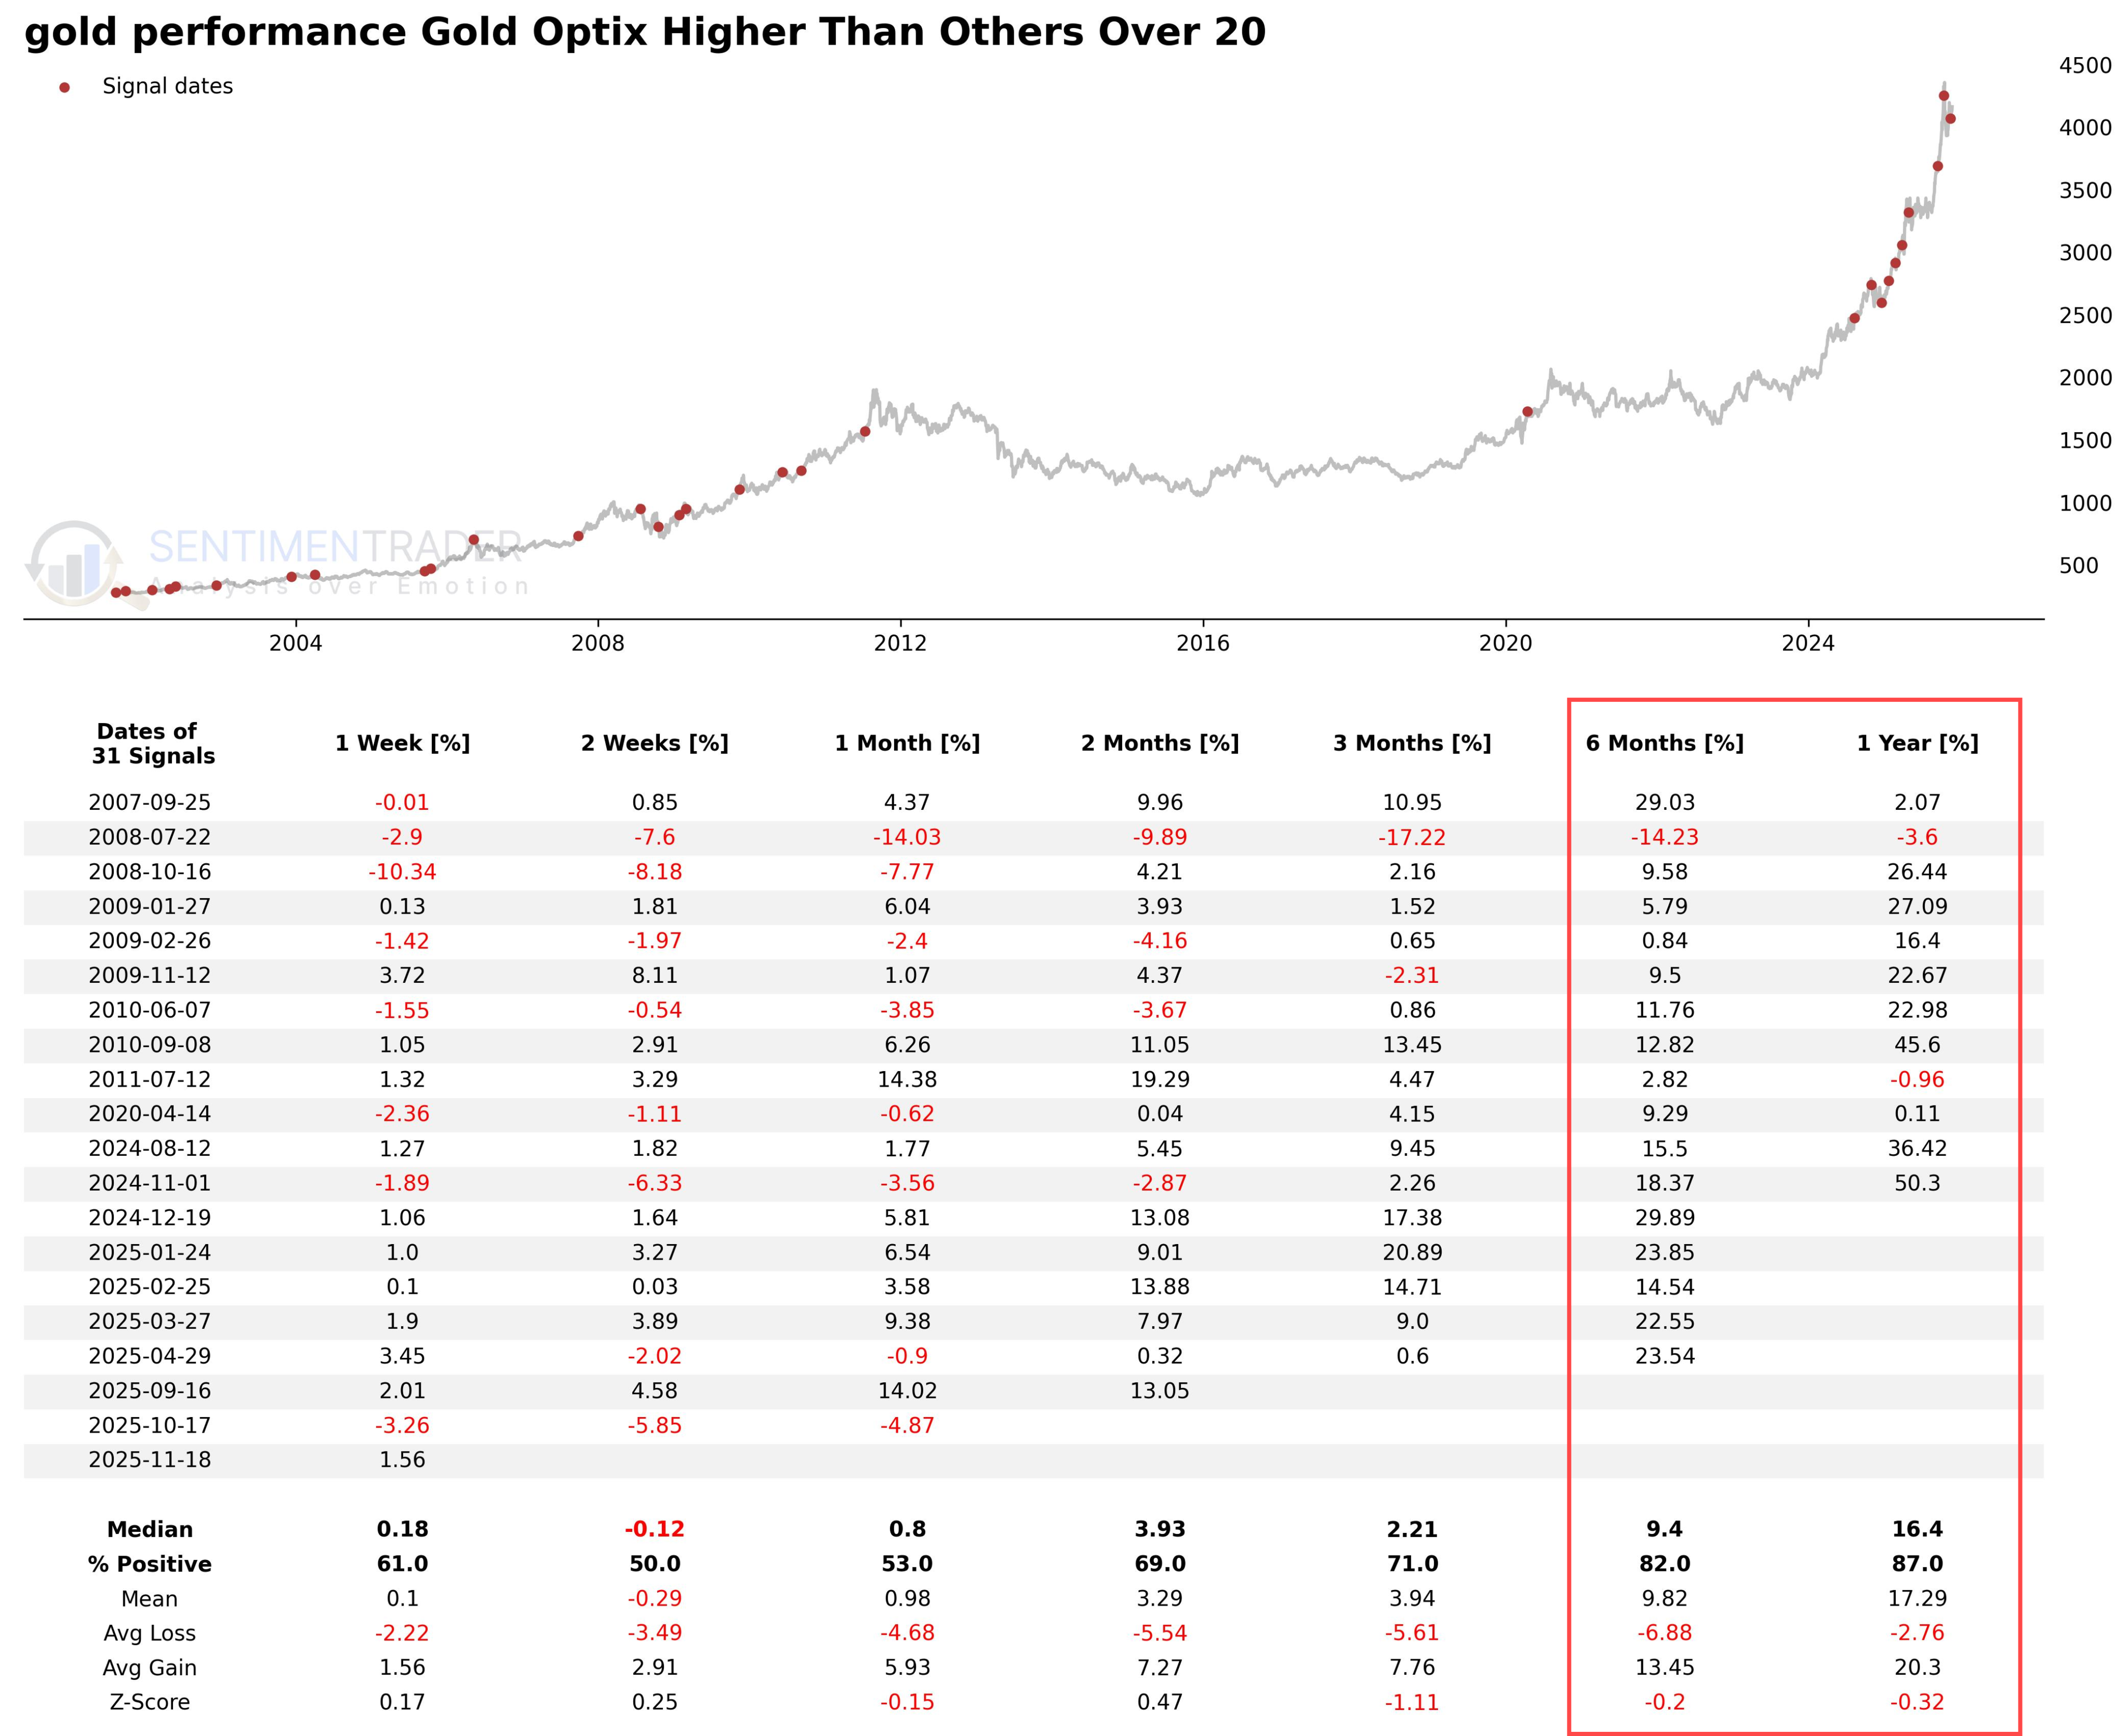
Gold sentiment remains elevated
Gold sentiment outpacing stocks, bonds and oil - historically a continuation signal for gold bull markets:
About TradingEdge Weekly...
The goal of TradingEdge Weekly is to summarize some of the research published to SentimenTrader over the past week. Sometimes there is a lot to digest, and this summary highlights the highest conviction or most compelling ideas we discussed. This is NOT the published research; rather, it pulls out some of the most relevant parts. It includes links to the published research for convenience, and if you don't subscribe to those products, it will present the options for access.