
TradingEdge Weekly for Nov 21- Bitcoin negative momentum, Corporate Insider Activity, TCTM Risk Warning Model, Crude Oil trends

Key points:
- Bitcoin shows negative momentum and fearful sentiment
- Bullish corporate insider activity in Nasdaq 100 and key sectors
- Deconstruction of Sentimentrader's TCTM Risk-Warning Model components
- Crude Oil's unfavorable seasonal trends
- Short-term trading opportunity in late November
House view:
- Stocks:
- Short-term: Bearish. U.S. tech and AI-related stocks face a confidence crisis, with key sector names declining amid doubts over the sustainability of capital expenditure returns. Market sentiment swings sharply as investors reassess valuations, triggered by bearish views on data center investment profitability. Capital rotates toward defensive sectors (healthcare, consumer staples) with rigid demand, while rate-sensitive real estate sectors underperform. Nvidia's better-than-expected earnings and upbeat guidance temporarily ease selling pressure, validating the durability of AI infrastructure demand. Sentiment remains constrained by uncertainty over delayed economic data and shifting Fed policy expectations. This time frame covers 1 - 4 weeks.
- Intermediate-term: Bearish to Neutral. Stagflation risks (slowing growth paired with persistent inflation) create a polarized market environment. High-valuation growth stocks face pressure from rising long-term rates, while sectors linked to physical assets benefit from inflation hedging demand. The Fed's policy dilemma-balancing growth concerns and sticky inflation-adds ambiguity, though AI infrastructure spending remains a structural support. Sector rotation intensifies, with no clear directional edge for the broader market. This time frame covers 1-5 months.
- Long-term: Bullish . Structural growth drivers are anchored by AI infrastructure buildout and the global de-dollarization trend. The market's focus evolves from AI applications to critical physical enablers (energy, utilities, hardware) as supply constraints emerge as key bottlenecks. Long-term breadth improves as undervalued segments narrow their valuation gap, while tangible asset-backed equities gain traction as alternative stores of value. Central bank asset purchases and shifting monetary regimes further reinforce this trend. This time frame covers 6-12 months.
- Cyclical momentum favors AI infrastructure, energy, and utilities-resilient to short-term volatility due to structural demand.
- Defensive resilience persists in sectors with stable demand and inflation-hedging properties.
- Very long-term (one year+) valuation favors mean reversion to Small Cap Value, which is seen as extremely undervalued compared to overvalued Large Cap Growth
- Bonds: Long-term cycles remain bearish.Treasury yields fluctuate sharply as market pricing of Fed policy shifts dramatically. Long-term yields rebound amid concerns over fiscal deficits and increased issuance needs post-government shutdown, while short-term yields remain anchored by lingering rate-cut expectations. Safe-haven flows provide temporary support during equity market turbulence, but persistent inflation and fiscal sustainability concerns limit sustained rallies. No clear trend reversal signals have emerged.
- Commodities: A massive divergence is underway. Despite expectations of interest rate cuts and the ongoing decline in U.S. stocks, which have weighed on precious metals due to liquidity concerns, an effective commodity trend model trend models indicate a bullish outlook. Crude oil prices fluctuated within a narrow range, influenced by both geopolitical risk premiums and weak global demand growth. Supply-side concerns stemming from regional tensions were offset by rising inventories and signals of sluggish consumption. Oil seasonality is weak for the next month.
- Crypto: We follow several simple systems for bitcoin, which we consider the equivalent of the S&P 500 for crypto. Due to bitcoin's explosive growth over long periods, it's dangerous to equate neutral conditions with being bearish for some of these. However, if a system is "out," we consider it bearish for this summary.
- Triple 40: Bearish
- RSI Momentum: Bearish
- Trend and Relative Trend: Bearish
- PMI: Bearish
- M2 ROC: Bullish
- Notable Moves in Global Markets :
- Japan (Nikkei 225): Rallies to key psychological levels, fueled by gains in AI supply chain stocks (semiconductor equipment, materials), corporate governance reforms (stock buybacks), and yen weakness supporting export competitiveness. It subsequently retreated on Friday.
- South Korea (KOSPI): Experiences extreme swings-foreign investors engage in record selling amid global tech sector concerns, but rebounds on positive AI demand signals (Nvidia's earnings) as local firms dominate critical HBM supply chains. Samsung's strategic expansion into U.S. fintech adds new growth dimensions, with valuations becoming attractive post-sell-off.
- Hong Kong (Hang Seng): Demonstrates resilience at key levels, supported by China's accommodative monetary policy, targeted property sector support (mortgage subsidies, tax rebates), and persistent valuation advantages attracting capital to high-dividend state-owned enterprises.
- Europe (STOXX 600): Mixed performance-tech stocks rebound with U.S. peers on AI demand validation, but regional sentiment is weighed down by UK stagflation (weak GDP growth, manufacturing contraction) and challenging central bank policy trade-offs.
Where we're at
Most investors have the most riding on equities. We feel that the most significant determinants of success for investors are whether to adjust their allocation to that asset class based on factors that have historically had a good record of preceding above- or below-random returns in the months ahead.
Those factors include the probability of a looming recession, sentiment, price action, volatility, breadth, and the bond market. The chart below summarizes the main indicators and composite models we watch for those factors, and they're mostly in bullish regimes. Valuations are not part of these factors since the relationship has been too inconsistent on time frames under one year.
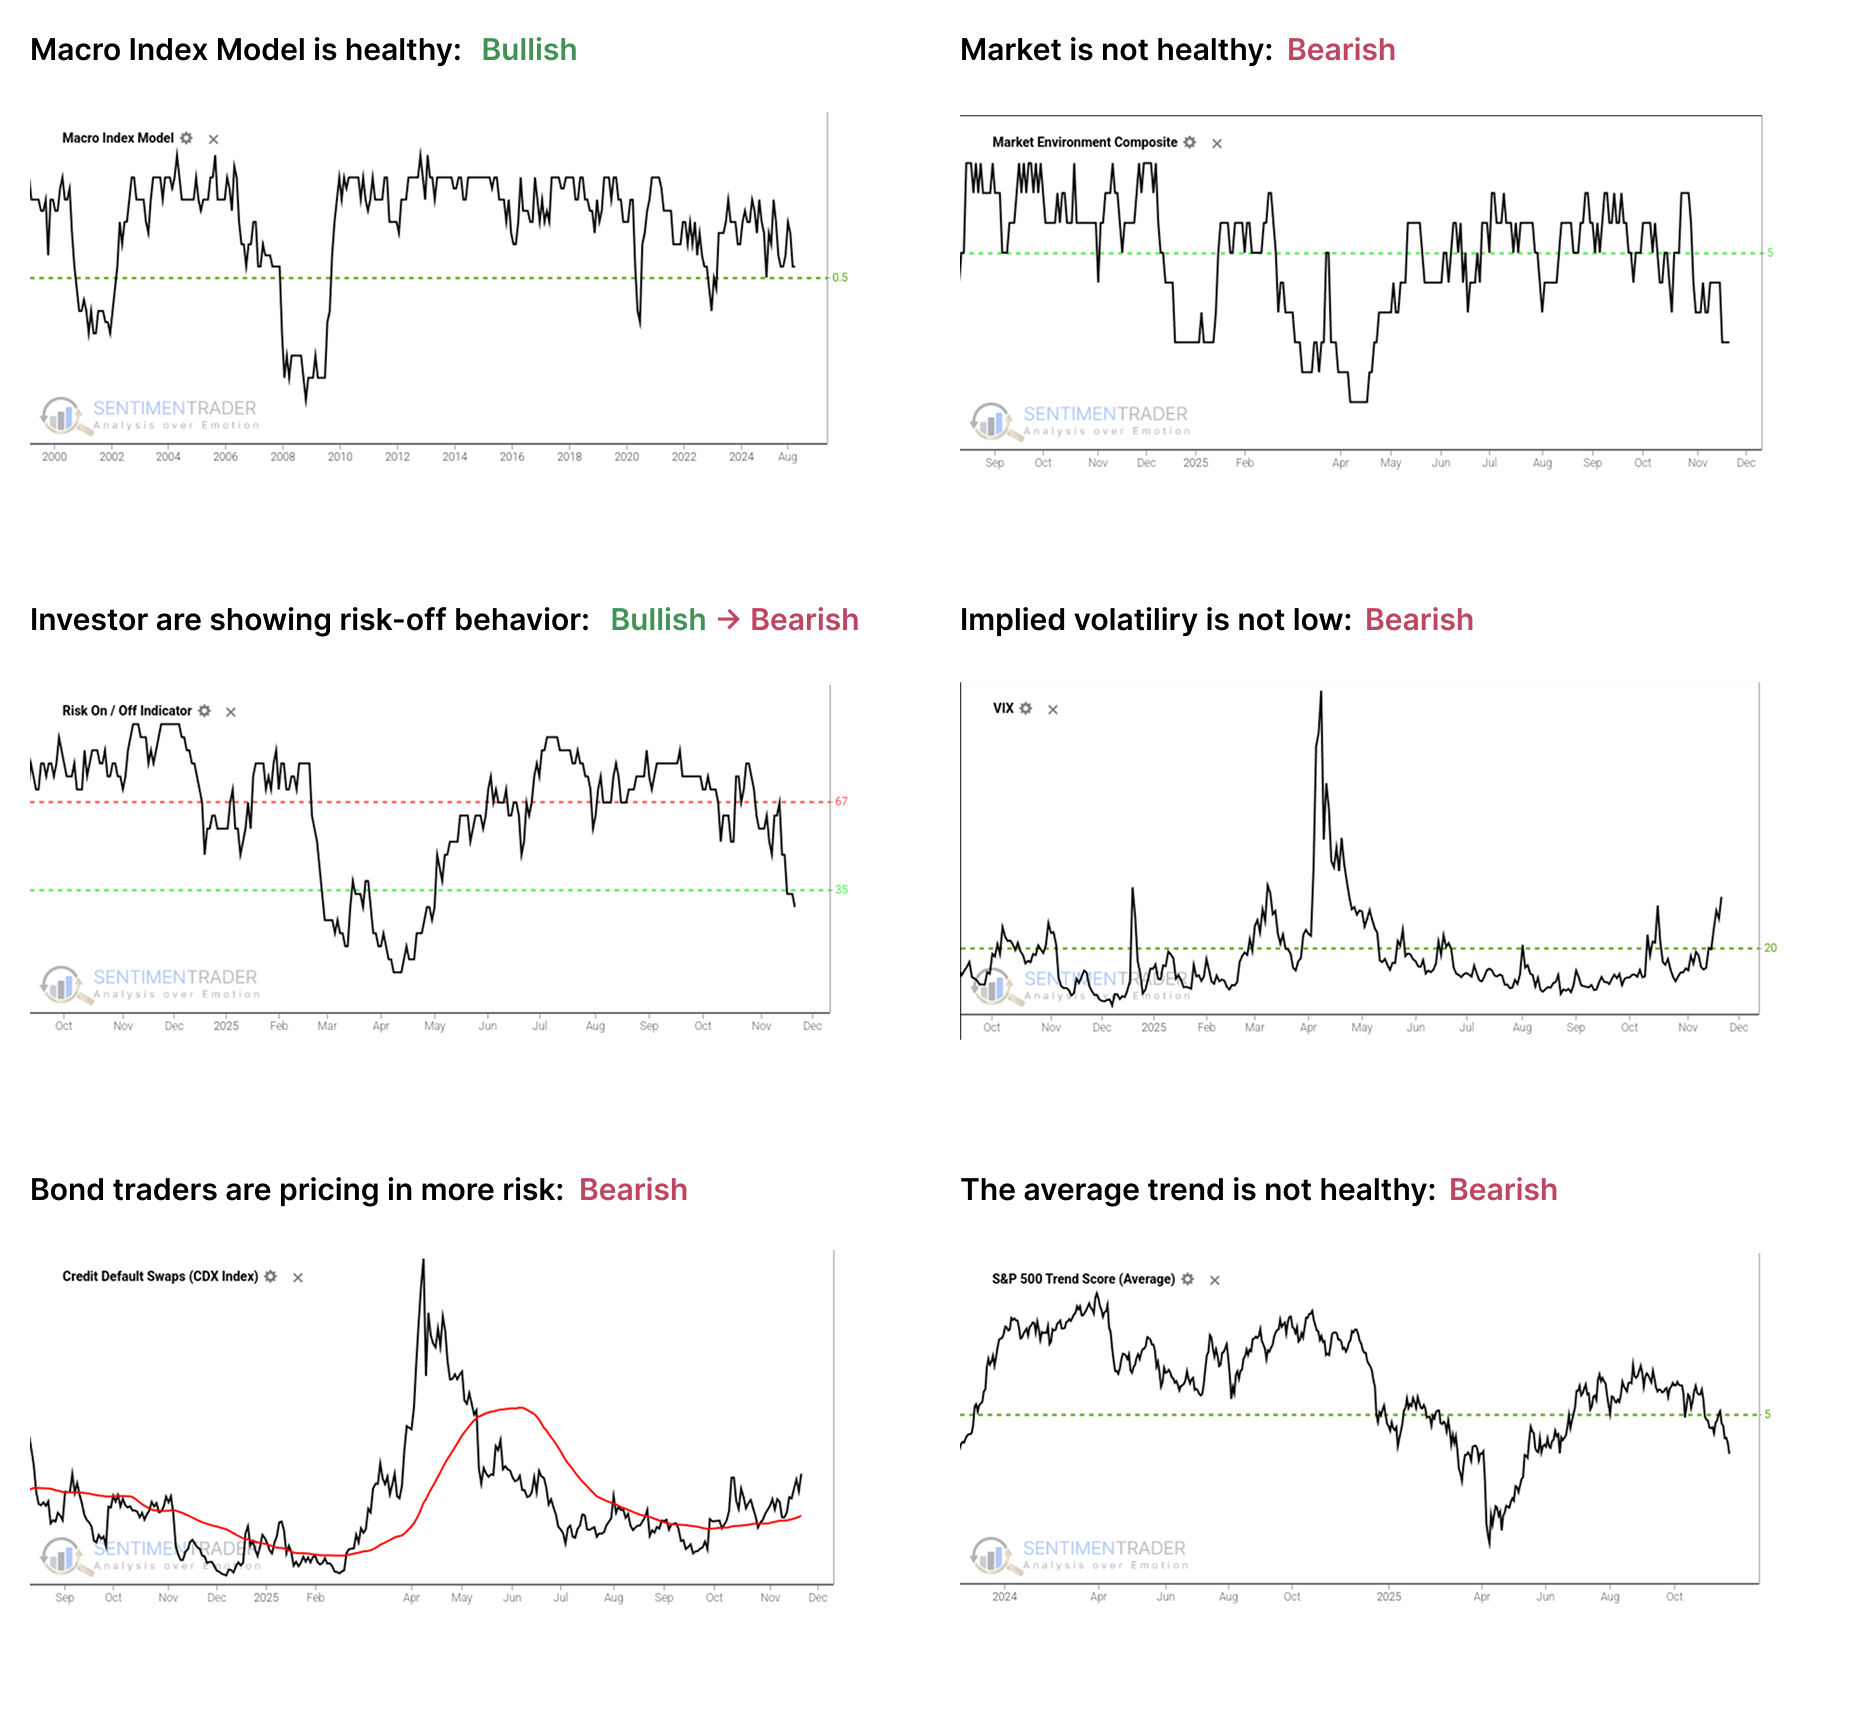
- The Macro Index Model is above the 50% threshold, which has been a vital level as outlined here.
- The Market Environment has been skittish since April, and has slipped into an unhealthy condition. Future returns, especially for higher-beta indices, have historically been notably weaker, with greater risk, when the environment is unhealthy as outlined here.
- The Risk On / Off Indicator shows that investors have shifted to risk-off mode. This serves as a warning sign for future returns as outlined here.
- Implied volatility is at or above 20, signaling a volatile environment. The S&P 500 has historically performed poorly when this is the case, as outlined here.
- Credit default swap spreads are above their 50-day moving average, which is modestly concerning as outlined here.
- A composite of trend measures in SPY and the average S&P 500 stock remain below 5, which show unhealthy trend conditions.
Since April, the most compelling studies have had a strongly bullish bias on longer time frames. You can follow these through the Active Studies page. From time to time, when the analysts' studies provide an overwhelming message, it will override the charts above, but there has been no consensus in the studies to suggest overriding the bullish environment.
Other major markets have been mostly rangebound for four months, and there is little among what we follow to suggest a compelling edge either way.
Bitcoin shows negative momentum
A momentum-based RSI model for Bitcoin has shifted from a bull to a bear regime.
Sentiment has turned fearful, with the Crypto Fear & Greed Index dropping to extreme lows, a condition that has historically been bearish for Bitcoin in the short term.
Broad market breadth and trend-following systems for Bitcoin have also turned unfavorable.
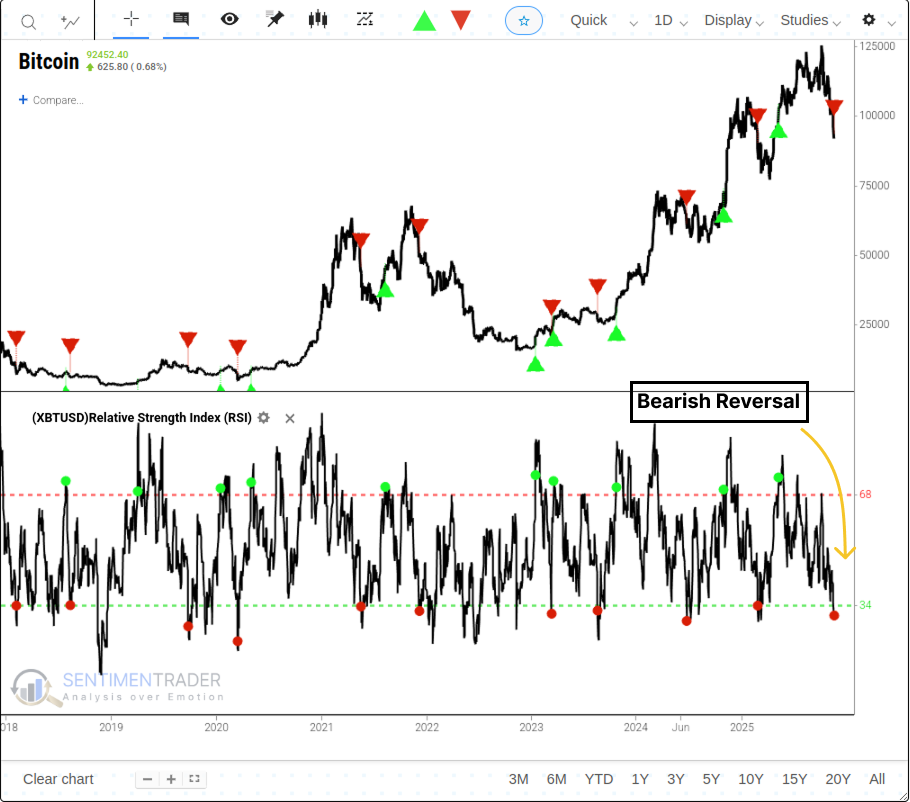
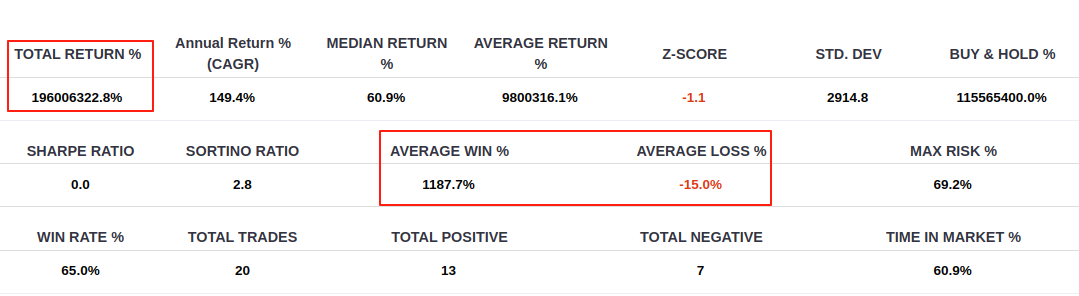
This RSI system has generated 20 buy signals in the past, with a success rate of 65%. The average win was a massive 1187.7%, while the average loss was -15%.
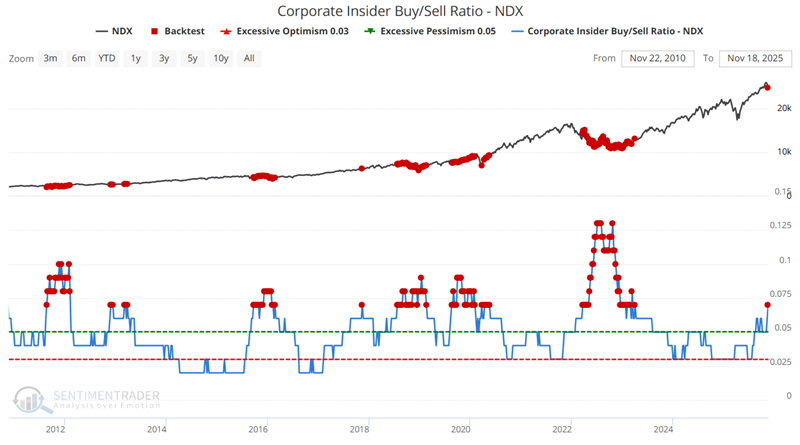
Bullish corporate insider activity
Bullish corporate insider activity is typically a favorable sign for the next one to three years.
It is especially favorable when bullish insider activity extends across an entire industry.
In recent months, insiders among Nasdaq 100 constituent stocks, and the Materials, Technology, Consumer Staples, and Healthcare sectors have been noticeably bullish in their open market buying and selling activity.
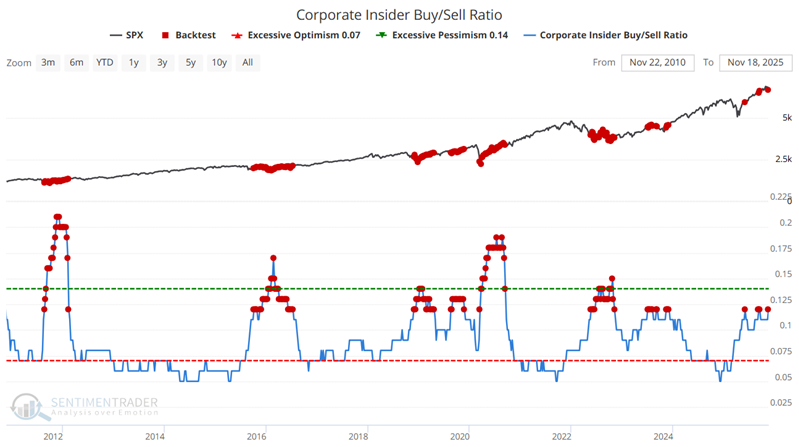
Whereas S&P 500 insiders are leaning in a favorable direction, Nasdaq 100 corporate insiders have been outright bullish of late.
Sentimentrader's TCTM Risk-Warning Model
The TCTM Risk-Warning Model is a 'weight-of-the-evidence' tool designed to quantify underlying market fragility.
This report has deconstructed six of the ten components that make up this composite model, focusing on S&P 500 internals, Financial sector weakness, cyclical divergences, and broad sentiment.
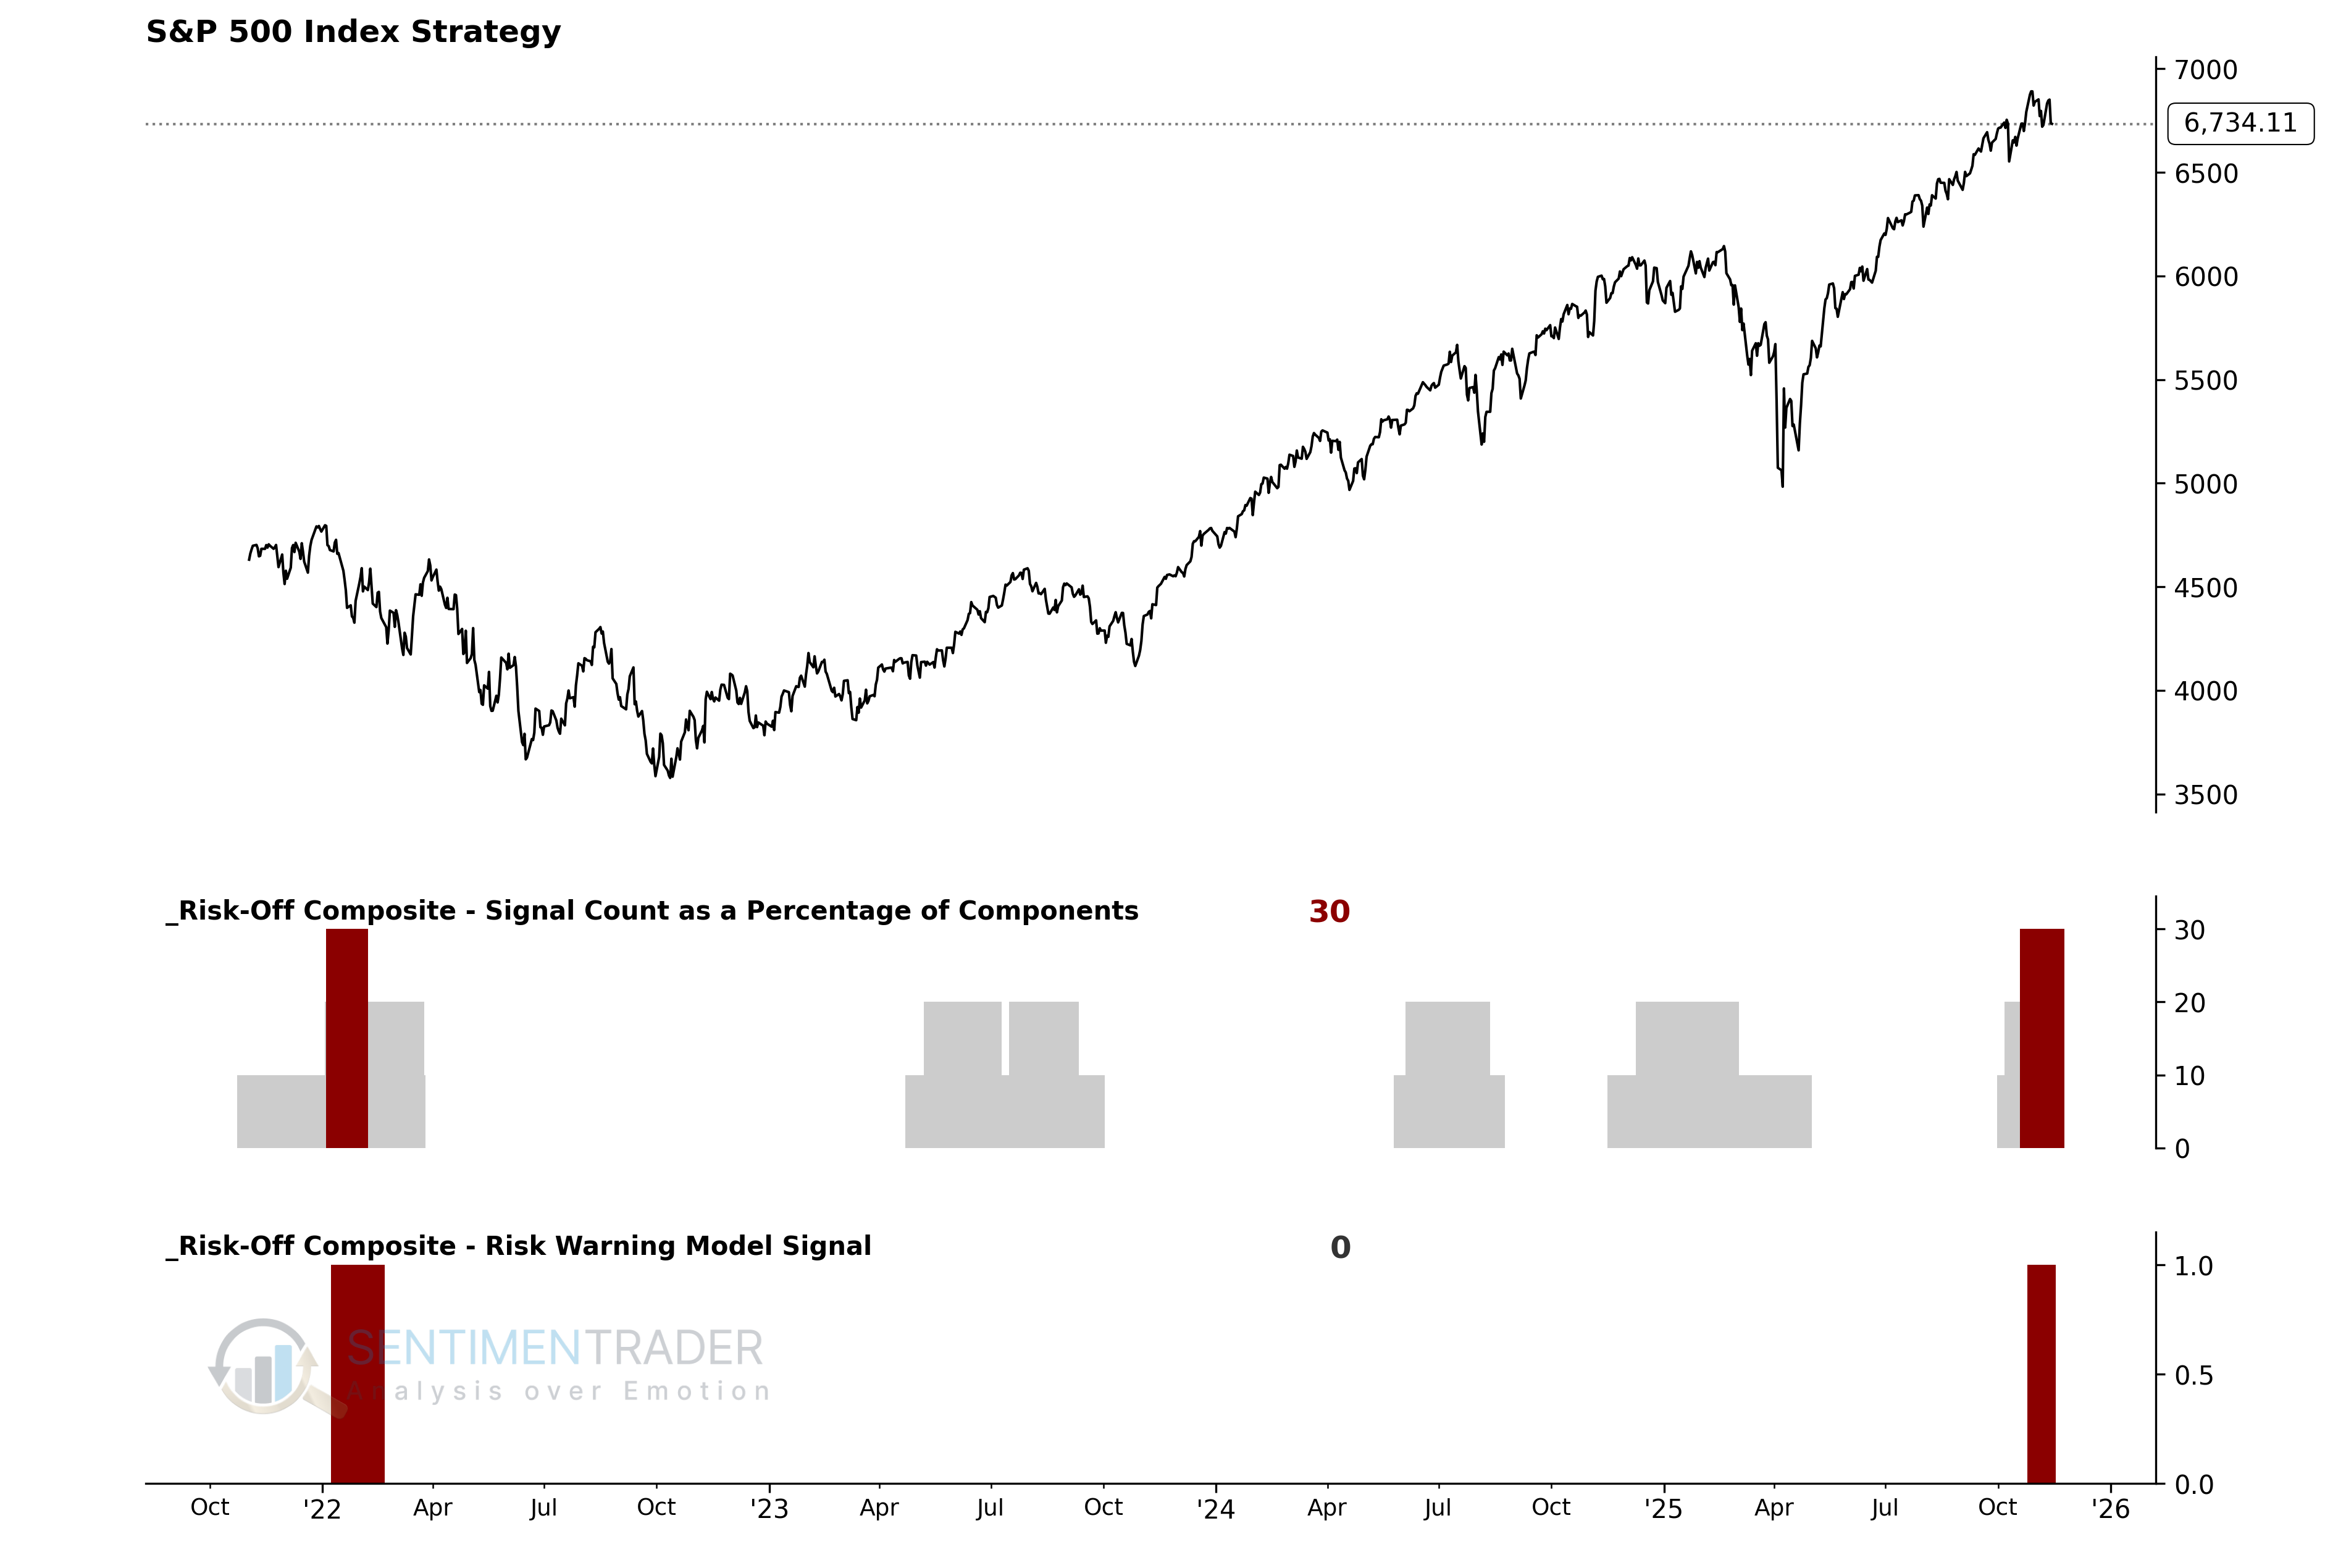
As the individual performance tables demonstrate, each component is designed to identify a specific, historically unfavorable condition.
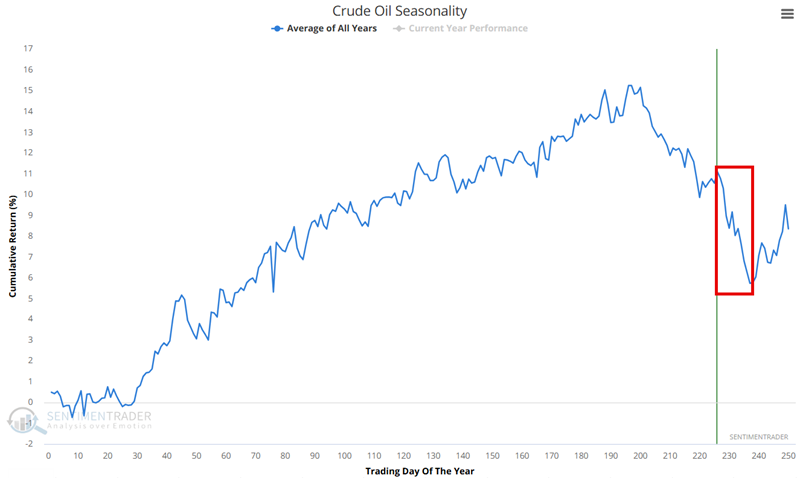
Crude Oil's unfavorable seasonal trends
The chart below shows the Annual Seasonal Trend for crude oil futures. An unfavorable period extends from the close on Trading Day of the Year (TDY) #226 through TDY #237. For 2025, this period runs from the close on November 14th through December 1st.
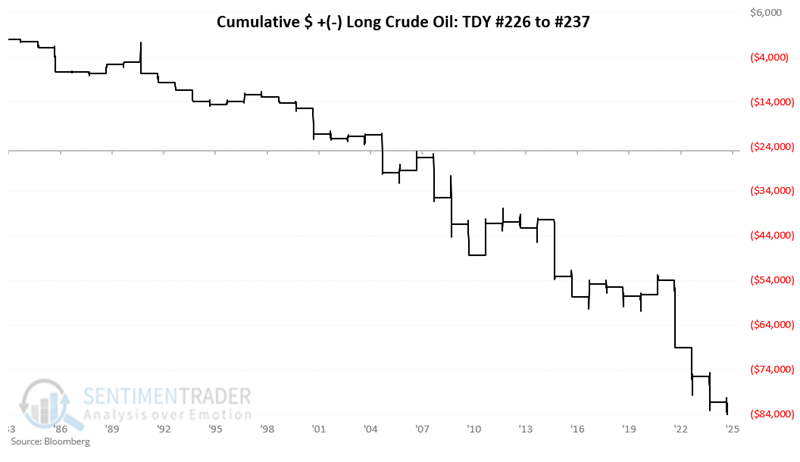
The chart below displays the hypothetical cumulative $ (+/-) achieved by holding a long position in crude oil futures only during this period, since 1983. The cumulative loss equals -$84,290c
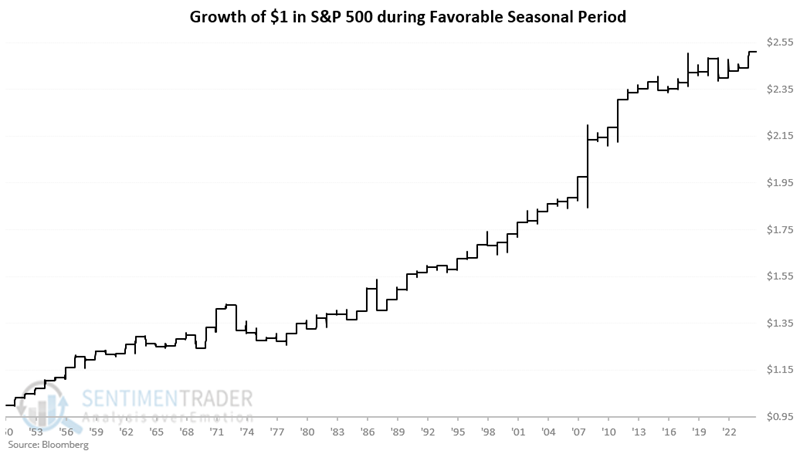
Short-term trading opportunity
The period we will consider here encompasses the following:
- The last six trading days of November
- The first three trading days of December
For 2025, this period extends from the close on November 19th through December 3rd.
The chart below displays the hypothetical growth of $1 invested in the S&P 500 Index only during this nine-trading-day period every year starting in 1951.
About TradingEdge Weekly...
The goal of TradingEdge Weekly is to summarize some of the research published to SentimenTrader over the past week. Sometimes there is a lot to digest, and this summary highlights the highest conviction or most compelling ideas we discussed. This is NOT the published research; rather, it pulls out some of the most relevant parts. It includes links to the published research for convenience, and if you don't subscribe to those products, it will present the options for access.