
TradingEdge Weekly for Nov 14 - Financials sector crossroads, Energy breadth thrust, Credit risks, Bitcoin yield curve, TCTM Risk-Warning Model, Hang Seng breadth indicators

Key points:
- Financial stocks show signs of potential breakout with favorable indicators like the Copper/Gold Ratio
- Energy sector signals suggest potential upside when combined with a trend filter
- Credit markets are helping filter risks in QQQ's long-term positive signal
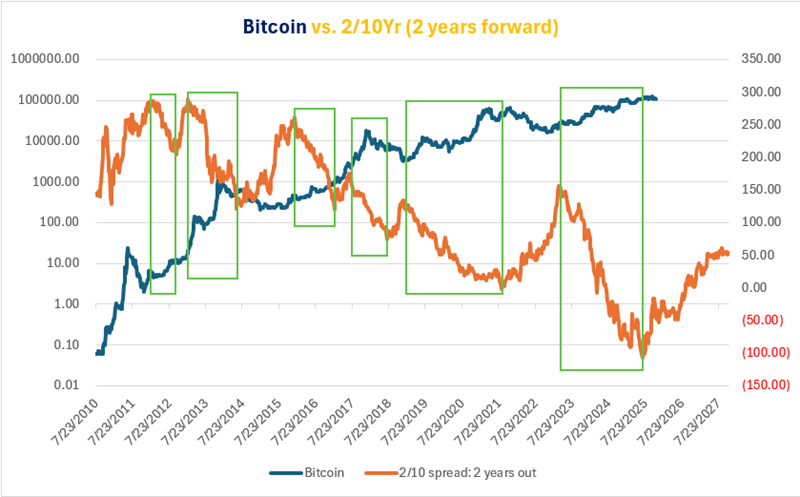
- Bitcoin's performance shows a meaningful relationship with the 2/10 yield curve spread
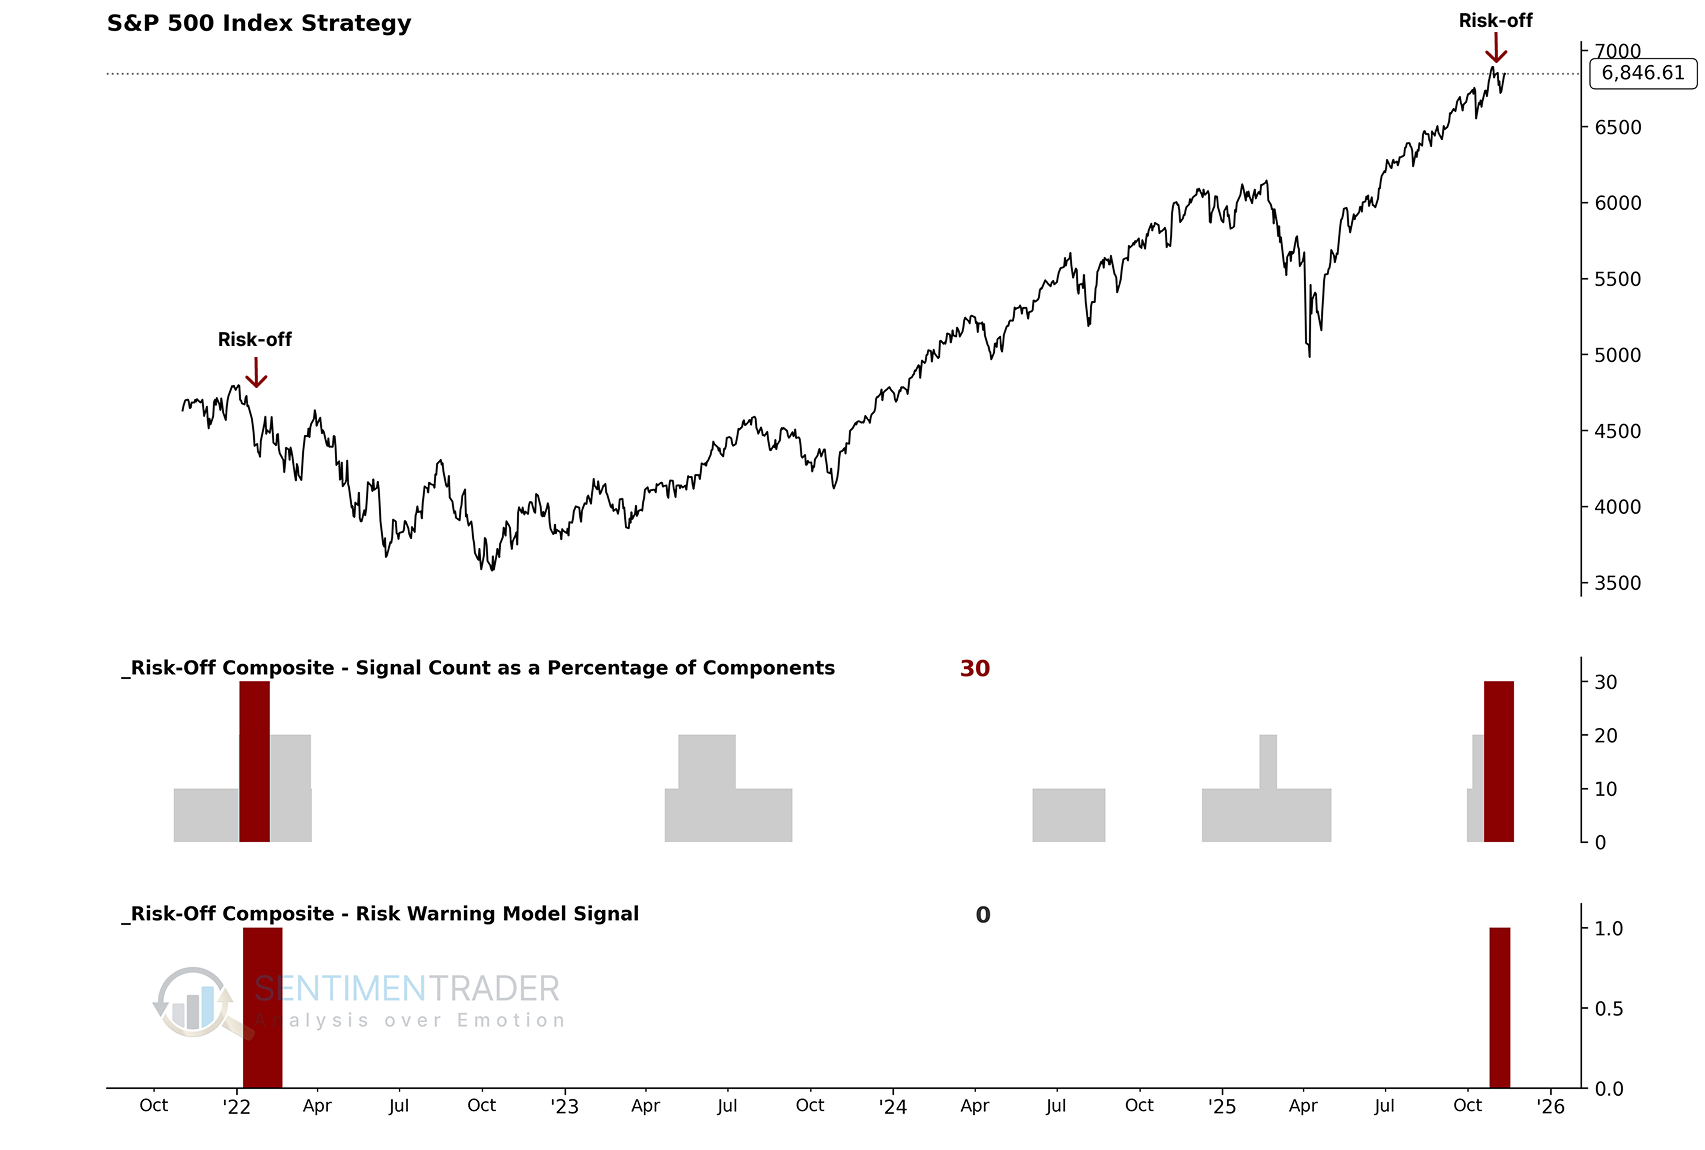
- The new TCTM Risk-Warning Model identifies market fragility through declining participation and excessive optimism
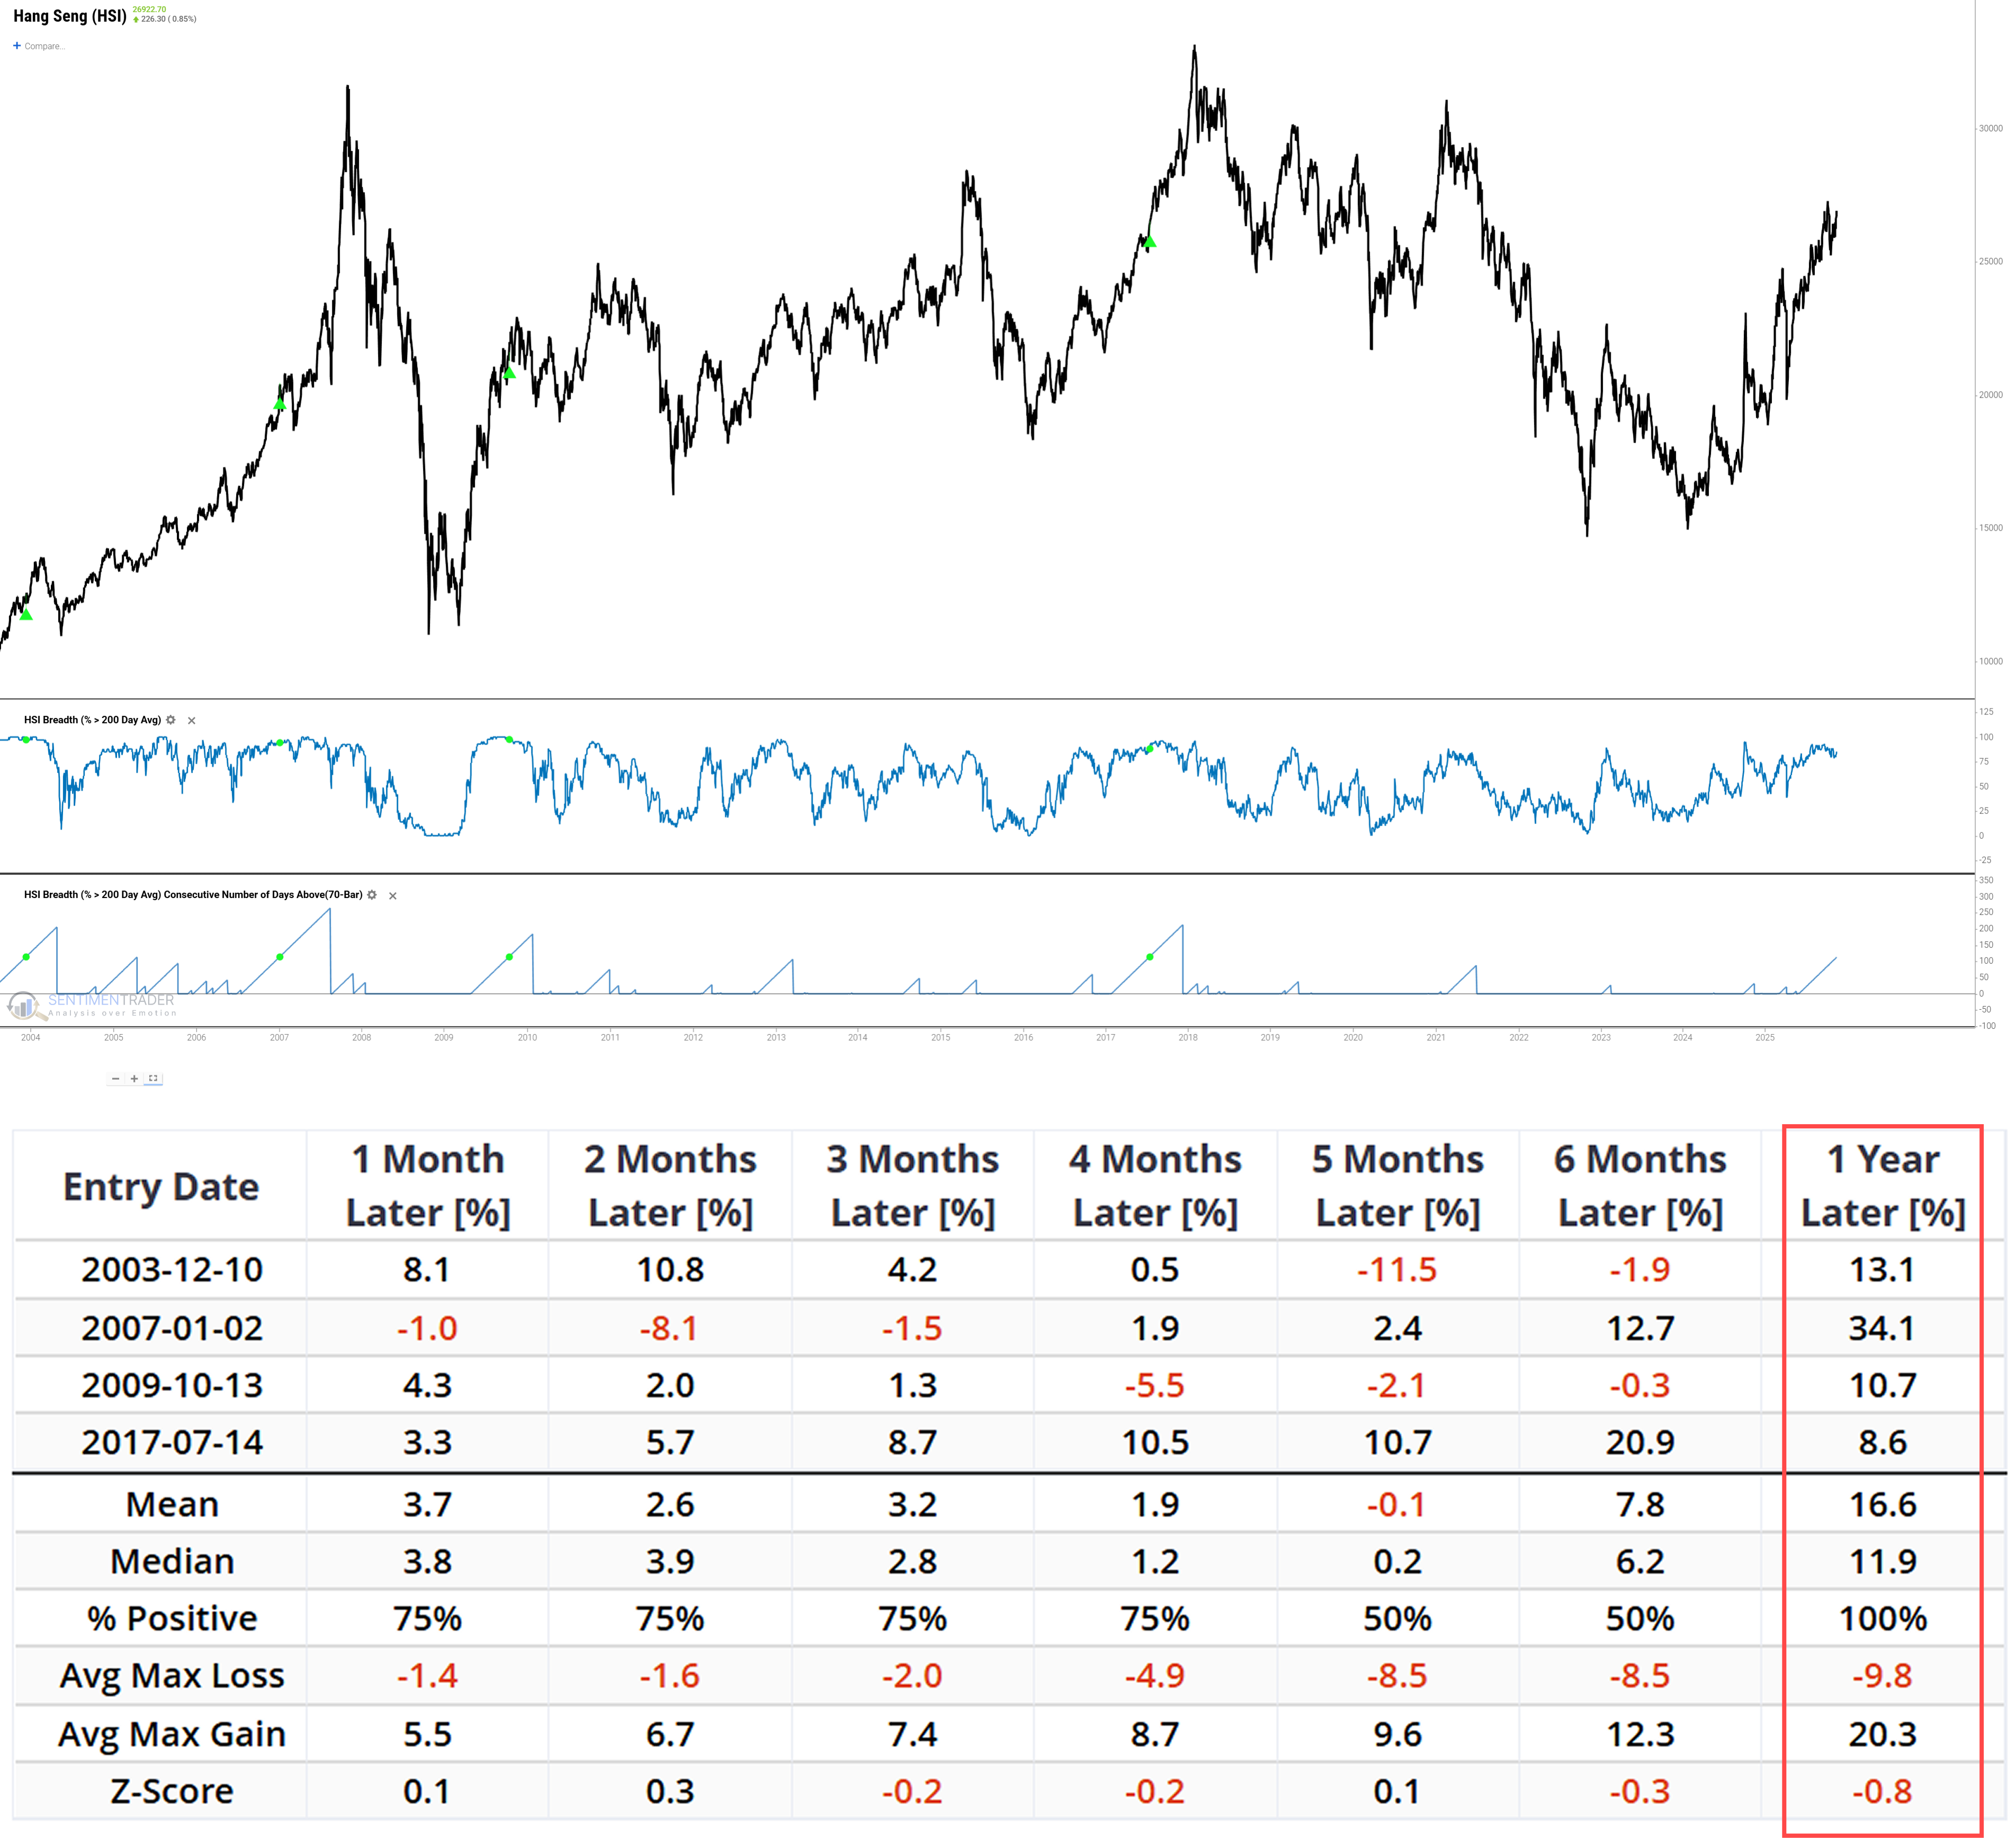
- Hang Seng Index breadth indicators show prolonged strength and short-term overbought conditions
House view:
- Stocks:
- Short-term: Bearish. The market's fate hangs on the incoming "data deluge" (CPI, jobs). Technicals are broken, and this week's "bull trap" confirms institutional profit-taking. The path of least resistance is lower amid a binary, high-volatility environment. This time frame covers 1 - 4 weeks.
- Intermediate-term: Bearish to Neutral. The theme will be a Fed "policy error," trapped between slowing growth and sticky 3% inflation. This environment is toxic for high-valuation tech stocks. We expect the headline index to be flat-to-down, masking a violent rotation underneath. This time frame covers 1-5 months.
- Long-term: Bullish . The long-term outlook is driven by two "mega forces": the build-out of AI infrastructure and a new monetary regime of "de-dollarization" and fiscal dominance. A new secular bull market in hard assets is forming. This time frame covers 6-12 months.
- Structural momentum favors AI Infrastructure (Utilities, Power, industrial inputs) driven by exponential energy demand from data centers.
- Hard Assets (Gold, Silver, Miners) are acting as the new primary defensive/monetary hedge, driven by central bank buying and inflation fears, not just cyclical trends.
- Very long-term (one year+) valuation favors mean reversion to Small Cap Value, which is seen as extremely undervalued compared to overvalued Large Cap Growth.
- Bonds: Following the end of the government shutdown, a brief rebound in market sentiment drove yields higher. However, the absence of key economic data cast a thick fog over the Federal Reserve's policy path, causing significant volatility in rate cut expectations and leaving markets on high alert. Long-term cycles remain bearish.
- Commodities: A massive divergence is underway. Monetary metals are in a structural re-rating, hitting all-time highs driven by rate cut expectations, central bank "de-dollarization" demand, and industrial needs. An effective commodity trend model is currently bullish. Gold (especially gold miners) and silver are outperforming. Conversely, industrial commodities (WTI Oil) are at recessionary levels, as IEA reports confirm a "growing surplus" from demand destruction.
- Crypto: We follow several simple systems for bitcoin, which we consider the equivalent of the S&P 500 for crypto. Due to bitcoin's explosive growth over long periods, it's dangerous to equate neutral conditions with being bearish for some of these. However, if a system is "out," we consider it bearish for this summary.
- Triple 40: Bearish
- RSI Momentum: Bearish
- Trend and Relative Trend: Bearish
- PMI: Bearish
- M2 ROC: Bullish
Where we're at
Most investors have the most riding on equities. We feel that the most significant determinants of success for investors are whether to adjust their allocation to that asset class based on factors that have historically had a good record of preceding above- or below-random returns in the months ahead.
Those factors include the probability of a looming recession, sentiment, price action, volatility, breadth, and the bond market. The chart below summarizes the main indicators and composite models we watch for those factors, and they're mostly in bullish regimes. Valuations are not part of these factors since the relationship has been too inconsistent on time frames under one year.
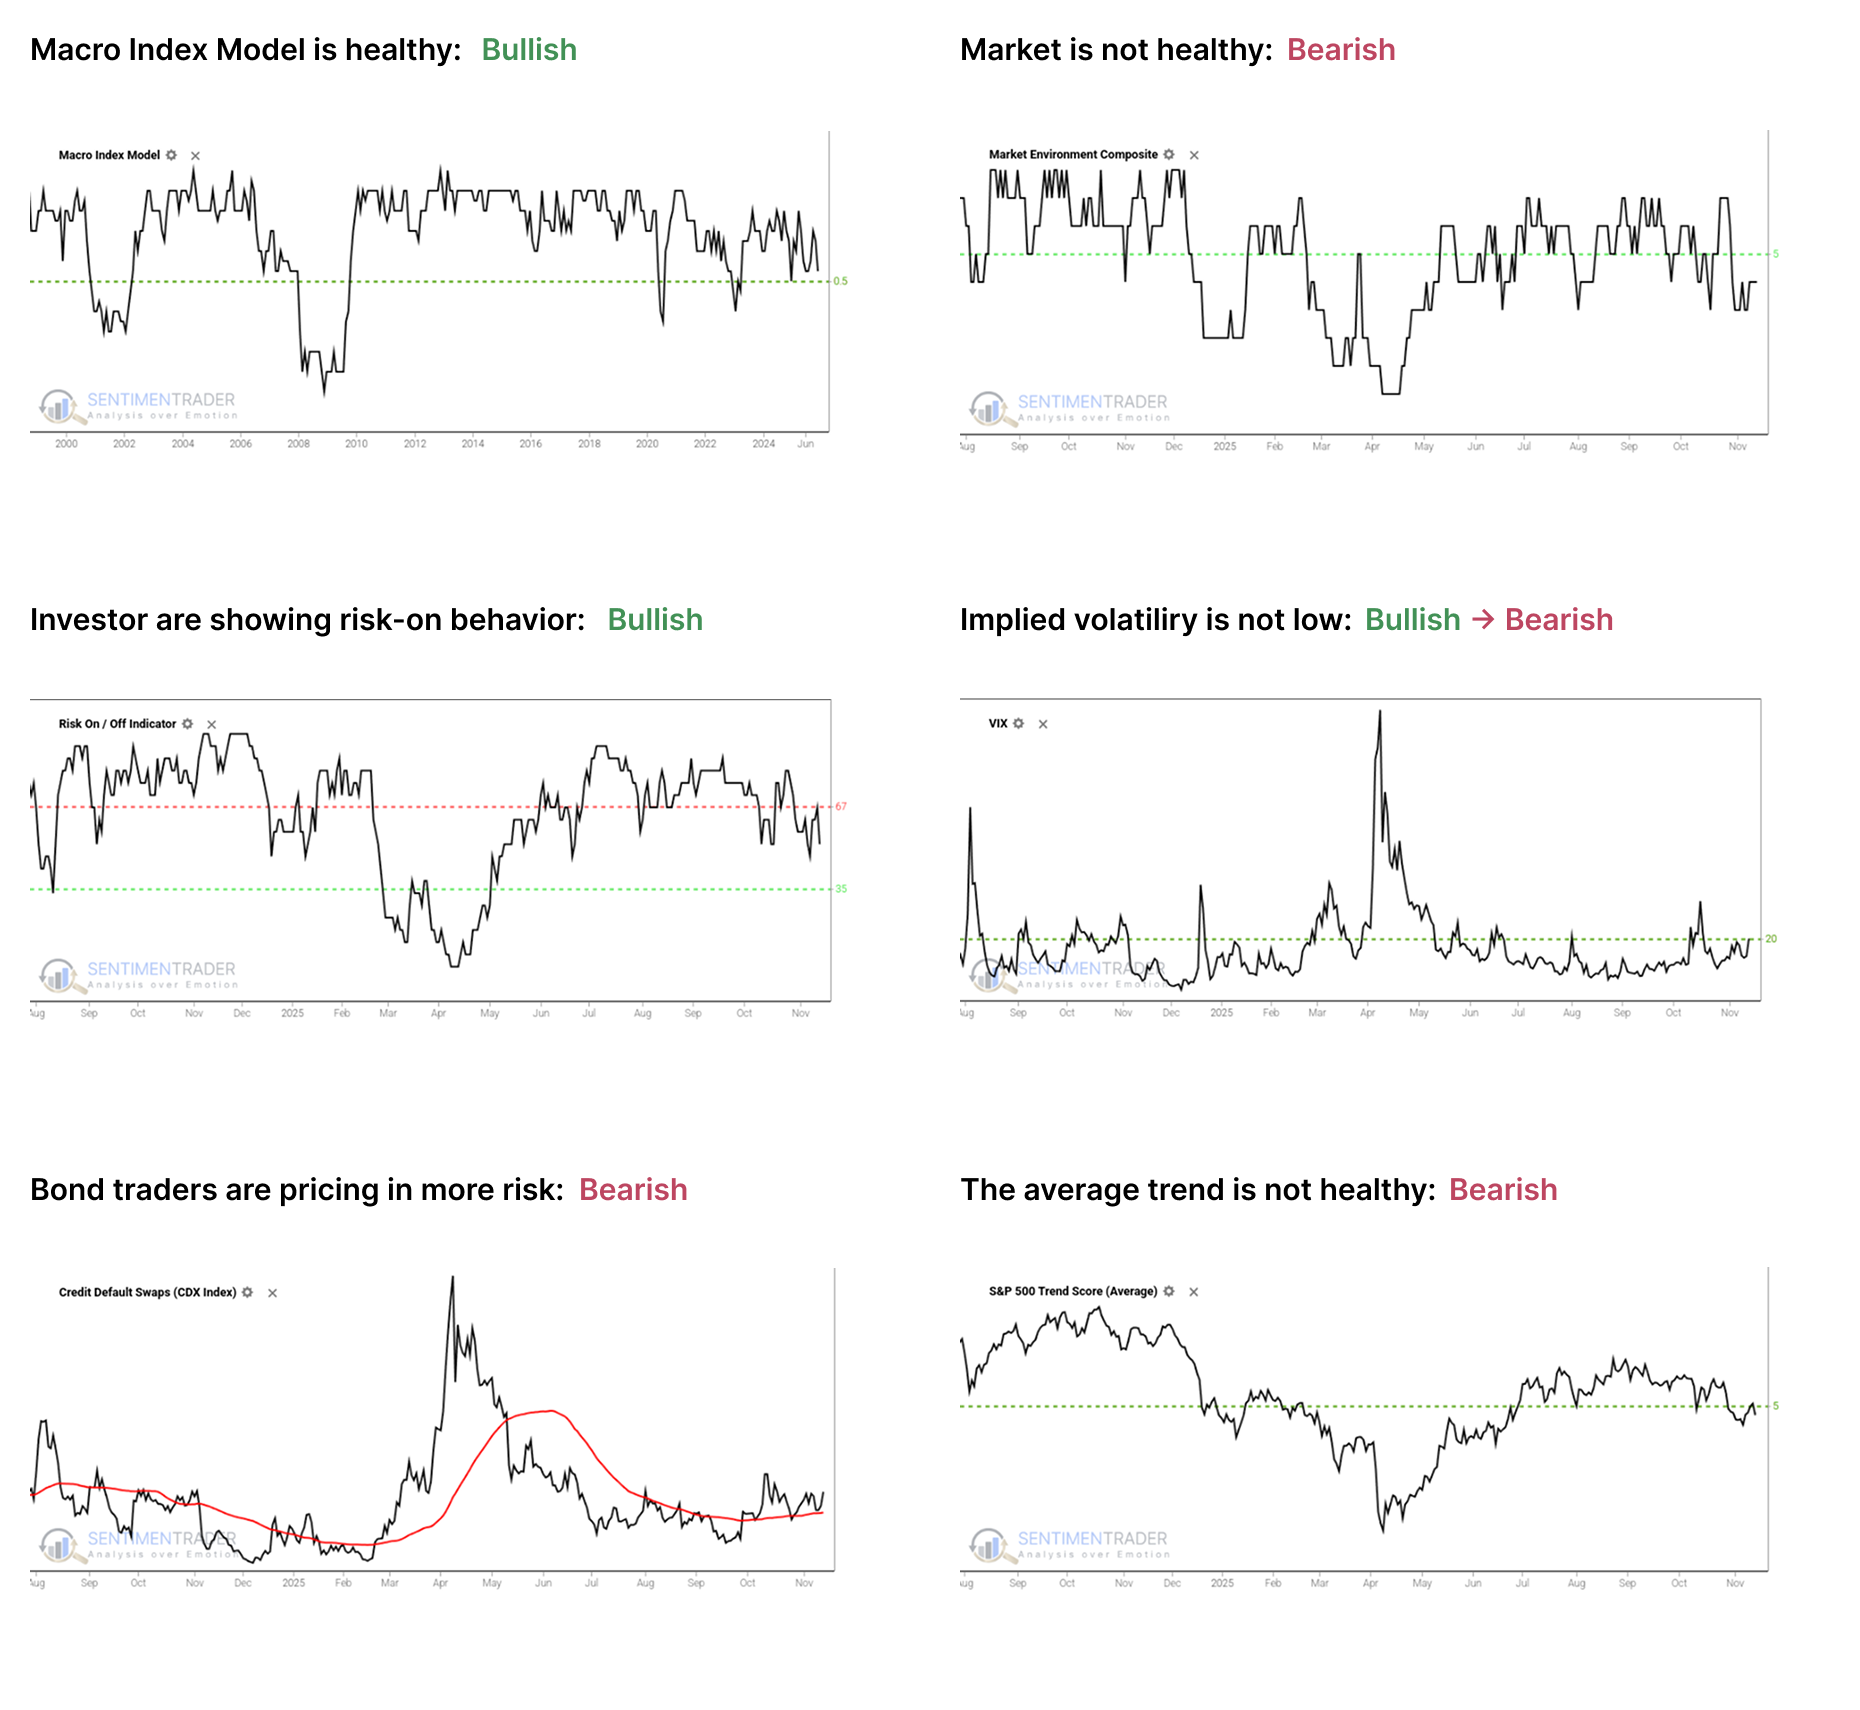
- The Macro Index Model is above the 50% threshold, which has been a vital level as outlined here.
- The Market Environment has been skittish since April, and has slipped into an unhealthy condition. Future returns, especially for higher-beta indices, have historically been notably weaker, with greater risk, when the environment is unhealthy as outlined here.
- The Risk On / Off Indicator shows that investors are still in risk-on mode. This has been a good sign for future returns as outlined here.
- Implied volatility is at or above 20, signaling a volatile environment. The S&P 500 has historically performed poorly when this is the case, as outlined here.
- Credit default swap spreads are above their 50-day moving average, which is modestly concerning as outlined here.
- A composite of trend measures in SPY and the average S&P 500 stock remain below 5, which show unhealthy trend conditions.
Since April, the most compelling studies have had a strongly bullish bias on longer time frames. You can follow these through the Active Studies page. From time to time, when the analysts' studies provide an overwhelming message, it will override the charts above, but there has been no consensus in the studies to suggest overriding the bullish environment.
Other major markets have been mostly rangebound for four months, and there is little among what we follow to suggest a compelling edge either way.
Financials sector at a crossroads
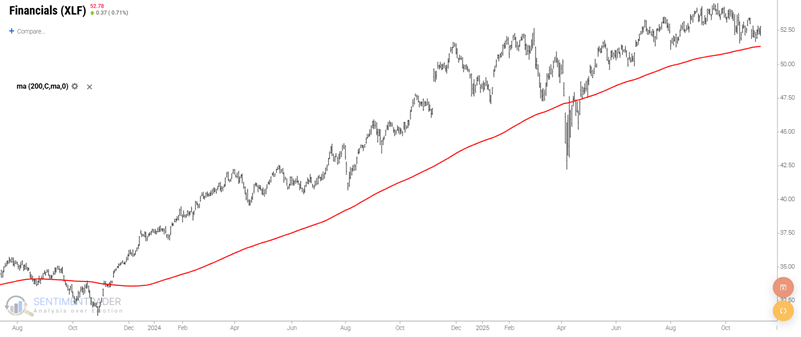
The SPDR Financials Sector ETF (XLF) remains above its 200-day moving average, indicating an established uptrend. However, financials have made no new ground since March. The Copper/Gold Ratio remains extremely low at 0.124, suggesting potential for higher prices in the year ahead for financial stocks.
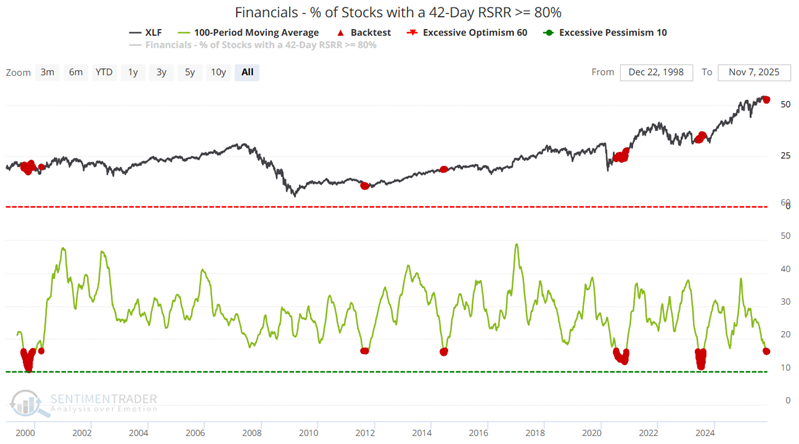
Financials sector breadth may already be washed out. The moving average of the Financials - % of Stocks with a 42-day RSRR >= 80% indicator has been below 16.5 every day since October 28th, suggesting favoring the bullish case until a solid reason is given not to.
Energy sector breadth thrust from oversold to overbought
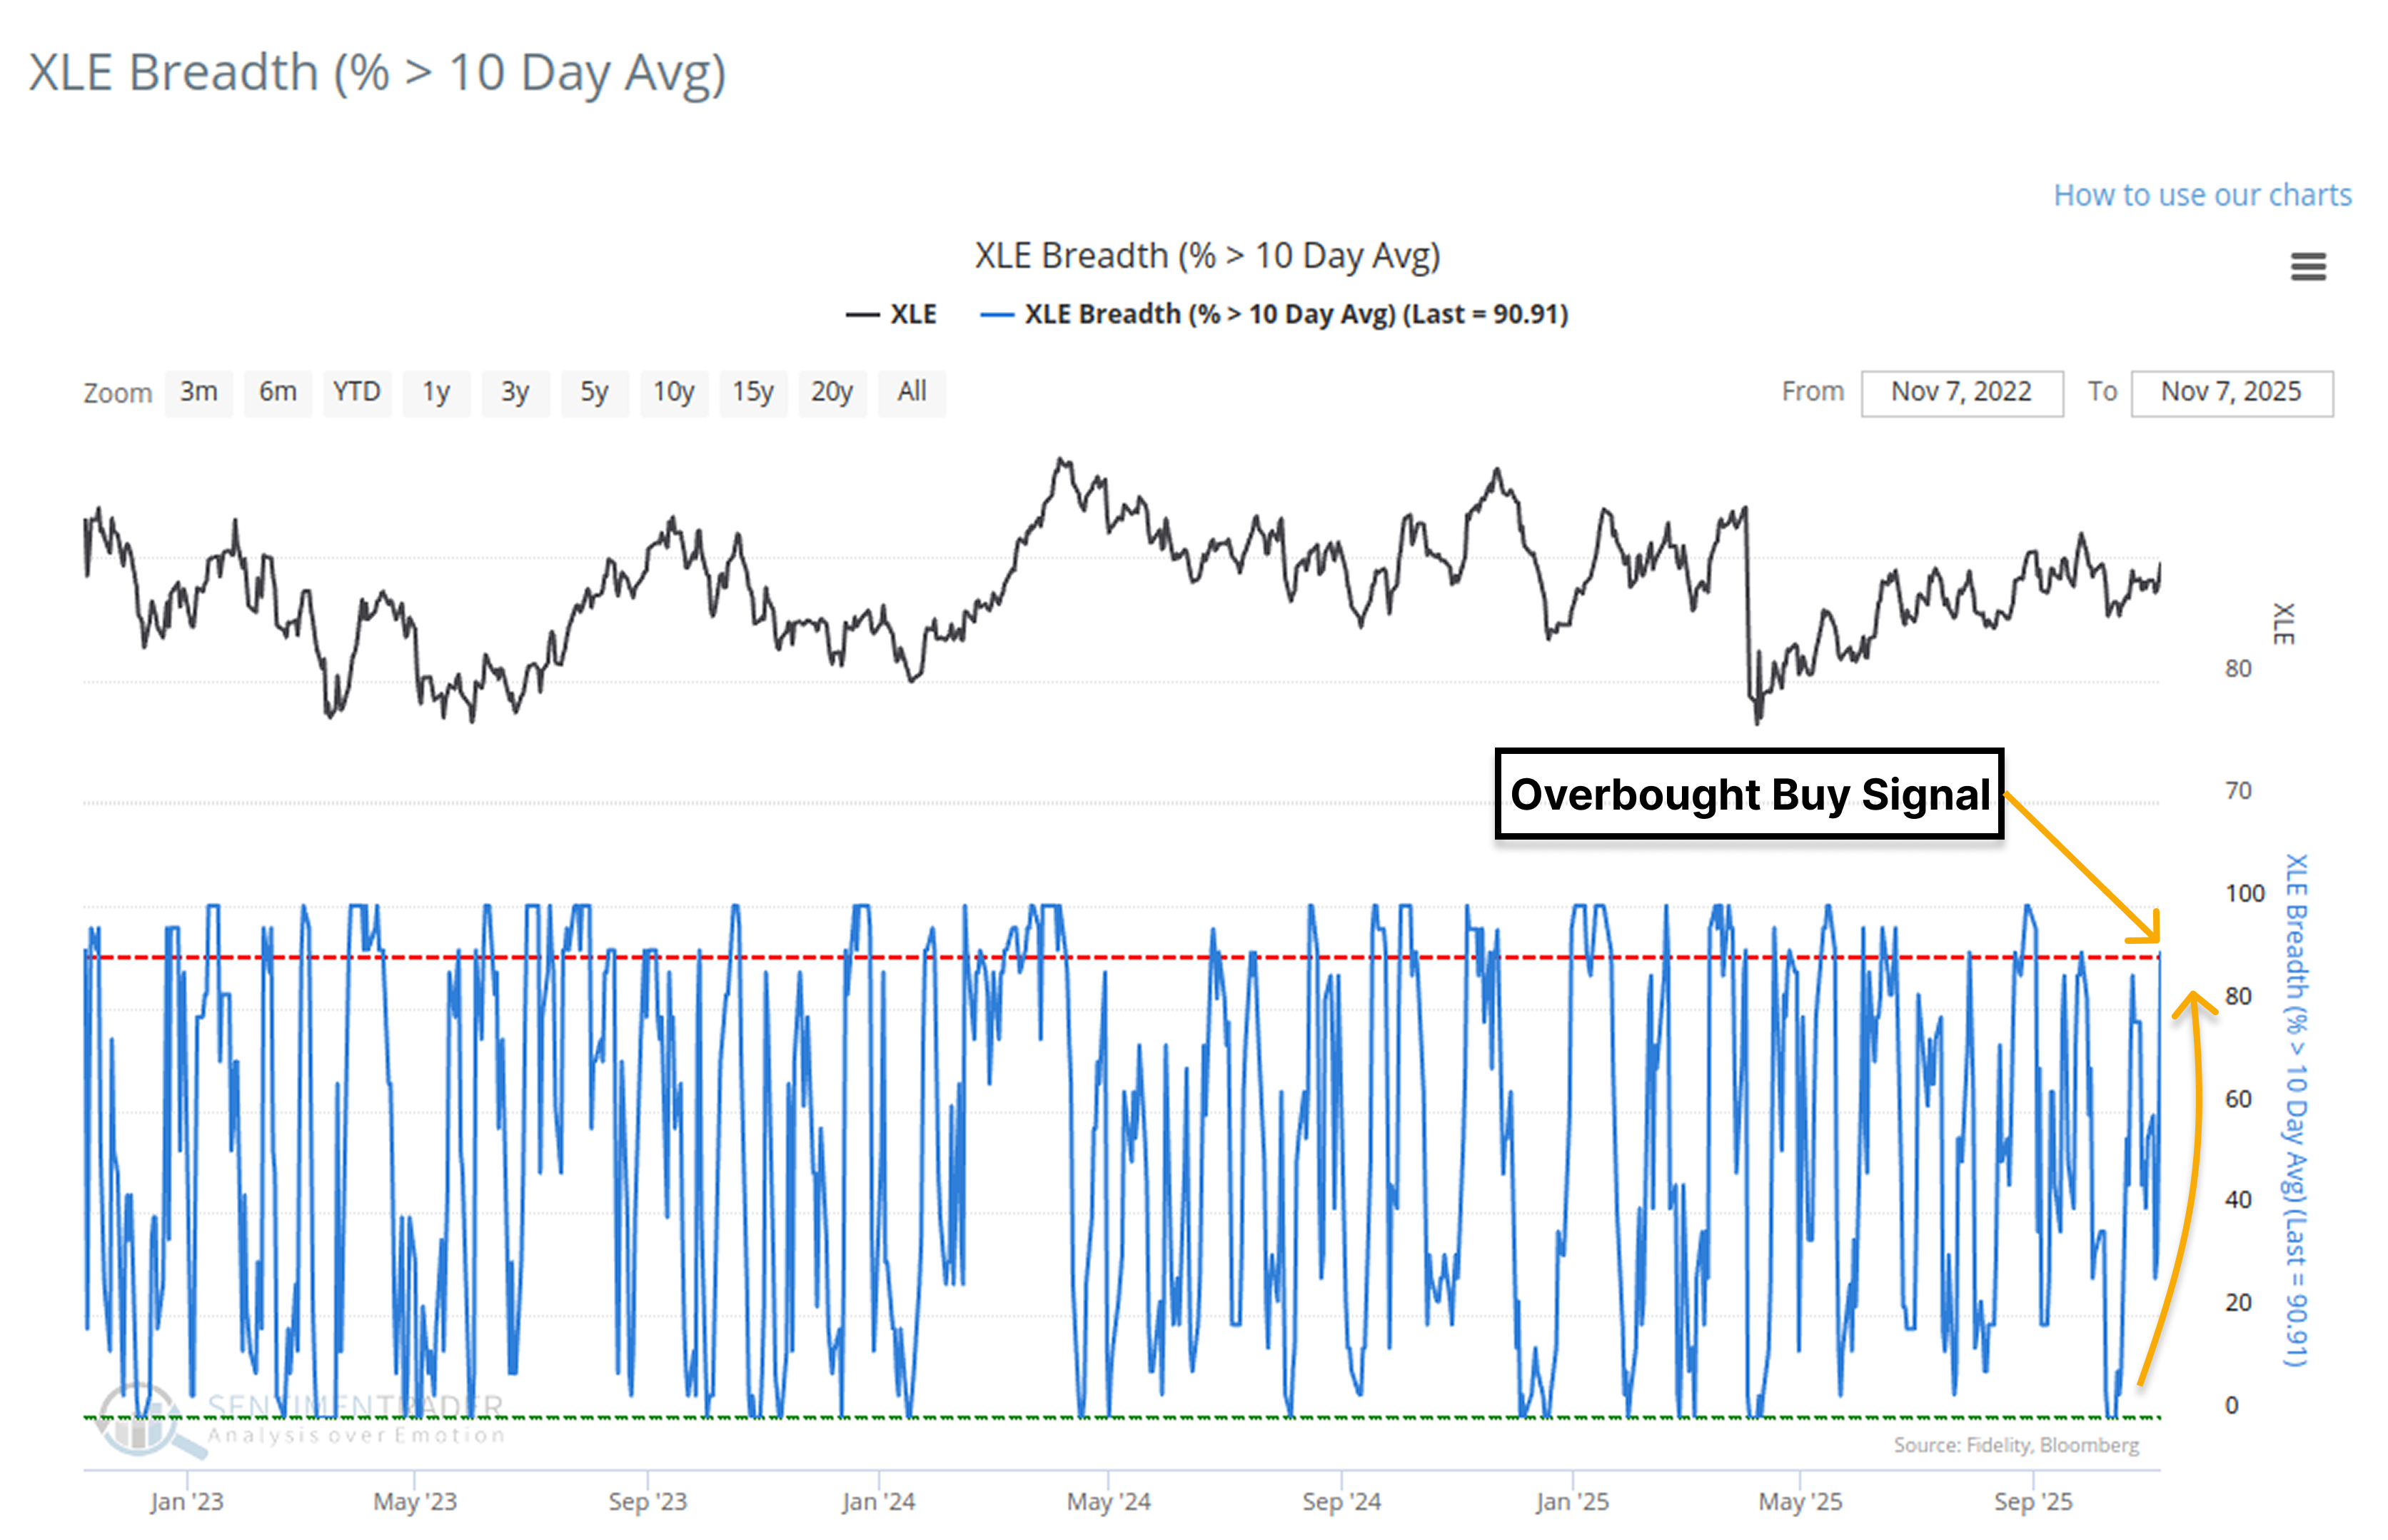
The percentage of S&P 500 energy members trading above their respective 10-day moving average registered an oversold-to-overbought reversal buy signal last week. When including a trend filter that requires the energy sector (XLE) to be in a long-term uptrend, the 6-month win rate jumps from 69% to 82%.
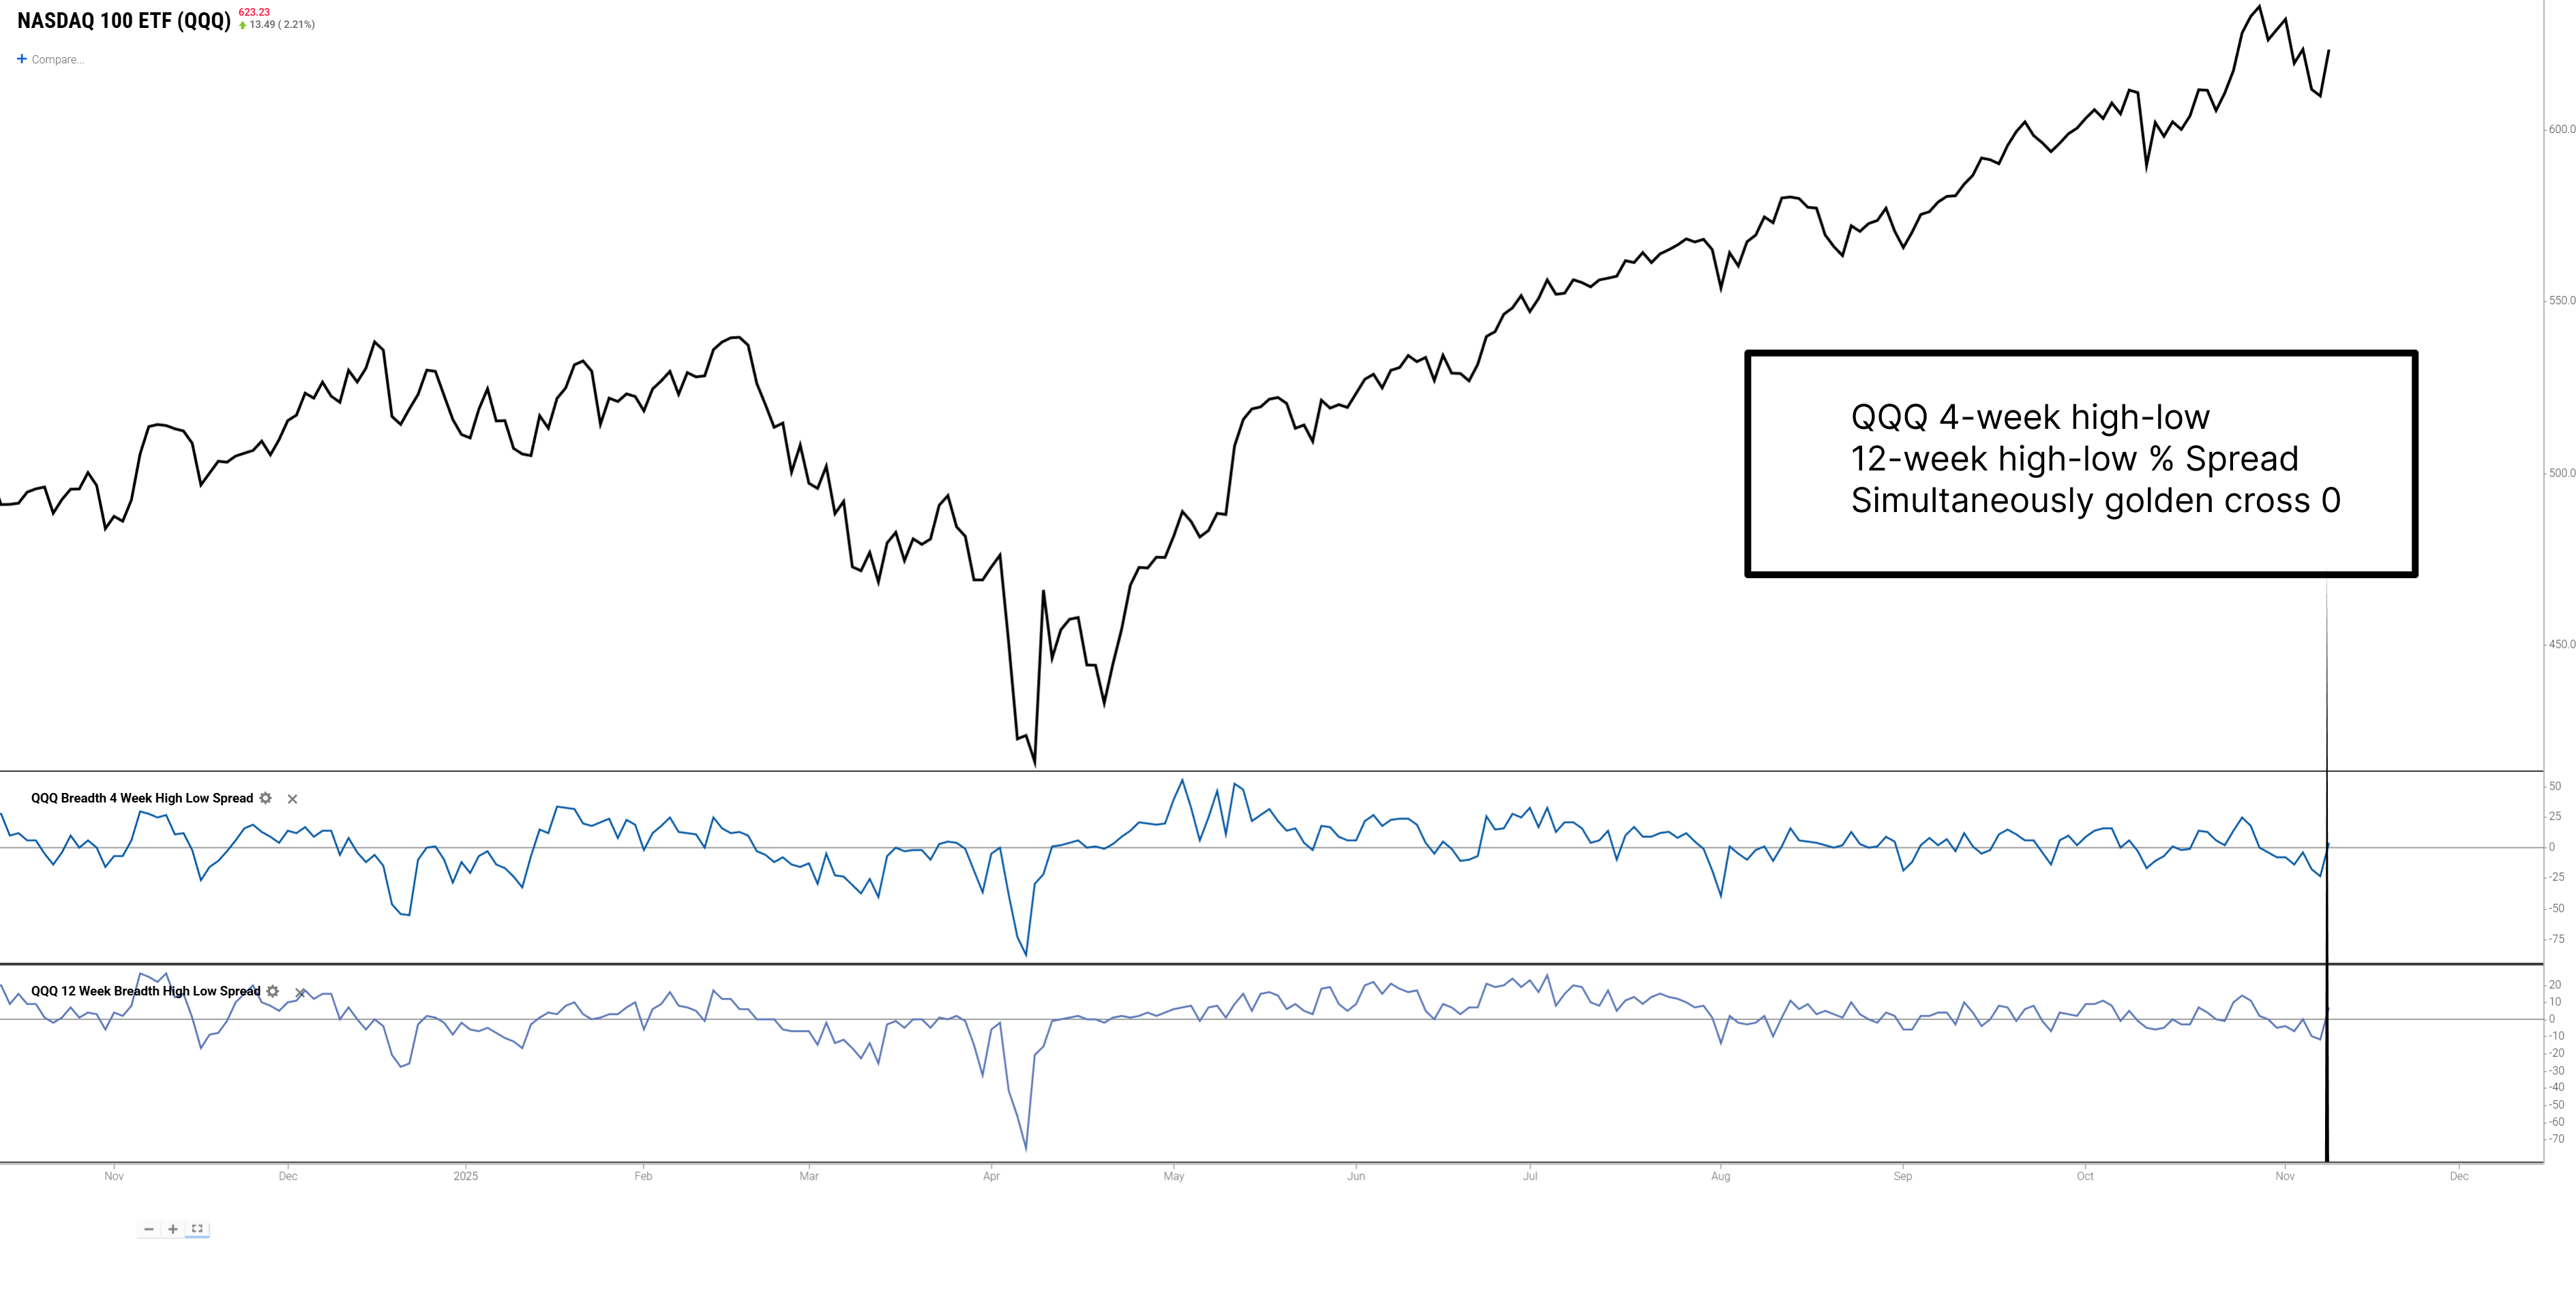
Credit filtering for QQQ signals, but risks remain
QQQ has triggered a long-term positive technical signal, with favorable average 1-year returns historically. However, its short-term pullbacks show significant divergence. Current credit risks are contained, reducing extreme pullbacks, but short-term volatility and pullback risks persist.
When Bitcoin meets the yield curve
Bitcoin's performance shows a meaningful relationship with changes in the 2/10 spread. Performance during favorable periods (between peaks and troughs for the 2/10 spread) has been significantly better than during unfavorable periods.
A deep-dive into the Sentimentrader's new TCTM Risk-Warning Model - Part I
The Risk-Warning Model contains ten algorithms designed to identify historical instances of declining market participation and excessive optimism. It provides a 'weight-of-the-evidence' approach to identifying market fragility, spotting periods where broad participation is declining or sentiment is excessively optimistic.
This week's breadth indicators for the Hang Seng Index
More than 70% of Hang Seng Index components trade above their 200-day moving average, and this proportion has persisted for 113 consecutive days. The McClellan Oscillator has completed a cycle from extreme pessimism to extreme greed, suggesting potential for volatility in the short term but upward momentum in the medium to long term.
About TradingEdge Weekly...
The goal of TradingEdge Weekly is to summarize some of the research published to SentimenTrader over the past week. Sometimes there is a lot to digest, and this summary highlights the highest conviction or most compelling ideas we discussed. This is NOT the published research; rather, it pulls out some of the most relevant parts. It includes links to the published research for convenience, and if you don't subscribe to those products, it will present the options for access.