
TradingEdge Weekly for Jan 9 - Economic resilience signals, continuation signals, Financial sector surge, Small-cap vs Large-cap cycle

Key points:
- The Macro Index Model signals economic resilience, favoring S&P 500 over crude oil
- Multiple indicators suggest bullish continuation signals for stocks
- Market sentiment shows excessive optimism while economic surprises diverge
- Financial sector shows strong momentum and favorable options sentiment
- Treasury bond indicators remain unfavorable despite technical coiling
- Small-caps historically outperform large-caps from mid-December to mid-February
House view:
- Stocks:
- Short-term: Modestly Bearish. It's showing no ill effects yet, and maybe this will be a failed signal. Geopolitical shocks trigger risk-off sentiment, with major U.S. equity indices trading sideways near recent highs as tech sectors undergo consolidation. Investors await key labor market indicators for further policy clarity. This time frame covers 1 - 4 weeks.
- Intermediate-term: Cautious. Valuations remain stretched relative to historical averages, with earnings growth expectations dependent on the successful monetization of AI technologies and the sustainability of a soft-landing scenario. Global monetary policy divergence, alongside lingering geopolitical risks, amplifies market volatility. This time frame covers 1-5 months.
- Long-term: Bullish. U.S. economic exceptionalism persists, underpinned by strong services consumption and productivity gains driven by AI adoption. Corporate earnings are projected to deliver solid growth, with the AI narrative shifting from infrastructure investment to application-level commercialization. Geopolitical hedging themes - including defense spending and energy security initiatives - and "hard power" sectors tied to national security and technological competitiveness offer structural upside potential. This time frame covers 6-12 months.
- Cyclical momentum favors defense, domestic energy majors, and AI application-focused software and services providers, which are leveraged to geopolitical spending priorities and efficiency gains from technological adoption.
- Defensive sectors such as utilities and healthcare provide portfolio stability during periods of heightened volatility, with resilient cash flows offsetting sensitivity to interest rate fluctuations.
- Very long-term (one year+) opportunities lie in mean reversion toward undervalued industrial and energy infrastructure stocks, which are poised to outperform crowded mega-cap tech segments over extended horizons.
- Bonds: Long-term cycles remain bearish. U.S. sovereign bond yields have trended higher amid Fed policy uncertainty and geopolitical volatility, with yield curves steepening as short-end rates price in potential monetary easing while long-end yields face pressure from U.S. fiscal expansion and global liquidity tightening driven by policy normalization in other major economies.
- Commodities: Extreme volatility and divergent performance characterize the commodities space. Trend models signal bullish positioning for precious metals. Gold acts as a key hedge against sovereign risk and fiscal dominance concerns, with price action driven by geopolitical tensions and uncertainty around global monetary policy paths; leading institutional forecasts call for substantial upside potential over the course of the year. Crude oil faces persistent pressure from expectations of long-term supply growth.
- Precious metals: Maintain strategic allocations as a "hard currency" hedge against geopolitical fragmentation and fiat currency risks; short-term price pullbacks present attractive incremental buying opportunities.
- Crude oil: Avoid long positions given structural supply surplus dynamics.
- Crypto: We follow several simple systems for bitcoin, which we consider the equivalent of the S&P 500 for crypto. Due to bitcoin's explosive growth over long periods, it's dangerous to equate neutral conditions with being bearish for some of these. However, if a system is "out," we consider it bearish for this summary.
- Triple 40: Bearish
- RSI Momentum: Bearish
- Trend and Relative Trend: Bearish
- PMI: Bearish
- M2 ROC: Bullish
- Notable Moves in Global Markets:
- Europe: Major indices trade mixed, with retail sectors under pressure from profit warnings reflecting weakened consumer demand, while defense stocks rally amid rising geopolitical tensions. Benchmark indices in the eurozone have hit recent highs but lack support from domestic economic fundamentals, as global multinationals offset weakness in local industrial activity.
- Japan: Equity indices decline (2026-01-08) amid sharp rises in government bond yields, as monetary policy normalization weighs on high-valuation tech and export-oriented stocks. Unwinding of the yen carry trade and rising corporate financing costs add to downward pressure. Long-term opportunities are concentrated in domestic banking sectors, which benefit from widening interest rate margins.
- Greater China: HSI pull back after a strong start to the year, driven by profit-taking in AI-related stocks, while innovation in domestic AI models provides underlying sentiment support. Institutional forecasts call for substantial upside potential based on earnings recovery, though cautious views persist pending tangible improvements in consumption and property markets. Policy support and technological innovation remain key catalysts for market performance.
Where we're at
Most investors have the most riding on equities. We feel that the most significant determinants of success for investors are whether to adjust their allocation to that asset class based on factors that have historically had a good record of preceding above- or below-random returns in the months ahead.
Those factors include the probability of a looming recession, sentiment, price action, volatility, breadth, and the bond market. The chart below summarizes the main indicators and composite models we watch for those factors, and they're mostly in bullish regimes. Valuations are not part of these factors since the relationship has been too inconsistent on time frames under one year.
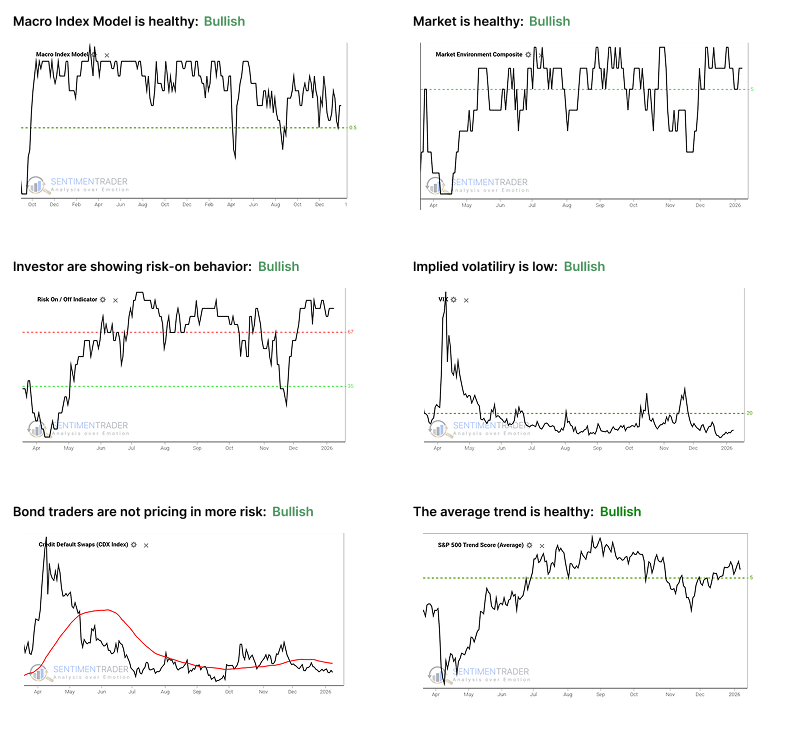
- The Macro Index Model is above the 50% threshold, which has been a vital level as outlined here.
- The Market Environment has been skittish, but is currently healthy. Future returns, especially for higher-beta indices, has been markedly better, with less risk, when the environment is healthy as outlined here.
- The Risk On / Off Indicator shows that investors are still in risk-on mode. This has been a good sign for future returns as outlined here.
- Implied volatility remains below 20, showing a calm environment. The S&P 500 has perfomed well when this is the case as outlined here.
- Credit default swap spreads are below their 50-day moving average, which drastically improves stock returns as outlined here.
- A composite of trend measures in SPY and the average S&P 500 stock remain above 5, which show healthy trend conditions.
Economic Resilience Signals Favor S&P 500
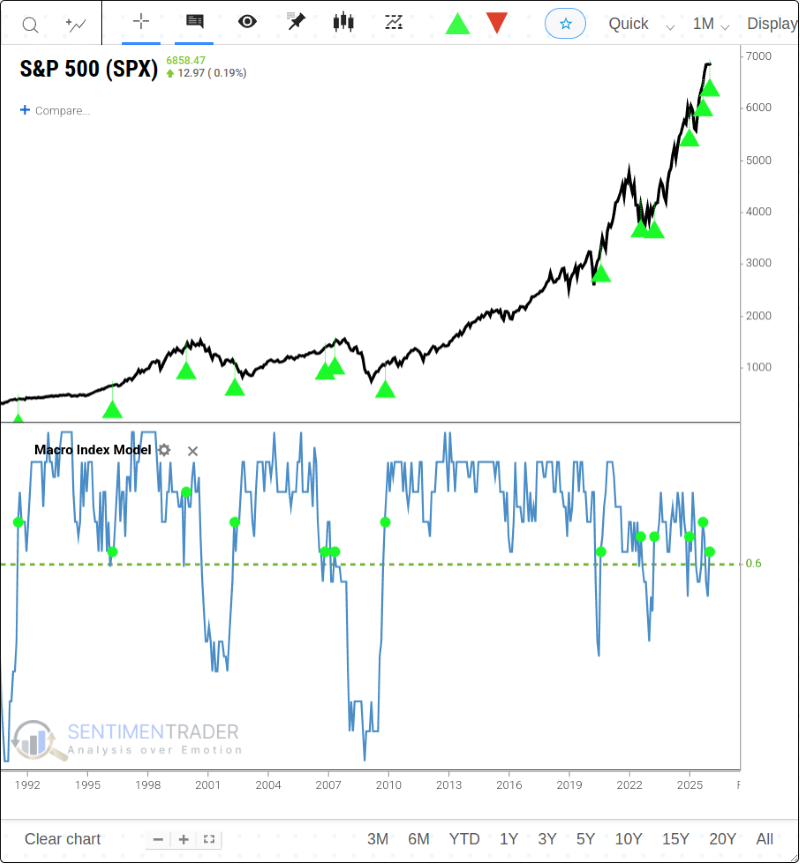
Our Macro Index Model (MIM) combines 11 various economic indicators to determine the state of the U.S. economy right now. The model is constructed as an inverse of recession probability. So, you can subtract the model from 100% to get the recession probability in the months ahead. A model reading of 70% suggests a 30% recession probability; a reading of 20% suggests an 80% recession probability.
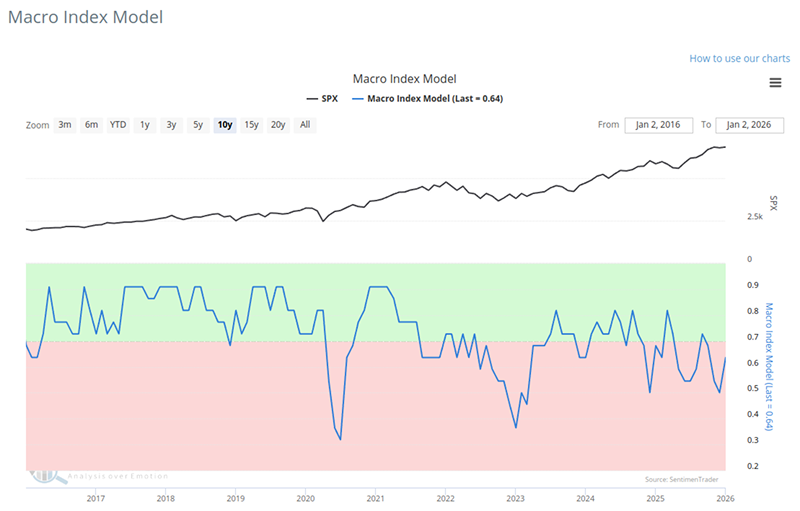
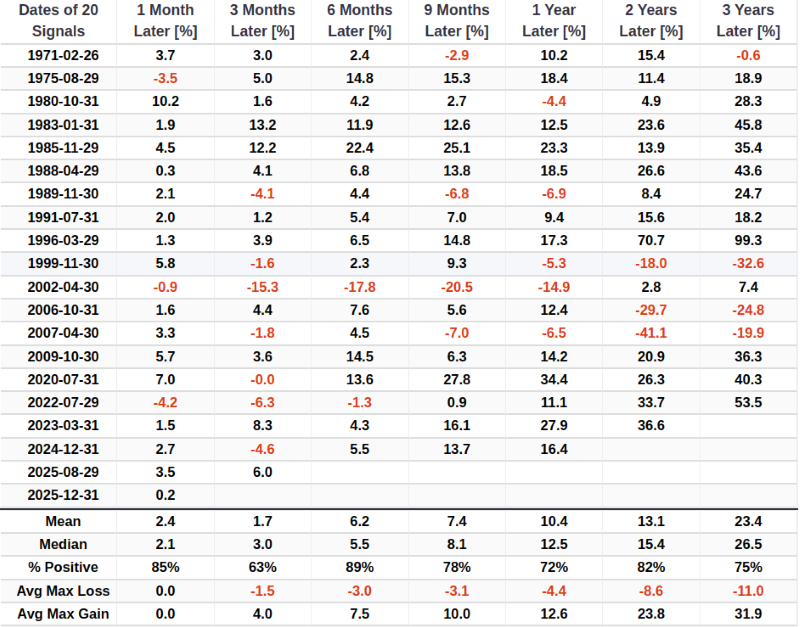
Returns were robust when the model was above 50%, and terribly subpar when it was 50% or below. The latest reading is 0.636. The model recently generated a \"Golden Cross\" by moving above 0.6. The chart below highlights the dates when the MIM crossed above the 0.6 level. For related backtest, click here.
As you can see, performance has been relatively strong across various timeframes.
Multiple Indicators Flash Bullish Continuation Signals
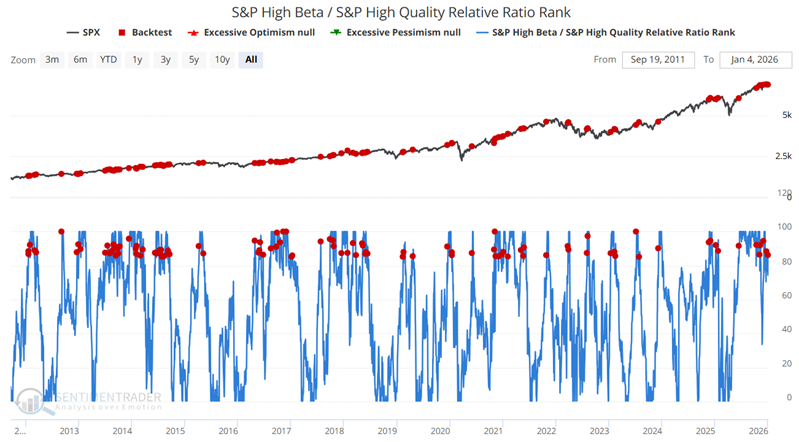
The first indicator to highlight is our S&P High Beta / S&P High Quality Relative Ratio Rank indicator. This indicator examines the relationship between high-beta (i.e., more volatile) and high-quality (i.e., less volatile) stocks. The chart illustrates the ratio's position relative to its range over the past four months. When the relative ratio is high, investors are showing risk-on behavior. When the ratio drops to a low level, they are exhibiting risk-off behavior.
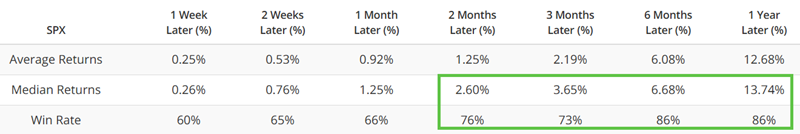
The table below summarizes the subsequent performance of the S&P 500. The key thing to note is the decent returns and win rates for periods of two months and beyond, especially for six and twelve months.
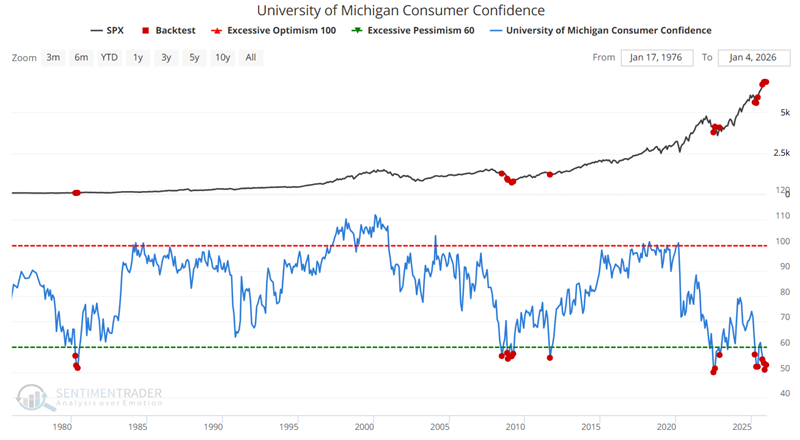
The University of Michigan Consumer Sentiment Index is a consumer confidence index published monthly by the University of Michigan. The index is normalized to have a value of 100 in December 1964. The chart below highlights all months when the U of M Consumer Confidence Index read 58 or lower.
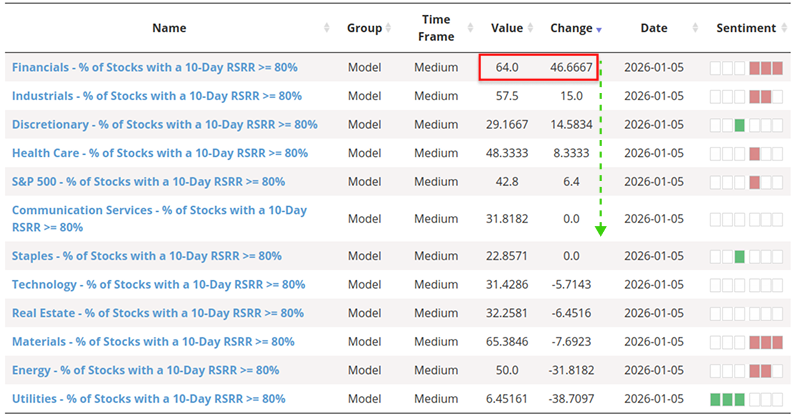
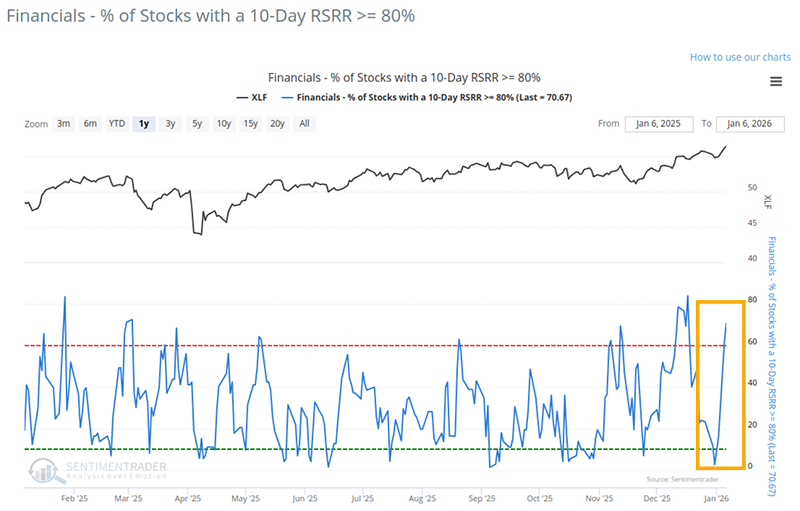
Financial Sector Shows Strong Momentum
The Financial sector (XLF) has seen a sharp increase in relative strength, leading all sectors in short-term momentum. A sentiment signal from the XLF Put/Call Ratio suggests a favorable risk/reward setup for the sector, with a 94% historical win rate over six months.
The breakout in Financials to new highs, occurring while the S&P 500 is near its own highs, has historically been a bullish confirmation for the broader market.
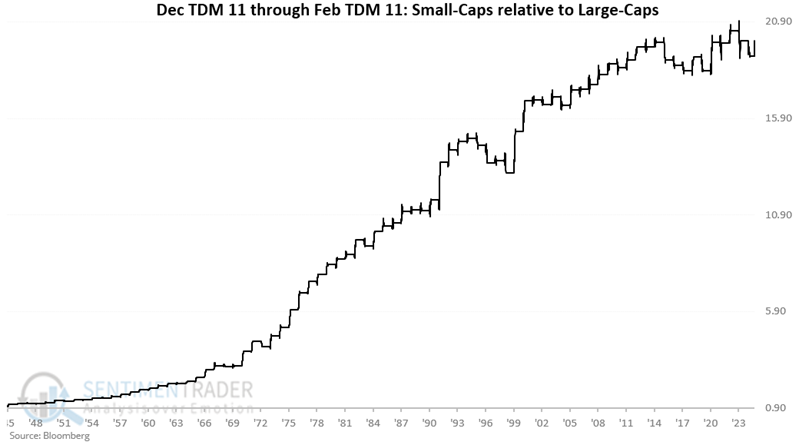
Small-Cap vs Large-Cap Seasonal Pattern
During the post-World War II era, small-cap stocks have consistently shown a tendency to outperform large-cap stocks from mid-December to mid-February. The rest of the year? Not so much.
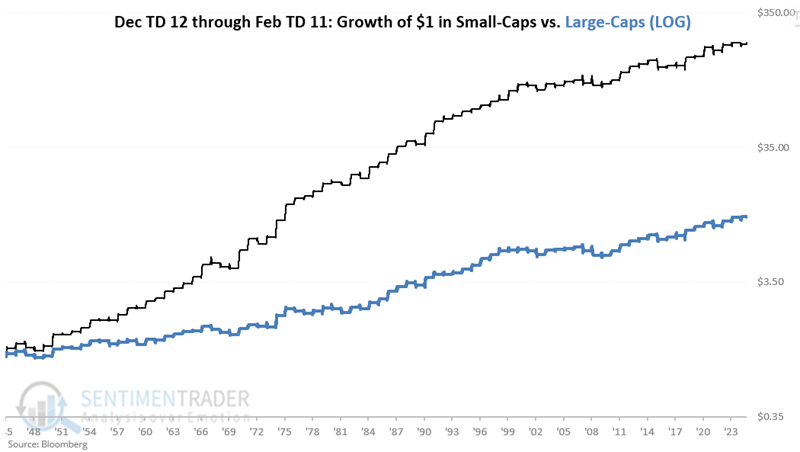
The chart below displays the return for Small-Caps relative to returns for Large-Caps during this two-month period every year since 1945.
About TradingEdge Weekly...
The goal of TradingEdge Weekly is to summarize some of the research published to SentimenTrader over the past week. Sometimes there is a lot to digest, and this summary highlights the highest conviction or most compelling ideas we discussed. This is NOT the published research; rather, it pulls out some of the most relevant parts. It includes links to the published research for convenience, and if you don't subscribe to those products, it will present the options for access.