
TradingEdge Weekly for Jan 30 - Risk-on signals, Natural gas volatility, Commodities seasonality, Bond market sentiment, Metals market extremes

Key points:
- Multiple indicators show risk-on behavior supporting bullish case for stocks
- Natural gas sentiment at extreme optimism, historically a reliable sell signal
- Commodities entering strong seasonal period with favorable price action
- Bond market facing institutional crowding and seasonal headwinds
- Gold VIX spike suggests potential long-term metals upside despite short-term caution
House view:
- Stocks:
- Short-term: Cautious. Fed's hawkish pause triggers extreme structural divergence; AI tech giants face brutal valuation repricing on Capex efficiency doubts, while defensive, real asset and industrial stocks attract capital rotation. Major indices show mild fluctuations but hide sharp intrastock volatility. This time frame covers 1 - 4 weeks.
- Intermediate-term: Cautious. The correction of AI belief unfolds; market shifts from "blind AI frenzy" to "fundamentals and capital efficiency dominance". Tech stocks with high Capex and ambiguous monetization paths face sustained pressure, while AI application-side enterprises with immediate cash flow and cost-efficient traditional companies gain premium. Sector rotation intensifies, with capital fleeing long-duration intangible assets to short-duration entities with immediate profitability. This time frame covers 1-5 months.
- Long-term: Selectively Bullish. U.S. economic resilience still underpins market fundamentals, but stock market enters a stock-picking era. AI sectors with clear application scenarios and profitable capabilities retain structural upside; industrials, defense and energy stocks benefit from geopolitical tensions and real asset revaluation offer stable returns. Regional divergence remains, with high-valuation tech infrastructure stocks needing to verify ROI to regain market confidence. This time frame covers 6-12 months.
- Overweight AI application-side tech with immediate monetization, defense, energy, industrial stocks with self-reform capabilities and positive cash flow, and material stocks linked to precious metals.
- Avoid high Capex AI infrastructure tech, software/SaaS stocks with unclear profit paths, and consumer discretionary stocks with weak growth stories.
- Long-term opportunities lie in undervalued real economy enterprises with stable profitability and industrial stocks leveraged to U.S. national security and infrastructure spending.
- Bonds: Long-term cycles remain bearish. U.S. Treasury market experiences abnormal yield curve movements after Fed's hawkish pause, with significant bear steepening as long-end yields rise faster than short-end. Real interest rates remain restrictive, and the market still prices in limited rate cuts in 2026 but abandons linear easing expectations. The overall fixed income market volatility rises with increased policy uncertainty.
- Commodities: Trend models signal bullish positioning for precious metals. U.S.-focused commodities enter a super cycle driven by de-dollarization, geopolitical risks and fiat credit doubts, with extreme bullish performance in precious metals and energy's war premium return.
- Crude Oil: Geopolitical war premium rebounds sharply on rising U.S.-Iran tensions; oil prices break through key moving average technical resistance, attracting trend-following fund positions. Supply disruption concerns in the Middle East dominate pricing, offsetting previous fundamental supply surplus expectations, and the energy sector benefits from rising oil prices with improved profitability.
- Precious Metals: Gold hits a record high driven by ultimate safe-haven demand from geopolitical tensions, central bank strategic hoarding and structural distrust in fiat credit; the rally decouples from traditional rate and dollar drivers. Silver stages a short squeeze with a surge driven by dual attributes of financial hedging and industrial demand, with physical supply shortage amplifying bullish momentum. Short-term overbought signals exist but do not reverse the medium and long-term bullish trend.
- Crypto: We follow several simple systems for U.S.-traded bitcoin, which we consider the equivalent of the S&P 500 for crypto. Amid the market's paradigm shift to real assets and fiat credit doubts, crypto assets face valuation revaluation pressure from tech stock sell-off contagion, but long-term fundamental support from tokenization remains. Market volatility rises with the overall financial market, and short-term price performance is dominated by risk appetite shifts, with structural opportunities tied to institutional adoption and underlying technology innovation.
- Triple 40: Bearish
- RSI Momentum: Bearish
- Trend and Relative Trend: Bearish
- PMI: Bearish
- M2 ROC: Bullish
- Notable Moves in Global Markets:
- Europe: Mining and energy stocks rally on surging global commodity prices, and banking stocks benefit from high interest rate environment. Tech stocks face severe sell-off contagion from U.S. markets, with European cloud software giants plunging on weak business guidance. Euro strengthens against the dollar, easing domestic inflation pressure but weighing on the earnings expectations of export-oriented enterprises.
- Japan: The Nikkei 225 index fluctuated slightly. Semiconductor equipment manufacturers underperform sharply due to U.S. tech stock correction's impact on the Asian supply chain. Japanese export stocks face pressure from yen appreciation, while domestic banks benefit from widening interest rate margins amid policy normalization.
Where we're at
Most investors have the most riding on equities. We feel that the most significant determinants of success for investors are whether to adjust their allocation to that asset class based on factors that have historically had a good record of preceding above- or below-random returns in the months ahead.
Those factors include the probability of a looming recession, sentiment, price action, volatility, breadth, and the bond market. The chart below summarizes the main indicators and composite models we watch for those factors, and they're mostly in bullish regimes. Valuations are not part of these factors since the relationship has been too inconsistent on time frames under one year.
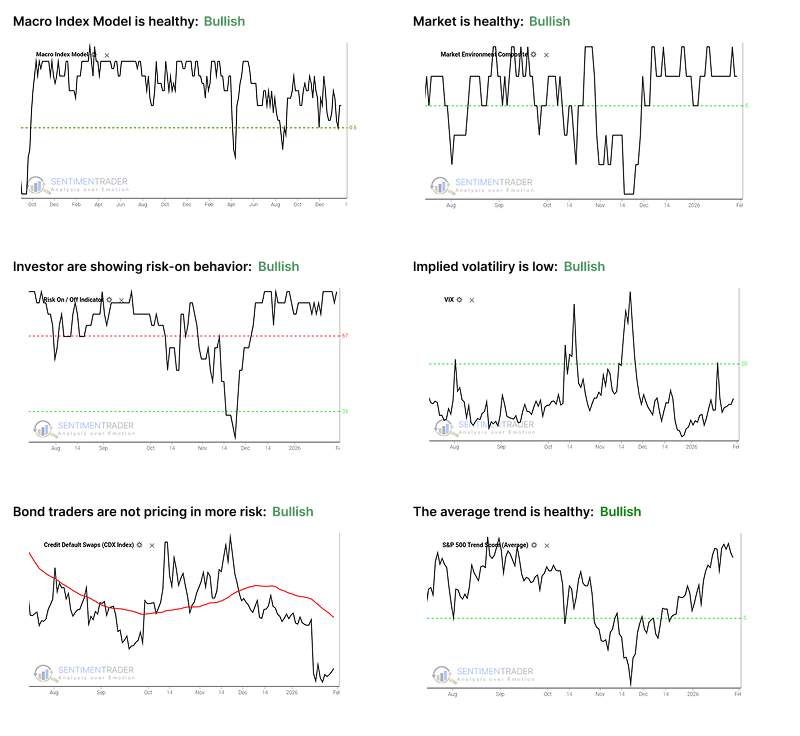
- The Macro Index Model is above the 50% threshold, which has been a vital level as outlined here.
- The Market Environment has been skittish, but is currently healthy. Future returns, especially for higher-beta indices, has been markedly better, with less risk, when the environment is healthy as outlined here.
- The Risk On / Off Indicator shows that investors are still in risk-on mode. This has been a good sign for future returns as outlined here.
- Implied volatility remains below 20, showing a calm environment. The S&P 500 has perfomed well when this is the case as outlined here.
- Credit default swap spreads are below their 50-day moving average, which drastically improves stock returns as outlined here.
- A composite of trend measures in SPY and the average S&P 500 stock remain above 5, which show healthy trend conditions.
Weight of Evidence Favors Bullish Stock Market Outlook
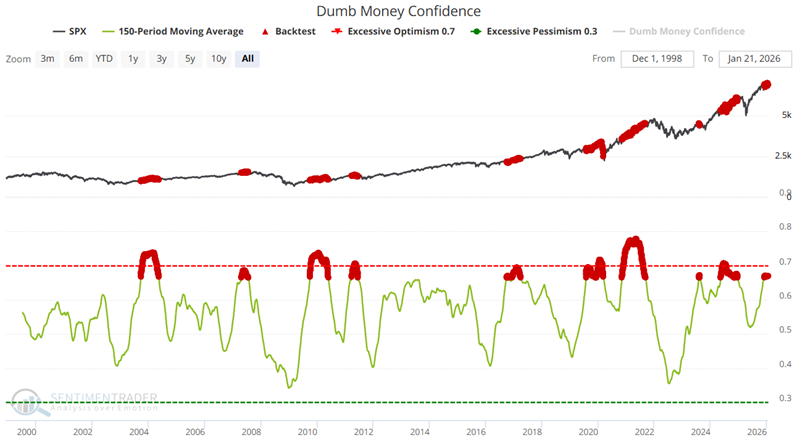
The first indicator test we will examine looks at the 150-day average of our Dumb Money Confidence. Theoretically, Dumb Money Confidence readings are unfavorable for stocks. However, when we apply a long-term approach, it tends to act more like a trend-following indicator.
The chart below highlights all dates when the 150-day moving average for dumb Money Confidence was above 0.669. As we can see below, this tends to occur during market uptrends and more often than not has seen further follow-through to the upside.
Natural Gas Sentiment Reaches Dangerous Extremes
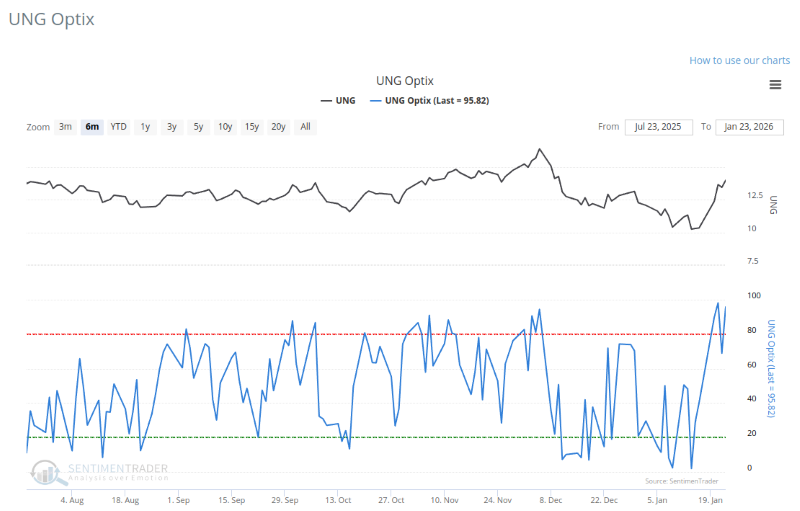
Natural gas trading is often not for the faint-hearted. Although absolute U.S. natural gas production remains high, producers have maintained caution following a prolonged period of depressed prices. This caution is now manifesting as price sensitivity. Even minor shifts in demand expectations can trigger violent price swings. As an arctic blast swept across the Eastern U.S., causing temperatures to plummet and bringing life-threatening wind chill warnings, U.S. natural gas futures skyrocketed nearly 70% in just one week.
The United States Natural Gas Fund (UNG), designed to track natural gas futures prices, saw its Optix exceed 95% alongside the surge in gas prices, triggering our Optix Reversal Model.
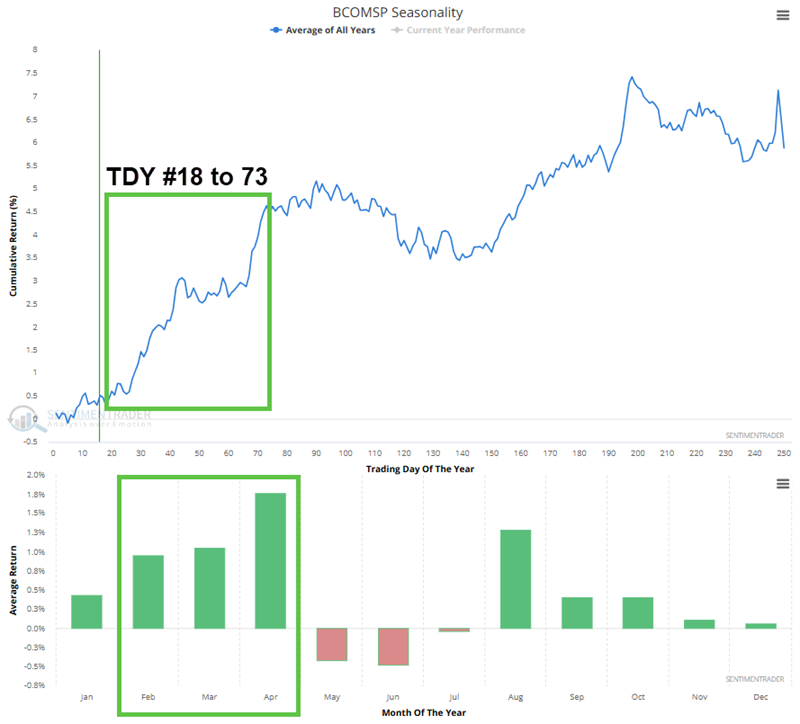
Commodities Begin Seasonally Strong Period
The Bloomberg Commodity Spot Price Index (BCOMSP) has gained more than 10% for the year through January 276th.
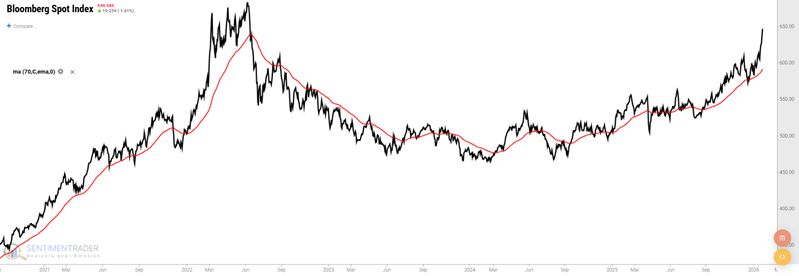
The chart below shows the annual seasonal trend for the Bloomberg Commodity Spot Price Index (BCOMSP). Note the tendency for favorable action between Trading Day of the Year (TDY) #18 and #73. For 2026, this period extends from the close on January 28th through April 17th. February, March, and April are some of the strongest months of the year.
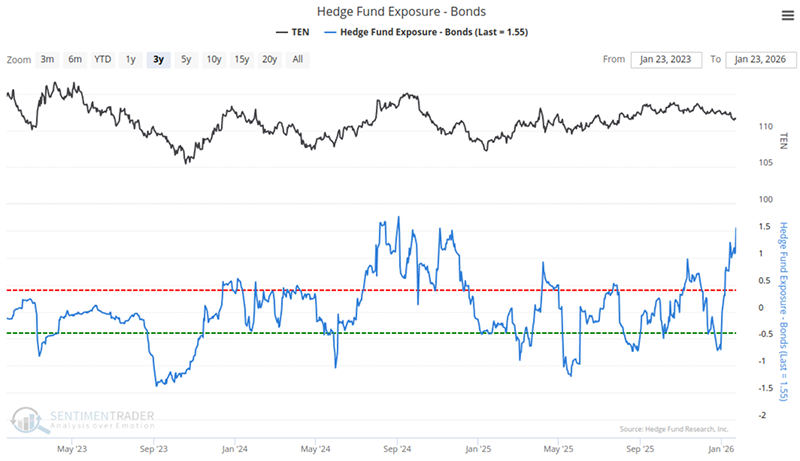
Bond Market Faces Institutional Crowding and Seasonal Weakness
Unlike a typical market bottom, the sentiment in the current bond market is not pure panic, but more like a "resignation" to the high interest rate environment. Mainstream financial media are no longer keen on predicting when the Federal Reserve will "rescue the market", and instead have begun to publish numerous analyses on why inflation is difficult to return to 2%.
A noteworthy structural change comes from the position status of the "smart money". According to the latest survey data, hedge funds' exposure in the bond market has climbed to the highest level in a year, with its ranking score hitting an extreme value.
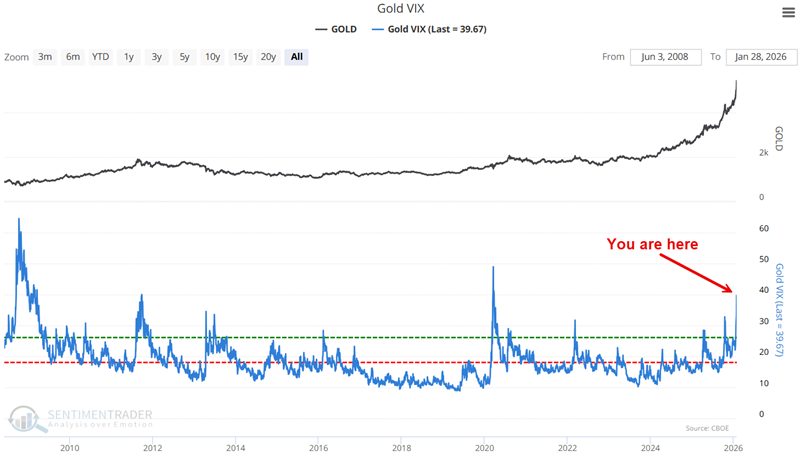
Gold VIX Spike Suggests Long-Term Metals Upside
Similar to the VIX, which most people are familiar with and tracks traders' expectations of future volatility in the stock market based on option pricing models, our Gold VIX indicator tracks volatility expectations using options on the SPDR Gold Trust ETF (GLD).
As shown in the chart below, Gold VIX recently spiked to a level rarely seen before.
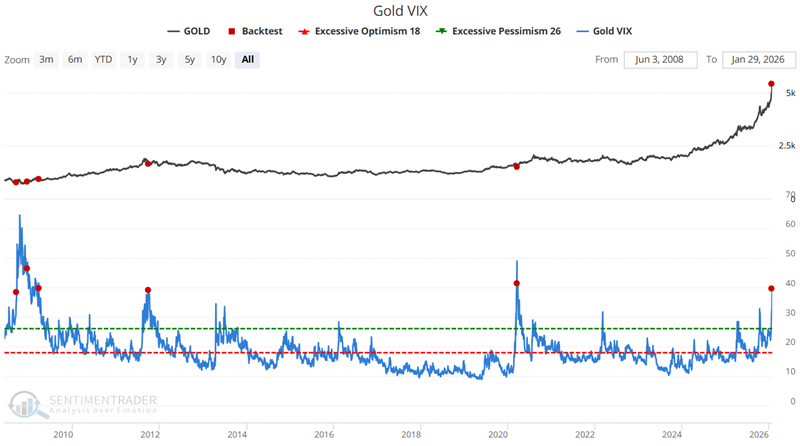
The chart below highlights, with a red dot, the rare occasions when the Gold VIX crossed above 38 for the first time in three months.
About TradingEdge Weekly...
The goal of TradingEdge Weekly is to summarize some of the research published to SentimenTrader over the past week. Sometimes there is a lot to digest, and this summary highlights the highest conviction or most compelling ideas we discussed. This is NOT the published research; rather, it pulls out some of the most relevant parts. It includes links to the published research for convenience, and if you don't subscribe to those products, it will present the options for access.