
TradingEdge Weekly for Jan 23 - Gold stock seasonality, Industrial sector signals, Gold/Silver ratio, Consumer staples crowding

Key points:
- Introducing the JK 8-Year Gold Stock Calendar and its seasonal patterns
- Bullish signal triggered by Industrial stocks outperforming the S&P 500
- In-depth analysis of the Sentimentrader's New TCTM Confirmation Model components
- Monitoring the Gold/Silver ratio for potential trading opportunities
- Extreme crowding signals in Consumer Staples stocks
House view:
- Stocks:
- Short-term: Bullish. Geopolitical risk premiums have declined significantly, with the VIX falling below 20, as market risk appetite rebounds. Major U.S. indices rally with Nasdaq leading on tech and clean energy strength; short covering and fresh long positions drive broad-based gains.This time frame covers 1 - 4 weeks.
- Intermediate-term: Bullish. AI capital expenditure cycle and stable Fed policy expectations underpin tech sector outperformance. Clean energy stocks benefit from tariff risk removal and supply chain stability; semiconductor names ride the global AI super-cycle momentum. This time frame covers 1-5 months.
- Long-term: Bullish. U.S. economic resilience is reinforced by easing trade tensions and moderating inflation. Tech giants with robust cash flow and AI monetization capabilities lead market gains; clean energy and industrial stocks leveraged to domestic manufacturing reshoring offer structural upside. Valuation concerns linger but are offset by earnings growth driven by macro stability and sector-specific catalysts. This time frame covers 6-12 months.
- Overweight tech (AI hardware/software), clean energy (solar, hydrogen), and large-cap banks with strong balance sheets.
- Avoid regional banks facing asset quality deterioration and energy equities vulnerable to structural oil supply surplus.
- Long-term opportunities exist in undervalued industrials tied to U.S. infrastructure and national security initiatives.
- Bonds: Long-term cycles remain bearish. U.S. Treasury market remains stable amid equity and commodity volatility. 10-year yields hold steady as mild PCE inflation data anchors Fed policy expectations; yield curve steepens with short-end rates pricing in potential 2026 rate cuts. The Fed is expected to hold rates at January FOMC meeting but may signal March cut possibility, reinforcing bond market stability in the near term.
- Commodities: Trend models signal bullish positioning for precious metals. Extreme divergence defines the U.S.-focused commodities space, with bearish trends in energy and bullish momentum in precious metals.
- Crude Oil: Bearish. EIA's 2026 price forecast signals a structural supply surplus. Oil prices will decline in 2026 as global oil production will exceed global oil demand, leading to rising oil inventories. Avoid long positions in crude futures; energy equities face earnings contraction risks.
- Precious Metals: Bullish. Gold hits all-time highs and Goldman Sachs has raised its end-2026 gold price forecast to $5,400 per ounce from $4,900/oz earlier. Rally decouples from traditional drivers (dollar, rates), reflecting renewed focus on gold's monetary attributes. Strategic allocations are recommended; pullbacks present incremental buying opportunities.
- Crypto: We follow several simple systems for bitcoin, which we consider the equivalent of the S&P 500 for crypto. Due to bitcoin's explosive growth over long periods, it's dangerous to equate neutral conditions with being bearish for some of these. However, if a system is "out," we consider it bearish for this summary.
- Triple 40: Bullish → Bearish
- RSI Momentum: Bearish
- Trend and Relative Trend: Bearish
- PMI: Bearish
- M2 ROC: Bullish
- Notable Moves in Global Markets:
- Europe: The biggest beneficiary of tariff risk removal; STOXX 600 rebounds sharply, erasing earlier weekly losses. German DAX and French CAC 40 outperform on relief rally in export-oriented sectors (automotive, industrial manufacturing). Corporate M&A activity picks up, with telecom giants rallying on asset divestment deals that unlock cash flow and optimize global portfolios.
- Japan: Nikkei 225 rises strongly, driven by AI hardware and semiconductor material stocks' alignment with global tech momentum. The Bank of Japan announced its first interest rate decision for 2026. In line with market expectations, the central bank announced it would maintain the current policy interest rate at 0.75%.
Where we're at
Most investors have the most riding on equities. We feel that the most significant determinants of success for investors are whether to adjust their allocation to that asset class based on factors that have historically had a good record of preceding above- or below-random returns in the months ahead.
Those factors include the probability of a looming recession, sentiment, price action, volatility, breadth, and the bond market. The chart below summarizes the main indicators and composite models we watch for those factors, and they're mostly in bullish regimes. Valuations are not part of these factors since the relationship has been too inconsistent on time frames under one year.
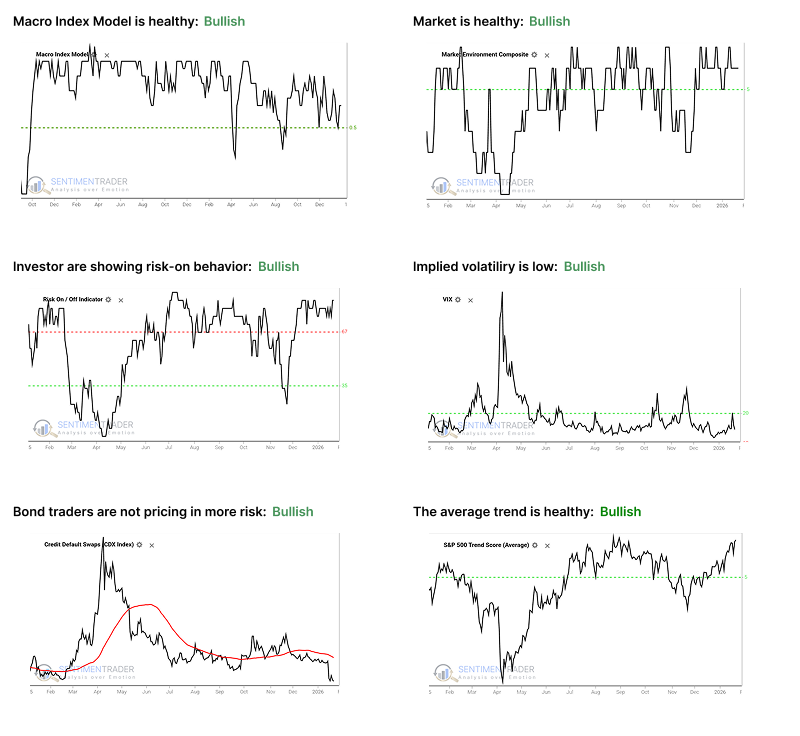
- The Macro Index Model is above the 50% threshold, which has been a vital level as outlined here.
- The Market Environment has been skittish, but is currently healthy. Future returns, especially for higher-beta indices, has been markedly better, with less risk, when the environment is healthy as outlined here.
- The Risk On / Off Indicator shows that investors are still in risk-on mode. This has been a good sign for future returns as outlined here.
- Implied volatility remains below 20, showing a calm environment. The S&P 500 has perfomed well when this is the case as outlined here.
- Credit default swap spreads are below their 50-day moving average, which drastically improves stock returns as outlined here.
- A composite of trend measures in SPY and the average S&P 500 stock remain above 5, which show healthy trend conditions.
Introducing the JK 8-Year Gold Stock Calendar
Gold stocks are a highly volatile asset class and capable of tremendous advances and relentless, devastating declines. They are also highly cyclical in nature, though not necessarily in obvious ways. The JK 8-Year Gold Stock Calendar (JK8YC) is presented here as a standalone model that identifies seasonal patterns in gold stock price action.
The Gold Bugs Index (ticker: HUI) has shown significant correlation with gold bullion but also periods of outperformance and underperformance. The JK8YC calendar repeats every eight calendar years, labeling each month as "Bullish," "Bearish," or "Neutral." The most recent 8-year cycle began in January 2021, and we are now in Year 6, Month 1.
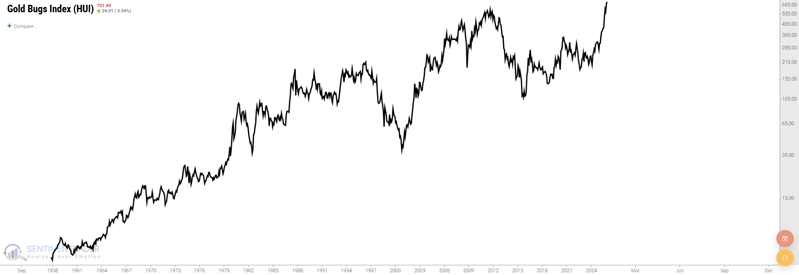
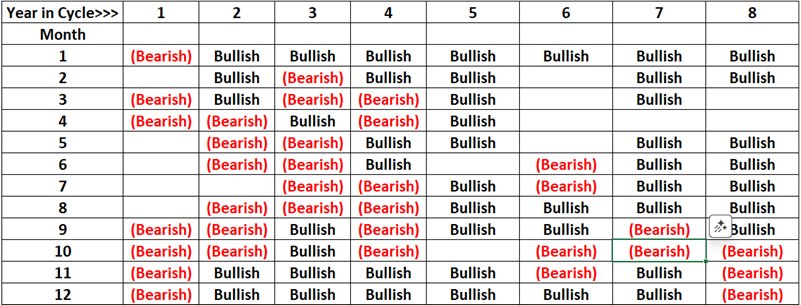
Historical performance shows that $1 invested only during "Bullish" months grew to $149,961, while investments during "Bearish" months shrank to $0.0012. This demonstrates the potential power of seasonal timing in gold stocks.
Bullish Market Signal from the Industrial Sector
A model comparing the equal-weighted S&P 500 Industrial sector to the S&P 500 Index has triggered a buy signal, indicating that industrial sector stocks on average outperform the S&P 500 Index. This relative price trend model is a component of the TCTM Composite Confirmation Model.
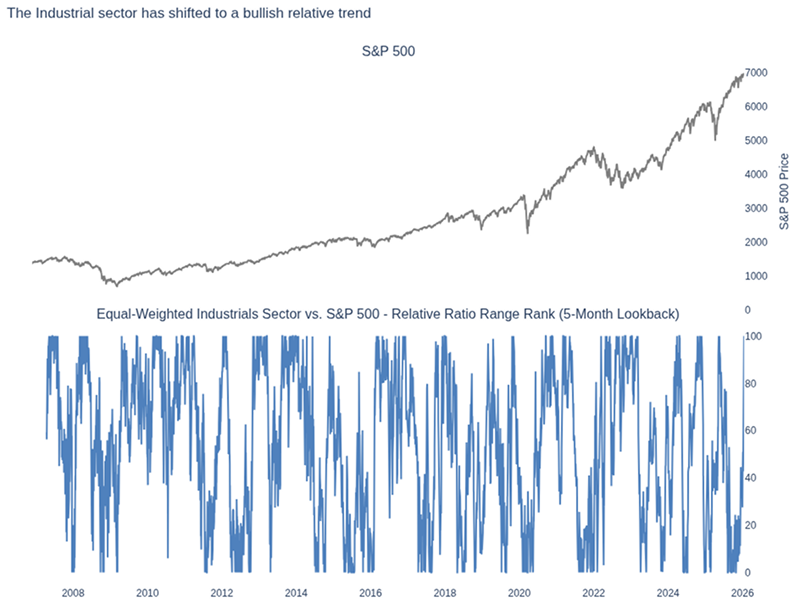
When the relative ratio of the equal-weighted S&P 500 Industrial Sector to the S&P 500 Index rises from the bottom of its five-month range to the 98th percentile, the S&P 500 Index often achieves exceptional returns and win rates. This signal currently suggests an optimistic outlook for the sustainability of the S&P 500 Index's upward trend.
Deep Dive: TCTM Composite Confirmation Model Components
The Sentimentrader's New TCTM (S-TCTM) Composite Confirmation Model includes ten measures for identifying extreme momentum through internal and external participation. These components validate market breadth through cyclical sector participation, macro-liquidity signals (ISM & OECD), and long-term trend scores.
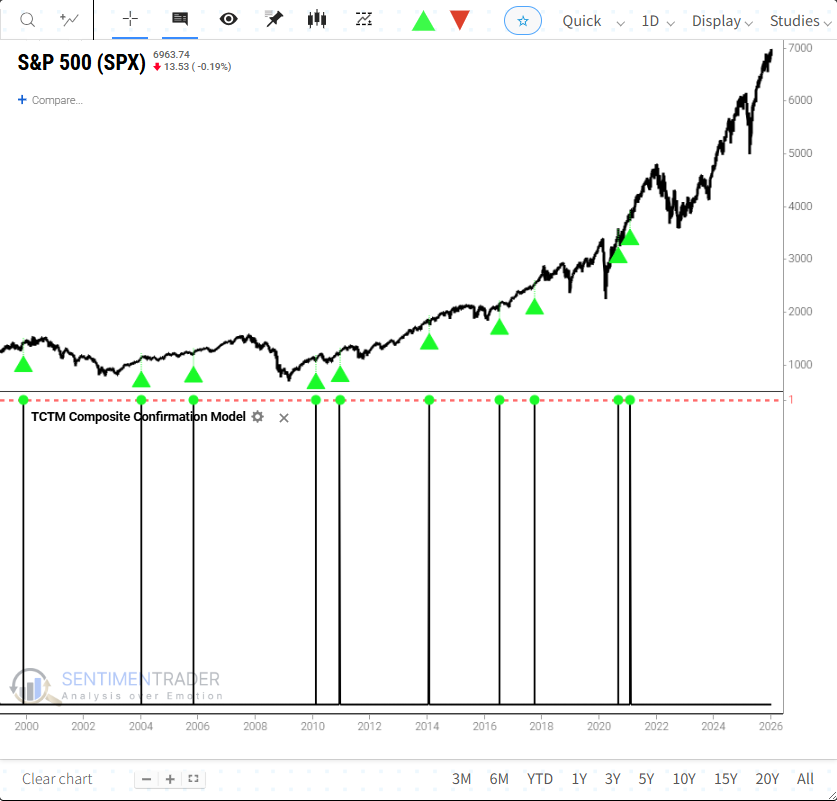
Key components include the Cyclical Group Average Percent Below High Buy model, which identifies when cyclical sectors have recovered from severe selling, and the Composite Trend Model, which scores market trend health on multiple dimensions. Historically, when these indicators align, they confirm durable uptrends with high win rates over 6-12 months.
Monitoring the Gold/Silver Ratio
The relationship between Gold and Silver shows clear cyclical patterns in terms of relative performance. A simple strategy of holding gold when the Gold/Silver Ratio (GSR) drops below 50 and switching to silver when it rises above 80 has shown significant long-term advantages.
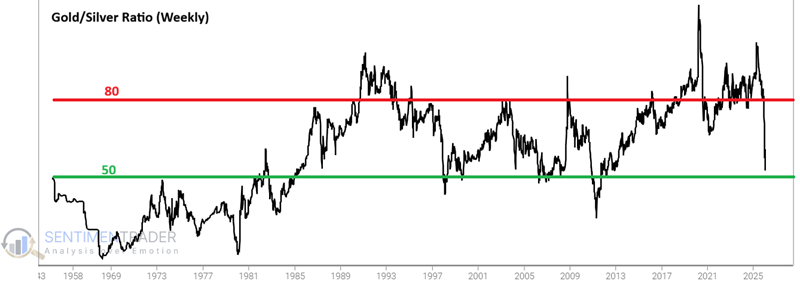
The GSR closed the week of January 16th at 51.16, the lowest reading in 13+ years. While currently still favoring silver, a drop below 50 would signal a switch to gold based on this model's historical performance.
Extreme Crowding in Consumer Staples
Recent market volatility has driven capital into defensive Consumer Staples (XLP), pushing multiple indicators to historical extremes. The XLP Panic Breadth Composite shows complete absence of panic, while 95% of constituents have 10-day RSRR rankings in the top 20% of the market.
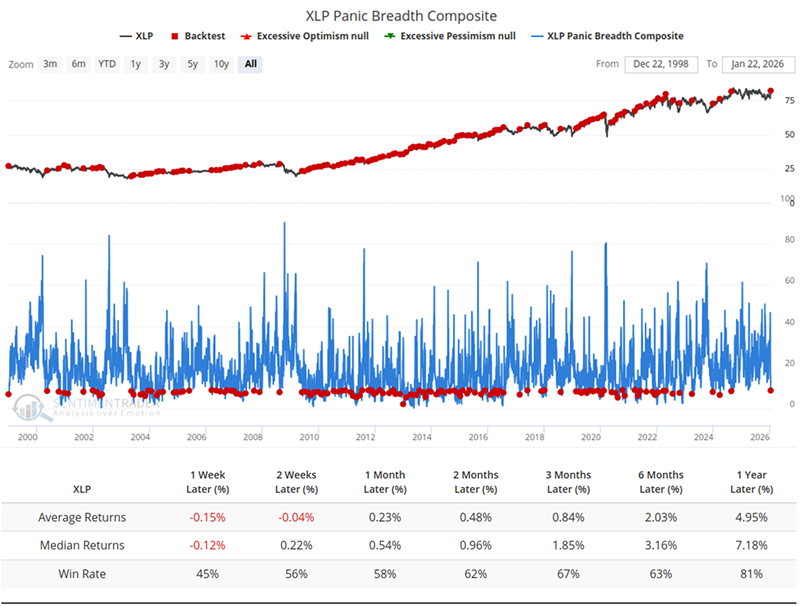
A composite count model shows such simultaneous extreme readings are rare and have typically been followed by negative returns (-4.0% average over 6 months). This suggests the sector's usual defensive characteristics may not hold in the near term.
About TradingEdge Weekly...
The goal of TradingEdge Weekly is to summarize some of the research published to SentimenTrader over the past week. Sometimes there is a lot to digest, and this summary highlights the highest conviction or most compelling ideas we discussed. This is NOT the published research; rather, it pulls out some of the most relevant parts. It includes links to the published research for convenience, and if you don't subscribe to those products, it will present the options for access.