
TradingEdge Weekly for Jan 2 - Unleaded Gas reversal, Gold's risk, Year 6 stock performance, Mid-Decade Bulge, Russell 2000 momentum

Key points:
- Unleaded Gas may be setting up for a reversal as sentiment and seasonality suggest potential upside
- Gold's risk level has risen to a 20-day average of 7, signaling elevated sentiment and potential continuation
- Historical analysis of Year 6 in the decade suggests stock market strength in Q1 and Q4 with potential trouble in between
- The Mid-Decade Bulge cycle indicates strong performance for stocks during specific periods of each decade
- Russell 2000 has stayed above its 252-day moving average for 100 consecutive days, a rare occurrence with mixed historical implications
House view:
- Stocks:
- Short-term: Modestly Bearish. Reversed Santa Claus Rally (S&P 500 -0.74% on Dec 31, 2025) signals elevated near-term volatility. Post-year-end profit-taking, Q1 earnings uncertainty, and new tariff policy concerns weigh on sentiment. Historical adage "If Santa Claus should fail to call, bears may come to Broad and Wall" serves as a key warning for early 2026 downside risks. This time frame covers 1 - 4 weeks.
- Intermediate-term: Cautious. Elevated correction risks linger amid stretched valuations and reversed Santa Claus Rally in late 2025. Wall Street's divergent outlooks amplify uncertainty. This time frame covers 1-5 months.
- Long-term: Bullish. Structural growth drivers remain intact: AI narrative shifts from CapEx to OpEx with commercialization potential. Cyclical sectors (industrial, healthcare) are poised to benefit from AI spillover effects, while small-caps may narrow valuation gap with mega-caps as liquidity conditions improve. This time frame covers 6-12 months.
- Cyclical momentum favors AI application-focused tech, industrial, and healthcare sectors - leveraged to productivity gains and policy tailwinds.
- Defensive sectors (utilities, consumer staples) provide stability during volatility spikes, with high dividend yields offsetting valuation concerns.
- Very long-term (one year+) favors mean reversion to undervalued small-cap growth stocks and sectors benefiting from global de-dollarization trends.
- Bonds: Long-term cycles remain bearish. 10-year US Treasury yields with limited downside in 2026 due to "supply tsunami" from expanding fiscal deficits. Major banks forecast yields to range between 3.75%-4.5%.
- Commodities: Extreme divergence persists between precious metals and energy. An effective commodity trend model is currently bullish for gold and bearish for crude oil. Gold closed 2025 with ~64% annual gain. Crude oil (WTI/Brent) faces structural headwinds from non-OPEC+ supply growth and slowing demand.
- Precious metals: Maintain long-term strategic allocation as "trust anchor" amid global macro uncertainty; short-term pullbacks present buying opportunities.
- Crude oil: Avoid long positions; focus on tactical trades only around geopolitical supply disruptions, with downside risks dominating the structural outlook.
- Crypto: We follow several simple systems for bitcoin, which we consider the equivalent of the S&P 500 for crypto. Due to bitcoin's explosive growth over long periods, it's dangerous to equate neutral conditions with being bearish for some of these. However, if a system is "out," we consider it bearish for this summary.
- Triple 40: Bearish
- RSI Momentum: Bearish
- Trend and Relative Trend: Bearish
- PMI: Bearish
- M2 ROC: Bullish
- Notable Moves in Global Markets:
- Europe (STOXX 50): 2025 closed with 18% annual gains, driven by EU's €800bn "Readiness 2030" defense spending, ECB's dovish policy, and valuation discount vs US equities. Aerospace & defense stocks led the rally.
- Japan (Nikkei 225): 2025 surged 26% to 50,339 (broke 50k milestone), fueled by PM Takaichi's pro-growth policies, wage-inflation virtuous cycle, and TSE's P/B reform.
- Greater China (Hang Seng, Shanghai Composite): Hang Seng jumped over 27% in 2025, led by "DeepSeek" AI model breakthrough, policy stability (property/debt risk mitigation), and RMB appreciation.
Where we're at
Most investors have the most riding on equities. We feel that the most significant determinants of success for investors are whether to adjust their allocation to that asset class based on factors that have historically had a good record of preceding above- or below-random returns in the months ahead.
Those factors include the probability of a looming recession, sentiment, price action, volatility, breadth, and the bond market. The chart below summarizes the main indicators and composite models we watch for those factors, and they're mostly in bullish regimes. Valuations are not part of these factors since the relationship has been too inconsistent on time frames under one year.
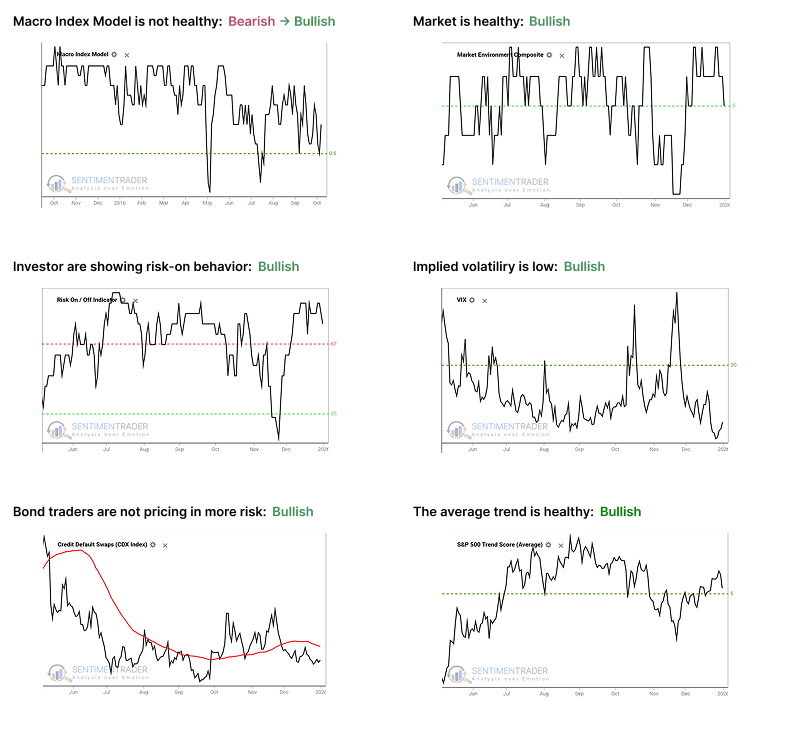
- The Macro Index Model is above the 50% threshold, which has been a vital level as outlined here.
- The Market Environment has been skittish, but is currently healthy. Future returns, especially for higher-beta indices, has been markedly better, with less risk, when the environment is healthy as outlined here.
- The Risk On / Off Indicator shows that investors are still in risk-on mode. This has been a good sign for future returns as outlined here.
- Implied volatility remains below 20, showing a calm environment. The S&P 500 has perfomed well when this is the case as outlined here.
- Credit default swap spreads are below their 50-day moving average, which drastically improves stock returns as outlined here.
- A composite of trend measures in SPY and the average S&P 500 stock remain above 5, which show healthy trend conditions.
Unleaded Gas may be setting up for a reversal
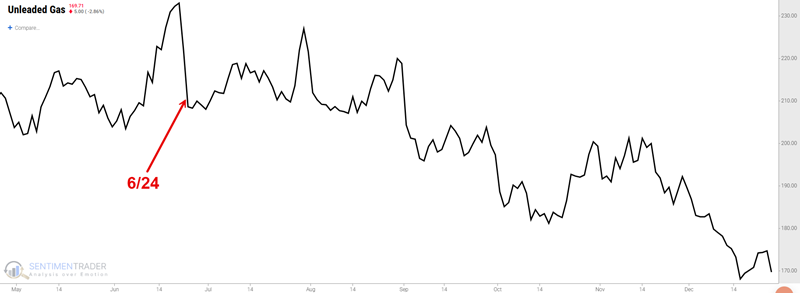
In June 2025, this column discussed the potential for lower prices for unleaded gas. Gas prices are now almost 20% lower than they were at that time.
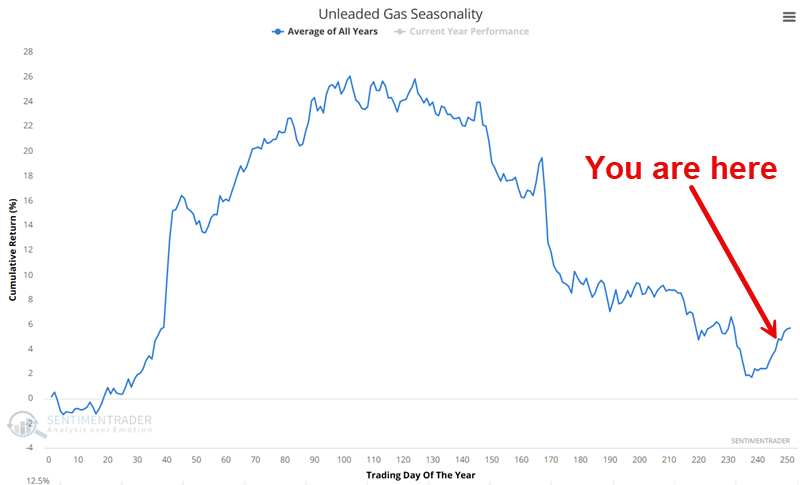
Now, just as "low gas prices" are trending as a topic, sentiment and seasonality are suggesting the potential for a reversal higher.
In the last six months of the year - and to the surprise of many who had warned of soaring inflation due to tariffs - unleaded gasoline prices plunged 20%.
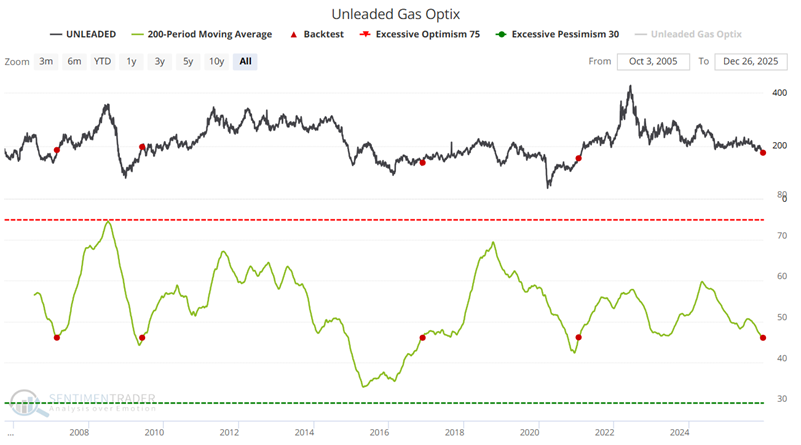
The chart below displays Unleaded Gas along with our Unleaded Gas Optix indicator. The green line represents the 200-day moving average of Unleaded Gas Optix. The red dots highlight those dates when the 200-day average crossed above 46%. The most recent signal occurred on December 24th.
The chart below displays the annual seasonal trend for Unleaded Gas futures. Note the strong propensity for strength during the first half of the year and weakness during the second half.
Gold's risk is rising
Gold's recent rally has pushed its Sentiment-based Risk Level to a 20-day average of 7.
Historically, when this Risk Level is reached, Gold has often continued to trend higher, provided buyers remain active in the first month.
The chart below displays gold returns following these signals. We can observe that the "trend" in gold often persists after the signal is issued.
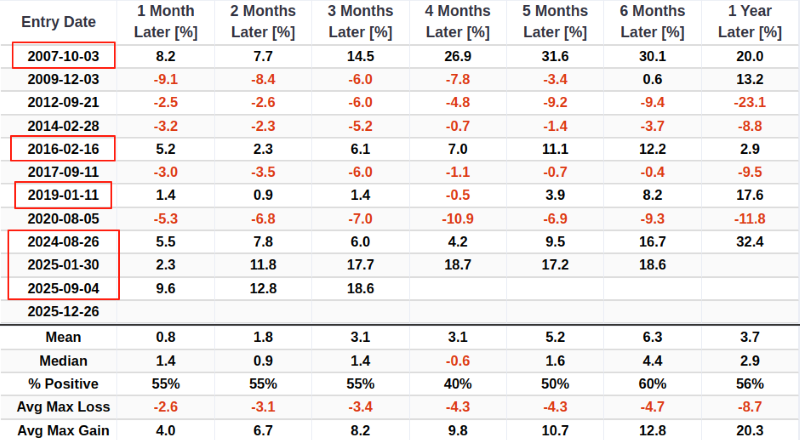
Interestingly, this signal has also served as a buy signal for the US Dollar and the Nikkei 225 over the subsequent year, while the Japanese Yen has typically faced significant headwinds following these periods of elevated gold sentiment.
When the Stock Market Meets Year 6
As we enter 2026, let's examine the historical performance of stocks during previous Years ending in "6".
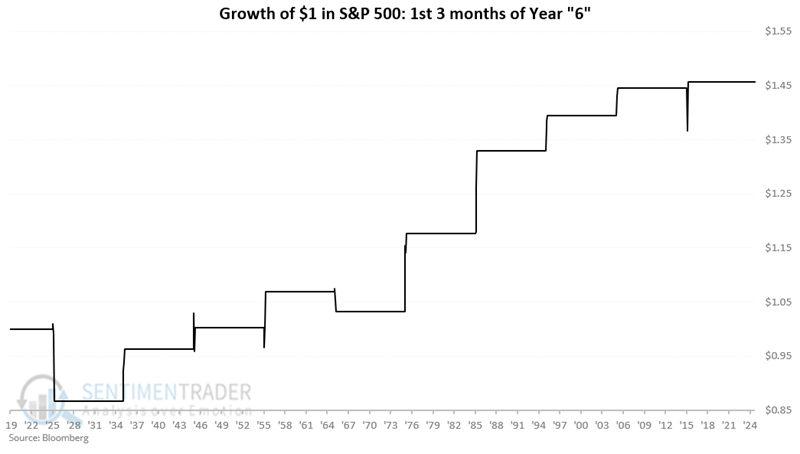
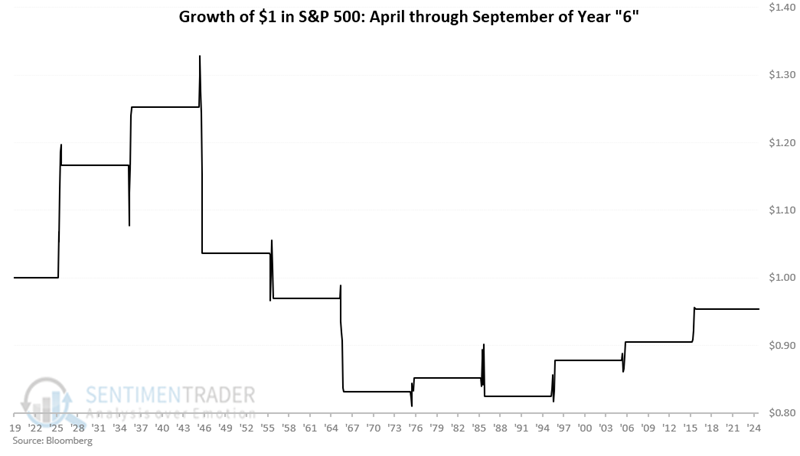
From our analysis, a certain general pattern emerged: First three months = Good, Next six months = So/So, Last three months = Good.
The chart below displays the hypothetical growth of $1 invested in the S&P 500 only during January, February, and March of years ending in "6."
The chart below displays the hypothetical growth of $1 invested in the S&P 500 only during April through September of years ending in "6."
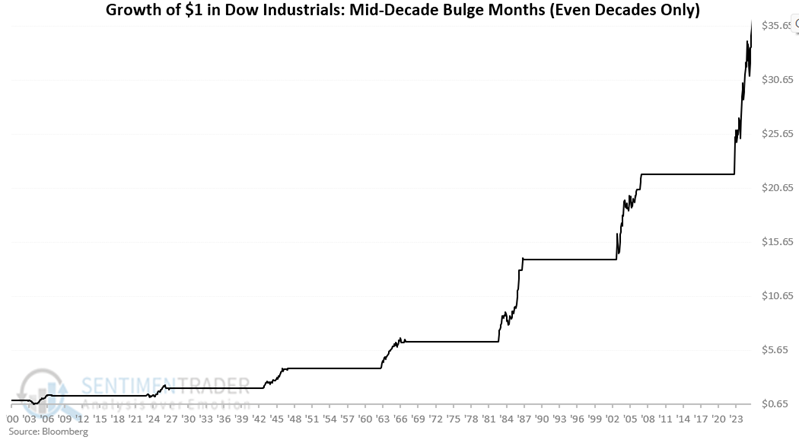
The Stock Market and the Mid-Decade Bulge
A little-known cyclical trend is for the stock market to typically perform better during the middle part of the decade than during other periods.
For Even decades (2020-2029), the Mid-Decade Bulge began on October 1st, 2022, and will extend through March 31st, 2026. It will then resume on October 1st, 2026, and conclude on December 31st, 2026.
The chart below displays the hypothetical growth of $1 invested in the Dow Industrials only during these 45 months, starting with even decades from 1900.
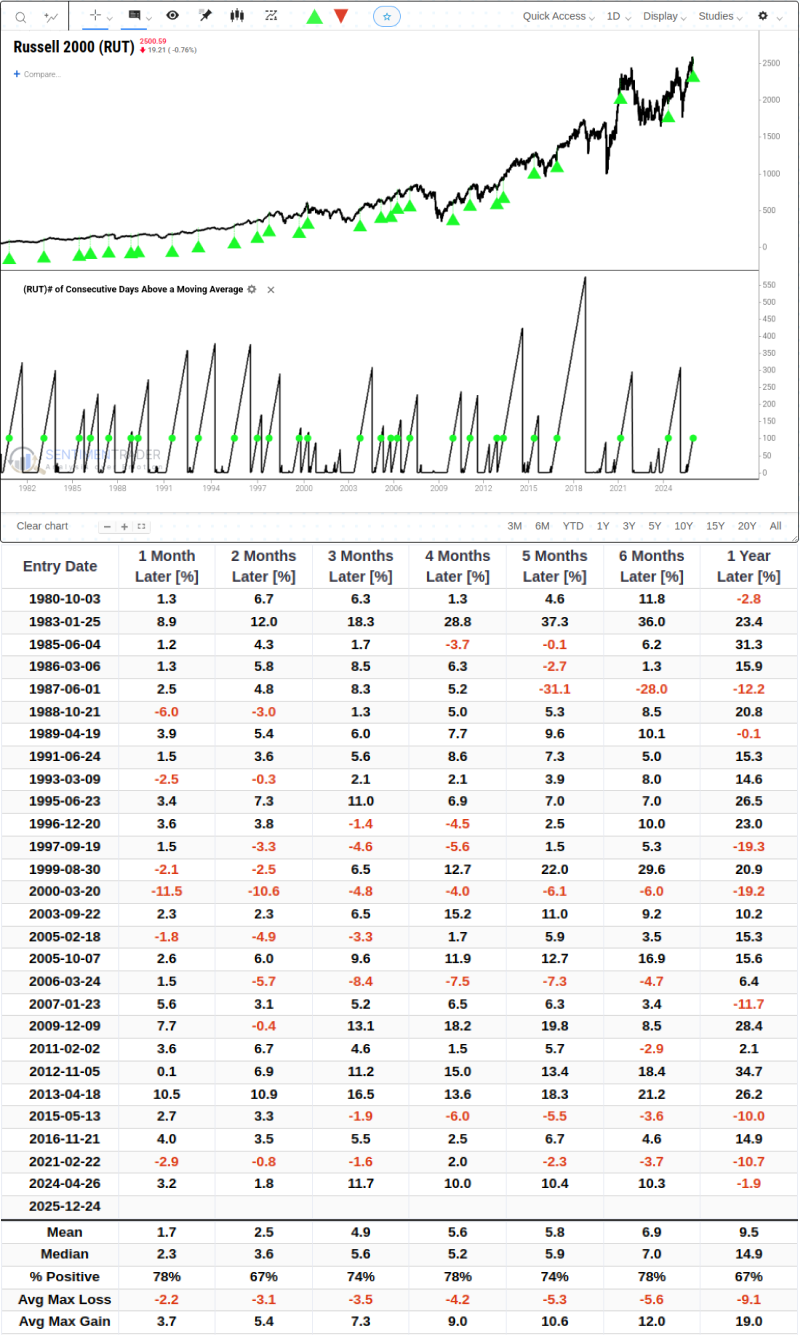
Russell 2000 Has Stayed Above Its Average for 100 Days
The Russell 2000 Index has closed above its 252-day moving average for 100 consecutive trading days, marking the 28th time in the past 45 years.
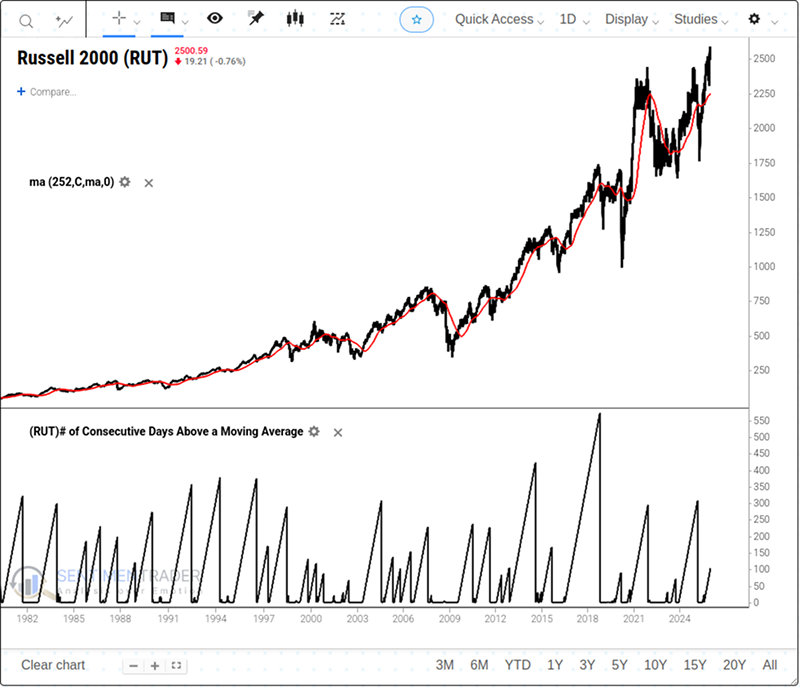
The chart below shows the forward returns of the index after it has stayed above its 252-day average for 100 consecutive days. The win rate hovers around 75% for most timeframes.
About TradingEdge Weekly...
The goal of TradingEdge Weekly is to summarize some of the research published to SentimenTrader over the past week. Sometimes there is a lot to digest, and this summary highlights the highest conviction or most compelling ideas we discussed. This is NOT the published research; rather, it pulls out some of the most relevant parts. It includes links to the published research for convenience, and if you don't subscribe to those products, it will present the options for access.