
TradingEdge Weekly for Jan 16 - Commodity seasonality, Basic Materials breakout, SPX breadth thrust, Small-Cap performance, AAII sentiment

Key points:
- Seasonal trends in Platinum, Corn, Soybeans, Palladium, US Dollar, Natural Gas, and Euro
- Basic Materials sector shows 100% of stocks above 50-day moving average
- SPX and NYSE Advance/Decline Line hit simultaneous all-time highs
- Small-Cap vs Large-Cap performance reversal signal
- AAII Bull Ratio hits 52-week high
House view:
- Stocks:
- Short-term: Range-bound. The VIX has increased slightly but remains within a calm environment. Weakening U.S. labor market data triggers growth concerns. Major U.S. indices trade sideways with tech sector consolidation; capital rotates to defensive sectors amid soft-landing uncertainty. Investors await January FOMC meeting for policy clarity. This time frame covers 1 - 4 weeks.
- Intermediate-term: Cautious. Valuations remain stretched relative to historical averages, with earnings growth expectations dependent on the successful monetization of AI technologies and the sustainability of a soft-landing scenario. Global monetary policy divergence, alongside lingering geopolitical risks, amplifies market volatility. This time frame covers 1-5 months.
- Long-term: Bullish. U.S. economic resilience persists relative to global peers; corporate earnings growth is supported by AI-driven productivity gains and manufacturing reshoring trends. The Fed's gradual easing cycle (limited to 1-2 cuts in 2026) will help sustain economic expansion without reigniting inflation. Strategic opportunities lie in tech giants with strong cash flow moats and industrial stocks benefiting from domestic investment. This time frame covers 6-12 months.
- Avoid energy equities amid structural oil supply surplus and EIA's bearish price forecast.
- Overweight defensive growth sectors (healthcare) and AI-enabled software/services providers with clear monetization paths.
- Long-term value opportunities in undervalued industrial stocks leveraged to U.S. infrastructure spending.
- Bonds: Long-term cycles remain bearish. U.S. sovereign bond yields have trended higher amid Fed policy uncertainty and geopolitical volatility, with yield curves steepening as short-end rates price in potential monetary easing while long-end yields face pressure from U.S. fiscal expansion and global liquidity tightening driven by policy normalization in other major economies.
- Commodities: Trend models signal bullish positioning for precious metals. Extreme divergence defines the U.S.-focused commodities space, with bearish trends in energy and bullish momentum in precious metals.
- Crude Oil: EIA's 2026 price forecast signals a structural supply surplus. Oil prices will decline in 2026 as global oil production will exceed global oil demand, leading to rising oil inventories. Avoid long positions in crude futures; energy equities face earnings contraction risks.
- Precious Metals: Gold hits record highs driven by geopolitical risks. Maintain strategic allocations; short-term pullbacks present buying opportunities.
- Crypto: We follow several simple systems for bitcoin, which we consider the equivalent of the S&P 500 for crypto. Due to bitcoin's explosive growth over long periods, it's dangerous to equate neutral conditions with being bearish for some of these. However, if a system is "out," we consider it bearish for this summary.
- Triple 40: Bearish → Bullish
- RSI Momentum: Bearish
- Trend and Relative Trend: Bearish
- PMI: Bearish
- M2 ROC: Bullish
- Notable Moves in Global Markets:
- Japan: Japanese equities face volatility amid BoJ's monetary normalization. Yen hits multi-month lows despite rate hikes.
- Europe: Eurozone economies linger near stagnation, with inflation falling faster than growth recovers. ECB faces stronger easing pressure than the Fed, weighing on the euro.
Where we're at
Most investors have the most riding on equities. We feel that the most significant determinants of success for investors are whether to adjust their allocation to that asset class based on factors that have historically had a good record of preceding above- or below-random returns in the months ahead.
Those factors include the probability of a looming recession, sentiment, price action, volatility, breadth, and the bond market. The chart below summarizes the main indicators and composite models we watch for those factors, and they're mostly in bullish regimes. Valuations are not part of these factors since the relationship has been too inconsistent on time frames under one year.
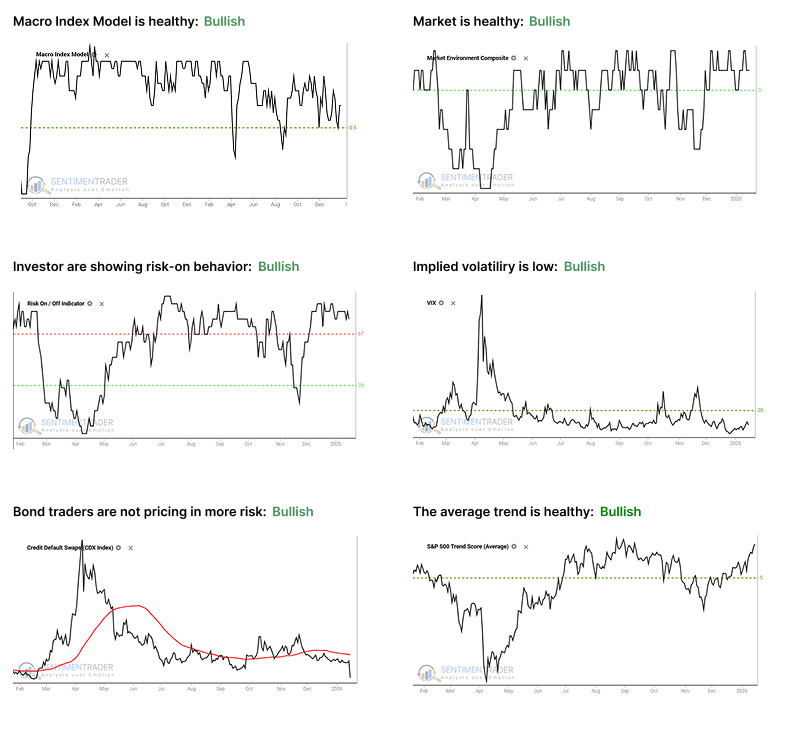
- The Macro Index Model is above the 50% threshold, which has been a vital level as outlined here.
- The Market Environment has been skittish, but is currently healthy. Future returns, especially for higher-beta indices, has been markedly better, with less risk, when the environment is healthy as outlined here.
- The Risk On / Off Indicator shows that investors are still in risk-on mode. This has been a good sign for future returns as outlined here.
- Implied volatility remains below 20, showing a calm environment. The S&P 500 has perfomed well when this is the case as outlined here.
- Credit default swap spreads are below their 50-day moving average, which drastically improves stock returns as outlined here.
- A composite of trend measures in SPY and the average S&P 500 stock remain above 5, which show healthy trend conditions.
Seasonal Opportunities in Commodity Futures and ETFs
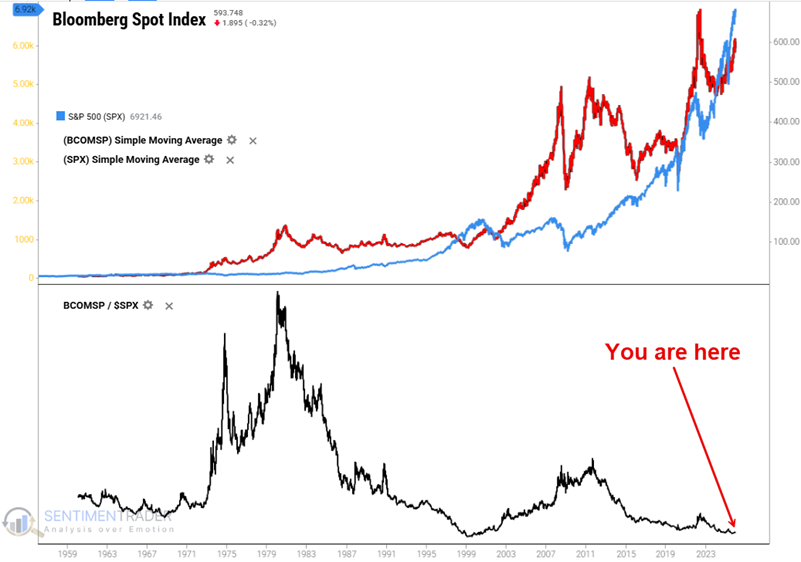
The Bloomberg Commodity Spot Price Index (BCOMSP) gained more than 15% in 2025. Precious metals led the way, with the Invesco DB Precious Metals Fund (DBP) leading the way with a 70% gain. Historically, rallies in precious metals have tended to precede rallies in broader commodity indexes.
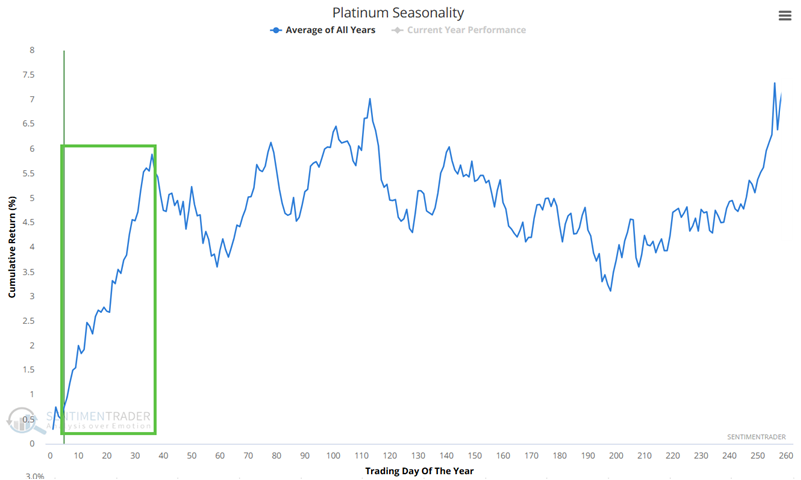
Platinum
Platinum enjoyed a near-vertical ascent from late November to late December. The Annual Seasonal Trend chart for Platinum suggests a bullish bias for the next month or so.
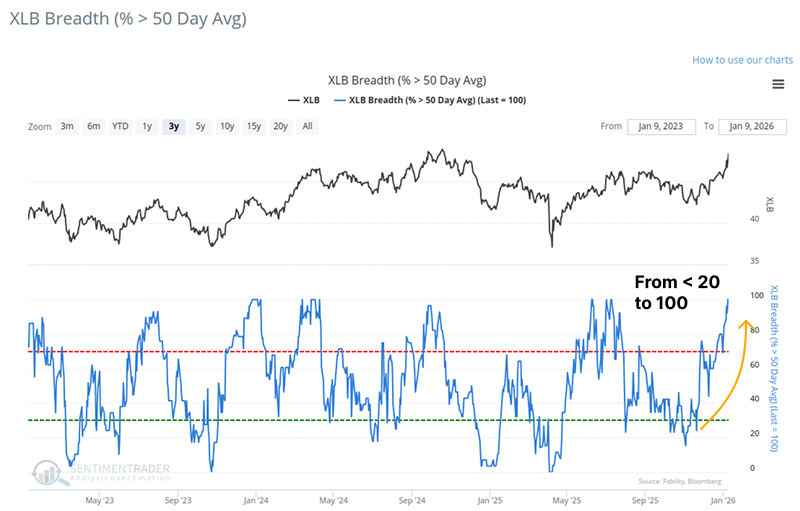
Every Basic Material stock is in an uptrend
The Basic Materials sector (XLB): 100% of its component stocks are trading above their 50-day moving averages. Historically, when participation surges from low levels to 100% within three months, the sector has typically delivered positive returns.
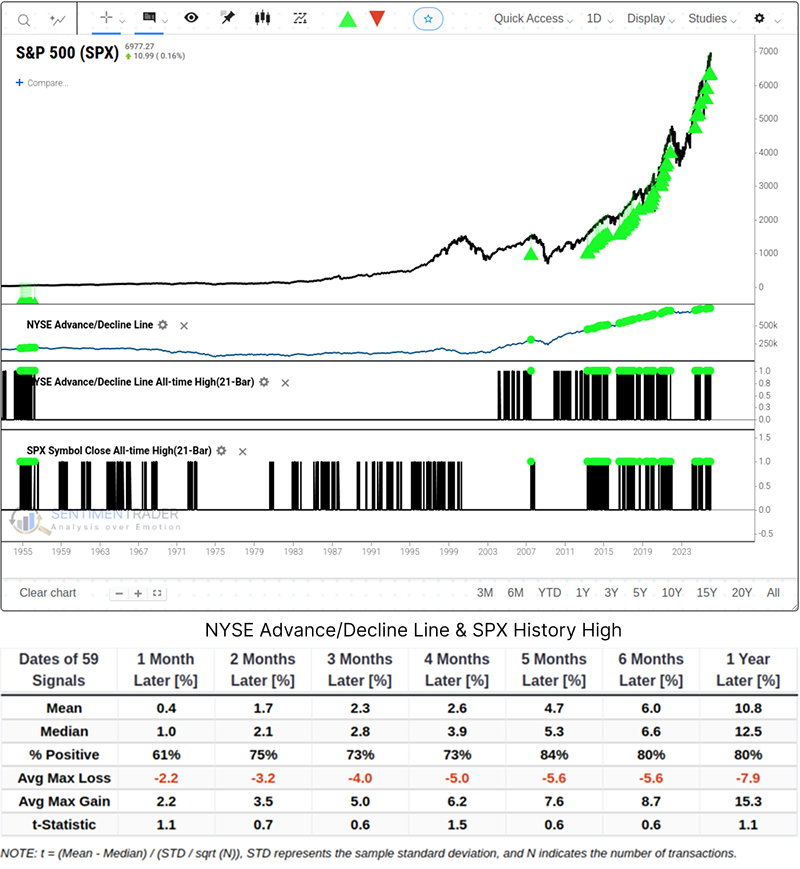
SPX and NYSE Advance/Decline Line Hit New Highs Simultaneously
The NYSE Advance/Decline Line set an all-time high, which indicates that the underlying uptrend momentum has expanded well beyond large-cap stocks to the broader market universe.
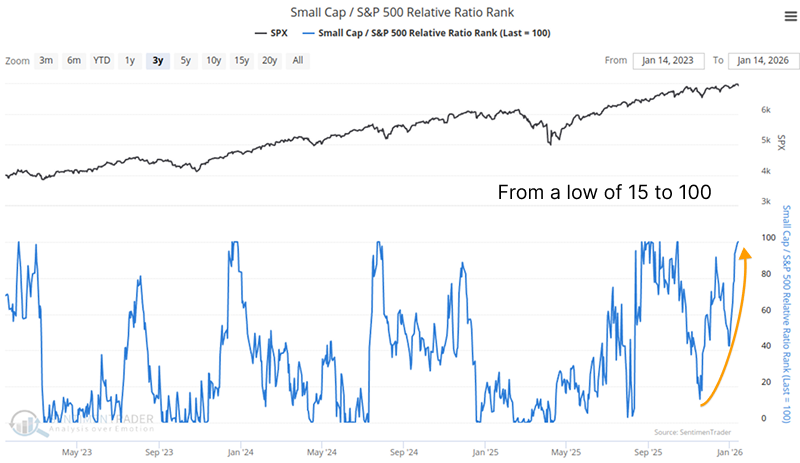
Small-Cap vs Large-Cap Performance
From November 20, 2025, to January 14, 2026, the Russell 2000 Index has rallied sharply by 15.0%, while the S&P 500 Index gained 5.9% over the same period. We track the relative performance ranking of small-cap and large-cap stocks through a dedicated metric - the Small Cap/S&P 500 Relative Ratio Rank.
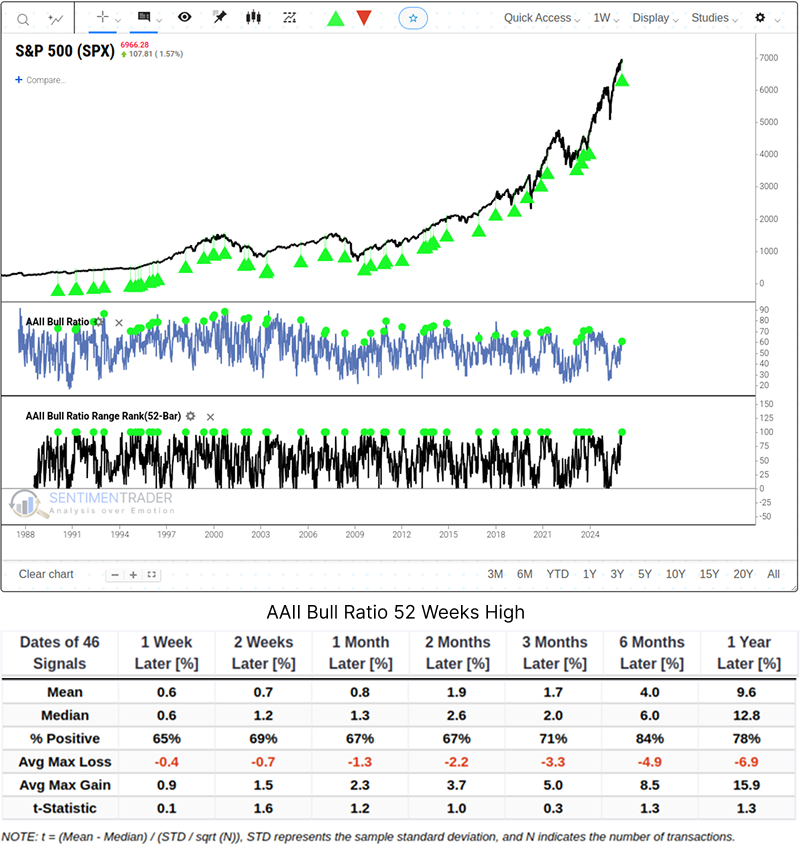
AAII Bull Ratio Hits 52-Week High
The AAII Bull Ratio has hit a 52-week high. The chart below outlines the forward return performance of the SPX following such signals.
About TradingEdge Weekly...
The goal of TradingEdge Weekly is to summarize some of the research published to SentimenTrader over the past week. Sometimes there is a lot to digest, and this summary highlights the highest conviction or most compelling ideas we discussed. This is NOT the published research; rather, it pulls out some of the most relevant parts. It includes links to the published research for convenience, and if you don't subscribe to those products, it will present the options for access.