
TradingEdge Weekly for Feb 6 - January Model signals, T-Bonds February trend, Energy breadth thrust, Macro Index expansion, Nasdaq indicators

Key points:
- January Model hits highest possible reading (+7) for 2026
- T-Bonds show split February performance pattern
- Energy sector triggers concerning breadth thrust signal
- Macro Index expands above 0.7 threshold
- Nasdaq shows multiple concerning breadth signals
House view:
- Stocks:
- Short-term: Modestly bearish. Market conditions have deteriorated, with the VIX breaking above 20. The VIX's rise in the first quarter of each year typically signals weak earnings, though further signals are still needed to confirm the trend. NFP delay creates massive information vacuum and policy uncertainty; AI giants' sky-high Capex triggers FCF collapse fears, leading to brutal valuation repricing of tech stocks. This time frame covers 1 - 4 weeks.
- Intermediate-term: No view. Momentum is ebbing, but from extremely strong levels. AI industry enters a heavy-asset infrastructure era, leading to structural divergence in tech stocks: pure software SaaS faces sustained pressure, while AI infrastructure-related hardware, utilities and materials benefit from industrial chain spillover effects. This is a tug-of-war that shows no clear edge.This time frame covers 1-5 months.
- Long-term: Bullish. U.S. economic resilience persists relative to global peers. Long-term breadth indicators across sectors and global markets show no significant downside, typically signaling positive returns for most stock indices over the next 6 to 12 months. This time frame covers 6-12 months.
- Overweight AI infrastructure-related sectors (hardware, industrial equipment, utilities, materials), defensive sectors (consumer staples, energy) with low valuation and hedging attributes.
- Avoid high-valuation pure software SaaS stocks, tech giants with excessive Capex and unclear FCF recovery expectations, and small-cap stocks highly sensitive to interest rates and liquidity.
- Long-term opportunities lie in AI application-side enterprises with immediate monetization capabilities and real economy sectors benefiting from infrastructure construction and industrial upgrading.
- Bonds: Long-term cycles remain bearish. The U.S. Treasury yield curve is steepening. Real rates remain restrictive, while rising policy uncertainty is driving up volatility across the broader fixed income market. We haven't seen much among analysts' studies to suggest a change in trend.
- Commodities: U.S.-focused commodities present extreme differentiation: precious metals experience a brutal deleveraging crash, while crude oil is in a tug-of-war between supply surplus and geopolitical support.
- Crude Oil: IEA's huge supply surplus forecast forms fundamental pressure, and EIA's 2026 average price forecast points to further downside potential. Geopolitical tensions in the Middle East ease but structural instability remains, providing psychological support above $60.
- Precious Metals: An effective commodity trend model is currently bullish for precious metals, though current geopolitical factors may decouple gold from traditional correlations. Silver experiences a historic flash crash driven by fading geopolitical premium and a stronger dollar, with the parabolic bull trend completely broken; gold suffers technical collateral damage due to liquidity raising, and central bank buying support is offset by short-term deleveraging pressure. Both metals face further downside with no obvious oversold signals, and key support levels are under heavy selling pressure.
- Crypto: We follow several simple systems for U.S.-traded bitcoin, which we consider the equivalent of the S&P 500 for crypto. Amid the market's paradigm shift to real assets and fiat credit doubts, crypto assets face valuation revaluation pressure from tech stock sell-off contagion, but long-term fundamental support from tokenization remains. Market volatility rises with the overall financial market, and short-term price performance is dominated by risk appetite shifts, with structural opportunities tied to institutional adoption and underlying technology innovation.
- Triple 40: Bearish
- RSI Momentum: Bearish
- Trend and Relative Trend: Bearish
- PMI: Bearish → Bullish
- M2 ROC: Bullish
- Notable Moves in Global Markets:
- Europe: STOXX 600 falls with the ECB's hawkish pause (maintaining rates unchanged) disappointing market liquidity expectations. European stocks follow the U.S. tech sell-off; the overall market is under pressure from global risk appetite decline and monetary policy divergence.
Where we're at
Most investors have the most riding on equities. We feel that the most significant determinants of success for investors are whether to adjust their allocation to that asset class based on factors that have historically had a good record of preceding above- or below-random returns in the months ahead.
Those factors include the probability of a looming recession, sentiment, price action, volatility, breadth, and the bond market. The chart below summarizes the main indicators and composite models we watch for those factors, and they're mostly in bullish regimes. Valuations are not part of these factors since the relationship has been too inconsistent on time frames under one year.
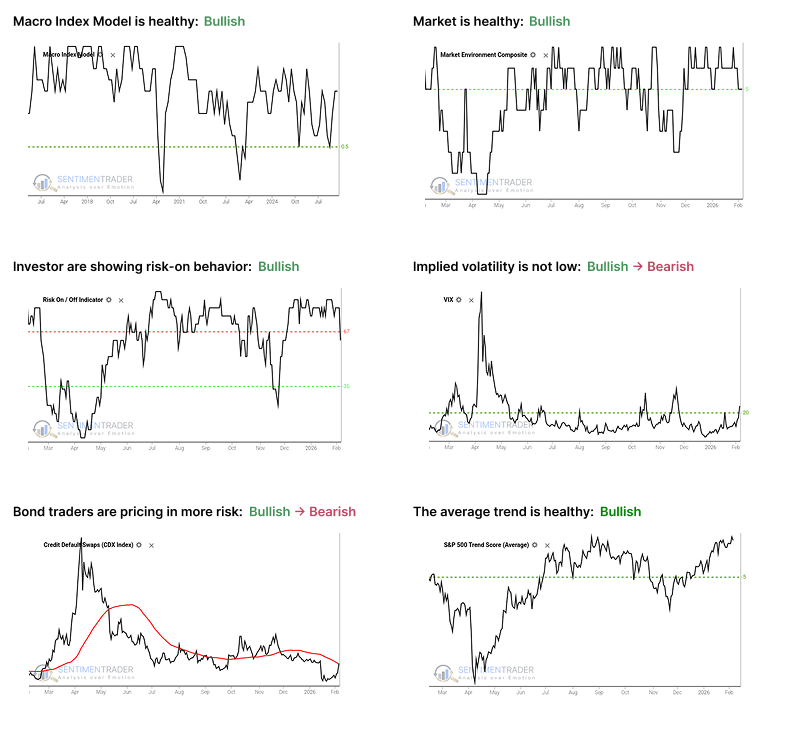
- The Macro Index Model is above the 50% threshold, which has been a vital level as outlined here.
- The Market Environment has been skittish, but is currently healthy. Future returns, especially for higher-beta indices, has been markedly better, with less risk, when the environment is healthy as outlined here.
- The Risk On / Off Indicator shows that investors are still in risk-on mode. This has been a good sign for future returns as outlined here.
- Implied volatility is at or above 20, signaling a volatile environment. The S&P 500 has historically performed poorly when this is the case, as outlined here.
- Credit default swap spreads are above their 50-day moving average, which is modestly concerning as outlined here.
- A composite of trend measures in SPY and the average S&P 500 stock remain above 5, which show healthy trend conditions.
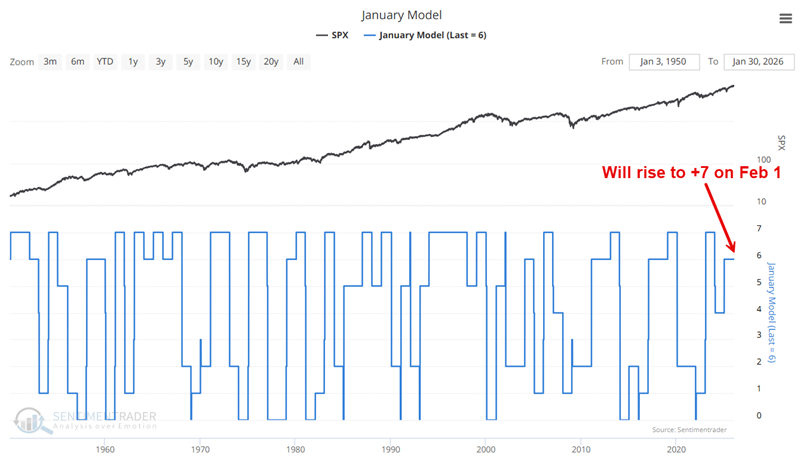
January Model reaches highest possible reading for 2026
The January Model now stands at its highest possible reading of +7 and will remain there through at least the first five trading days of 2027. This occurs when the S&P 500 shows gains in: 1) the entire month of January, 2) the first five trading days, and 3) the last five trading days.
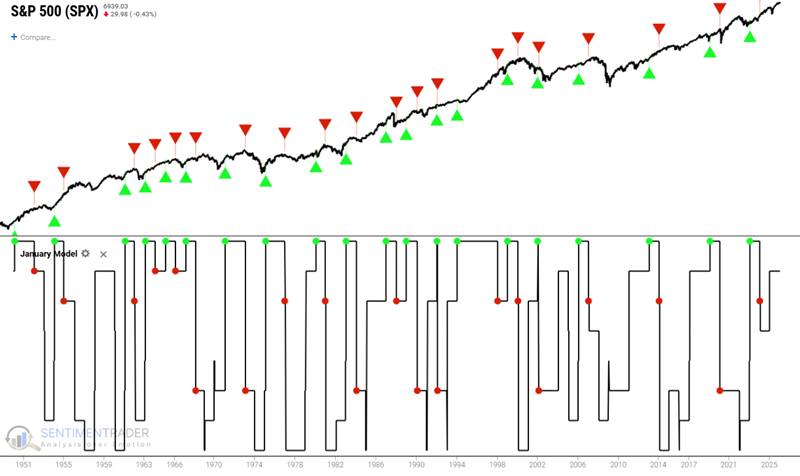
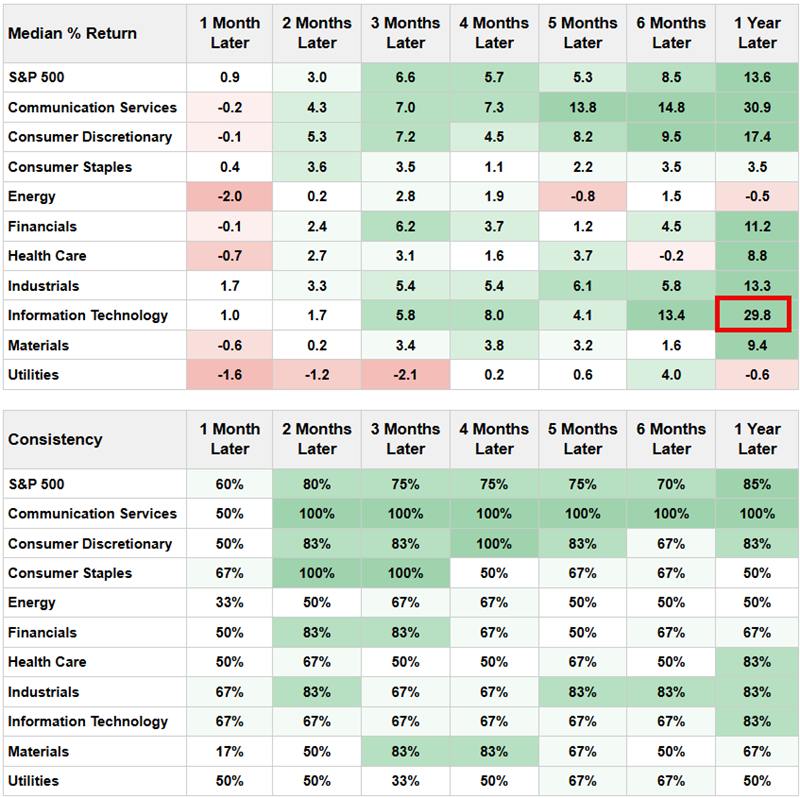
Historical performance during +7 periods shows:
- Win Rate: 85%
- Average Win to Average Loss ratio: 7.83-to-1 (23.5% to -3.0%)
The Technology sector shows outsized historical 1-year Median return of 29.8% during previous January Model = +7 periods.
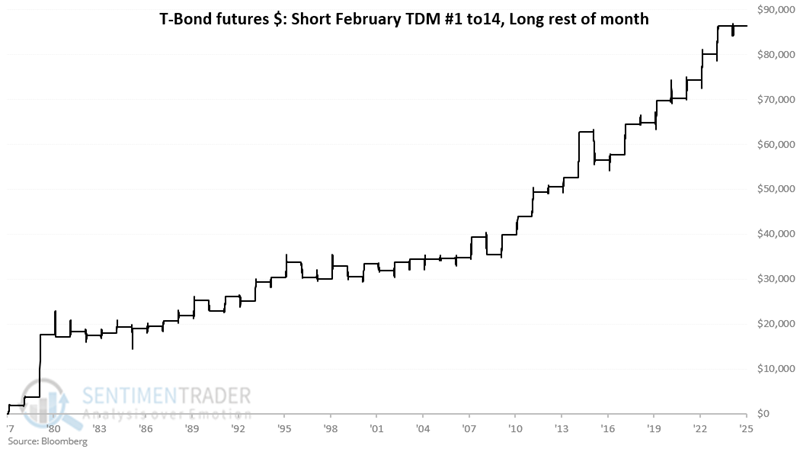
T-Bonds February "Jekyll and Hyde" personality
T-bonds exhibit a clear split personality in February:
- February trading days 1 through 14 = Negative performance
- February trading days 15+ = Positive performance
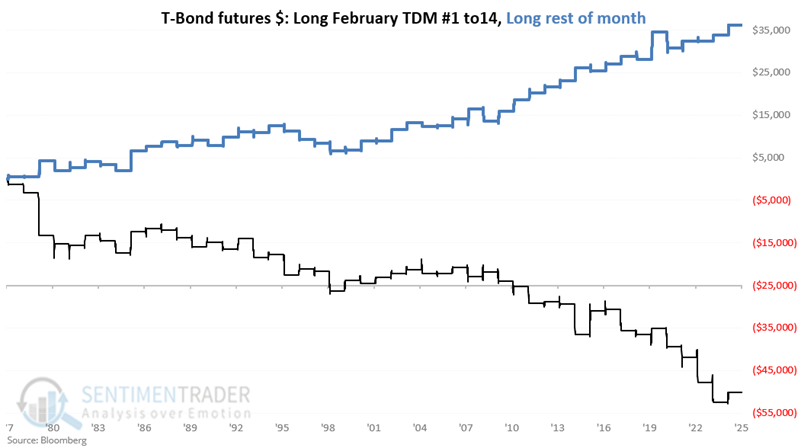
A strategy of being short T-bonds during the first 14 trading days and long thereafter shows compelling hypothetical results:
For 2026:
- Unfavorable period: February 2nd through February 20
- Favorable period: February 23rd through 27th
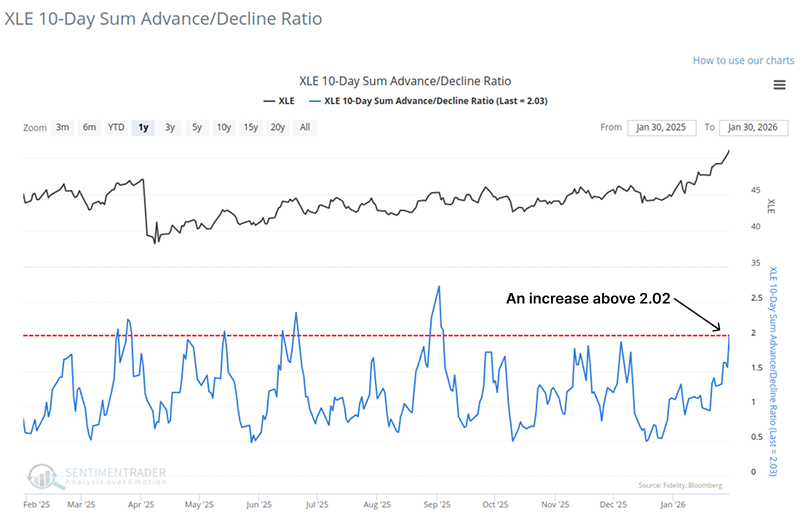
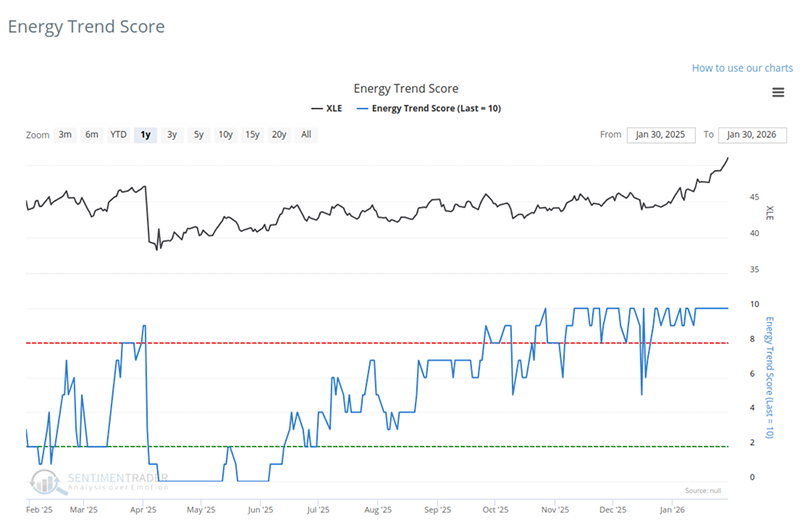
Energy sector triggers breadth thrust signal
The Energy (XLE) triggered a breadth thrust signal as its 10-day advance/decline ratio exceeded 2:1. However, similar thrusts occurring near 52-week highs have preceded weak returns, with the sector rising only 29% of the time over the next two months.
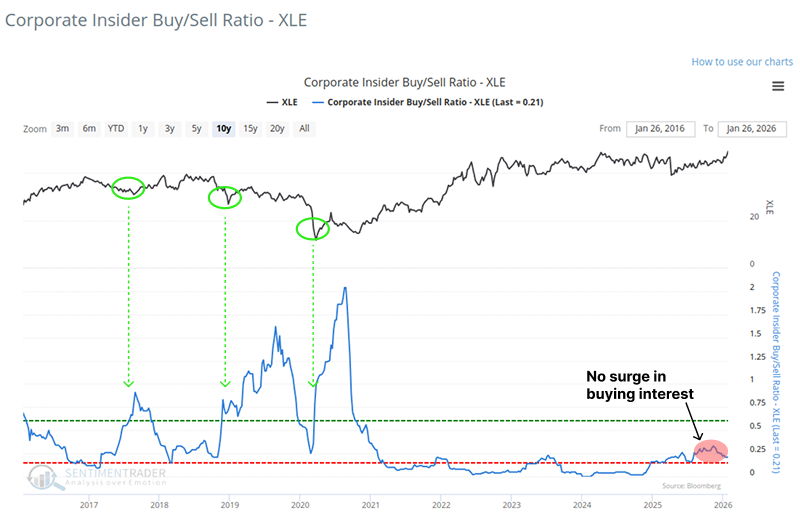
More concerning is that insiders at energy companies show minimal buying interest, with the buy/sell ratio at only half the level seen before major lows in XLE.
Positive notes include the cumulative advance/decline line for XLE components hitting an all-time high and trend scores improving.
Macro Index Model expands above 0.7
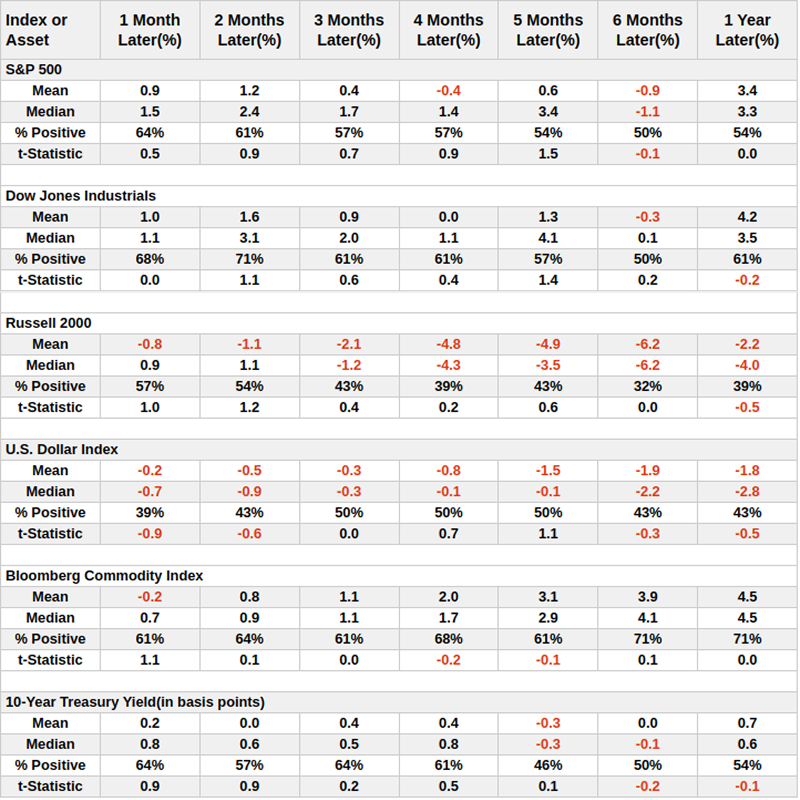
The Macro Index Model (MIM), aggregating 11 key economic indicators, crossed back above the 0.7 threshold. This suggests reduced recession probability (30%) and has historically been positive for equities.
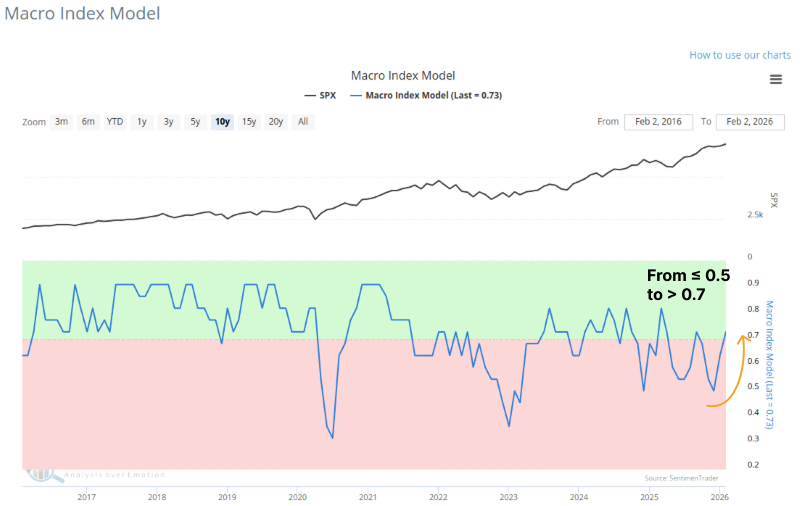
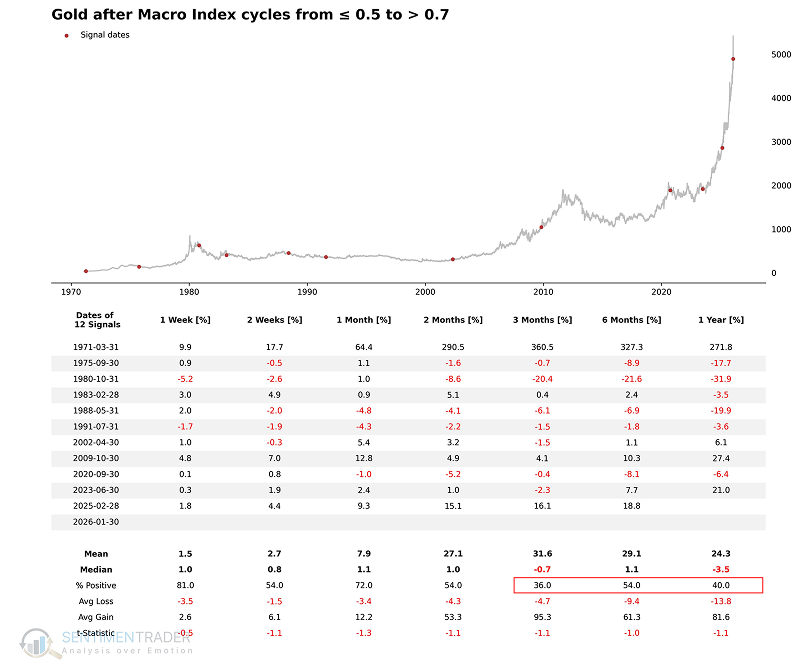
However, this same macro improvement has historically been a headwind for Gold and the US Dollar, though current geopolitical factors may decouple gold from traditional correlations.
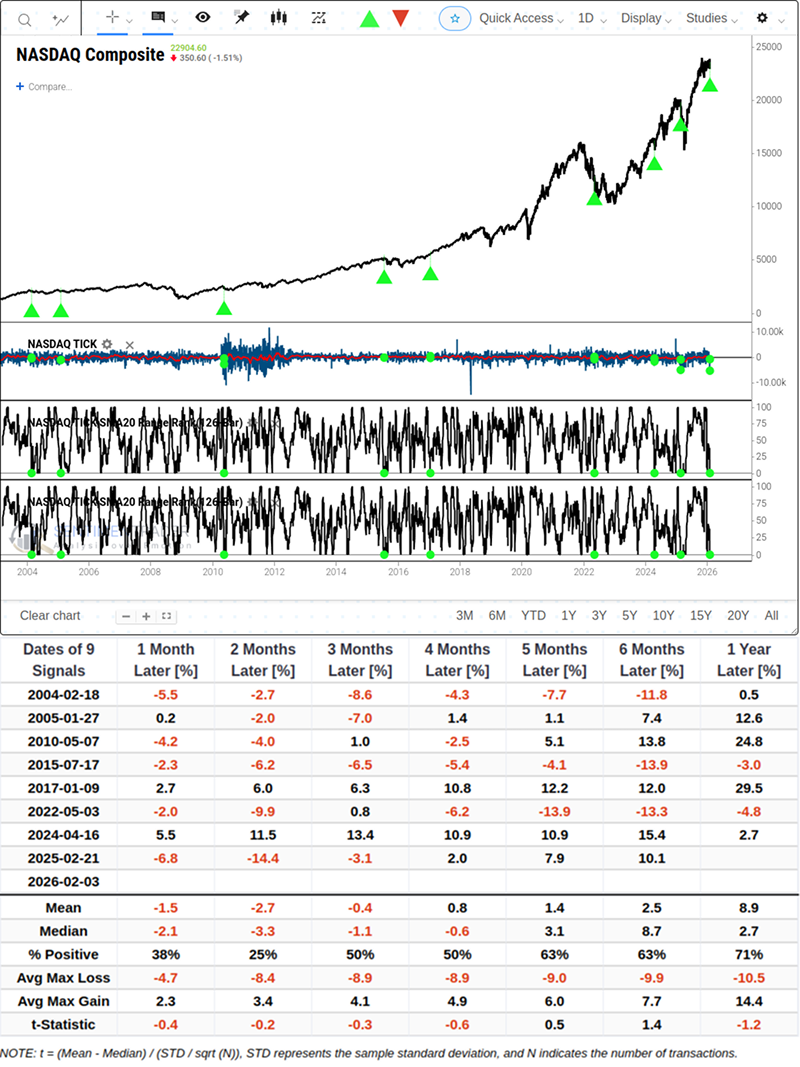
Multiple concerning Nasdaq breadth signals emerge
The Nasdaq Composite triggered the "Hindenburg Omen" 3 times in 4 trading days, a cluster that has historically preceded weak 3-6 month returns (only 39% positive probability at 6 months).
Additional concerning signals include:
- McClellan Summation Index below -500 (currently at -603)
- 20-day NASDAQ TICK indicator rank dropping from 100 to 0 in 42 days
- HiLo Logic Index breaking above 3
About TradingEdge Weekly...
The goal of TradingEdge Weekly is to summarize some of the research published to SentimenTrader over the past week. Sometimes there is a lot to digest, and this summary highlights the highest conviction or most compelling ideas we discussed. This is NOT the published research; rather, it pulls out some of the most relevant parts. It includes links to the published research for convenience, and if you don't subscribe to those products, it will present the options for access.