
TradingEdge Weekly for Feb 27 - European stocks surge, commodities resilience, cyclical sector participation, put/call indicators, weak dollar

Key points:
- European indices like FTSE 100 and CAC 40 hit record highs with bullish breadth and momentum indicators
- Bloomberg Commodity Spot Index shows extreme resilience, not hitting a 252-day low for nearly 750 days
- Declining participation in cyclical sectors (Consumer Discretionary, Financials, Technology) raises concerns
- Multiple put/call indicators flash favorable signs for stocks despite short-term skittishness
- U.S. dollar weakness coincides with commodity strength, a classic macroeconomic seesaw relationship
House view:
- Stocks:
- Short-term: Modestly bearish. VIX and CDX are still teetering on the boundary between risk-on and risk-off regimes. U.S. equities fell sharply amid a steep decline in Nvidia's share price. The S&P 500 Index (-0.54%) is testing key support levels at its 50-day moving average (6,899 points) and 200-day moving average (6,555 points). However, the market is showing healthy rotation signs-within the S&P 500, the number of advancing stocks actually outnumbered declining ones. This time frame covers 1-4 weeks.
- Intermediate-term: No view. Market momentum continues to weaken. The market remains in a tug-of-war between AI capex return concerns and resilient economic fundamentals. While the S&P 500 holds above key long-term support, upside is constrained by stretched valuations and profit-taking in mega-cap tech. This balance of headwinds and support creates no clear directional edge. This time frame covers 1-5 months.
- Long-term: Bullish. U.S. economic resilience persists relative to global peers. Long-term breadth indicators across sectors and global markets show no significant downside, typically signaling positive returns for most stock indices over the next 6 to 12 months. This time frame covers 6-12 months.
- AI application software (SaaS) and industrial sectors favor above-average returns
- Defensive sectors (utilities, staples) offer stability with high win rates
- Very long-term (one year+) favors rotation to equal-weight, small-caps, and healthcare
- Bonds: Long-term cycles remain bearish. The U.S. Treasury yield curve is steepening. Real rates remain restrictive, while rising policy uncertainty is driving up volatility across the broader fixed income market. We haven't seen much among analysts' studies to suggest a change in trend.
- Commodities: The prolonged bull market persists, with energy prices pausing briefly while precious metals extend their gains. WTI crude oil consolidates below the $67 resistance level, as the Middle East conflict premium weakens amid improved diplomatic prospects. An effective commodity trend model is currently bullish for precious metals. Gold holds steady above the $5,000 support level, buoyed by central bank purchases and geopolitical hedging demand, while silver follows gold's upward trajectory.
- Crypto: We follow several simple systems for U.S.-traded bitcoin, which we consider the equivalent of the S&P 500 for crypto. Amid the market's paradigm shift to real assets and fiat credit doubts, crypto assets face valuation revaluation pressure from tech stock sell-off contagion, but long-term fundamental support from tokenization remains. Market volatility rises with the overall financial market, and short-term price performance is dominated by risk appetite shifts, with structural opportunities tied to institutional adoption and underlying technology innovation.
- Triple 40: Bearish
- RSI Momentum: Bearish
- Trend and Relative Trend: Bearish
- PMI: Bullish
- M2 ROC: Bullish
- Notable Moves in Global Markets:
- Japan: The Nikkei 225 index briefly surged to a new high above 59,000 points before retreating. Policy board member Kazuhiko Takada hinted at further interest rate hikes, triggering a stronger yen and rising Japanese government bond yields. Optimism over artificial intelligence clashed with concerns over monetary tightening, causing sharp intraday market volatility.
- Hong Kong: Sentiment is pressured by U.S. tech weakness and trade policy uncertainty. Resource sectors show relative resilience amid rising global commodity prices.
Where we're at
Most investors have the most riding on equities. We feel that the most significant determinants of success for investors are whether to adjust their allocation to that asset class based on factors that have historically had a good record of preceding above- or below-random returns in the months ahead.
Those factors include the probability of a looming recession, sentiment, price action, volatility, breadth, and the bond market. The chart below summarizes the main indicators and composite models we watch for those factors, and they're mostly in bullish regimes. Valuations are not part of these factors since the relationship has been too inconsistent on time frames under one year.
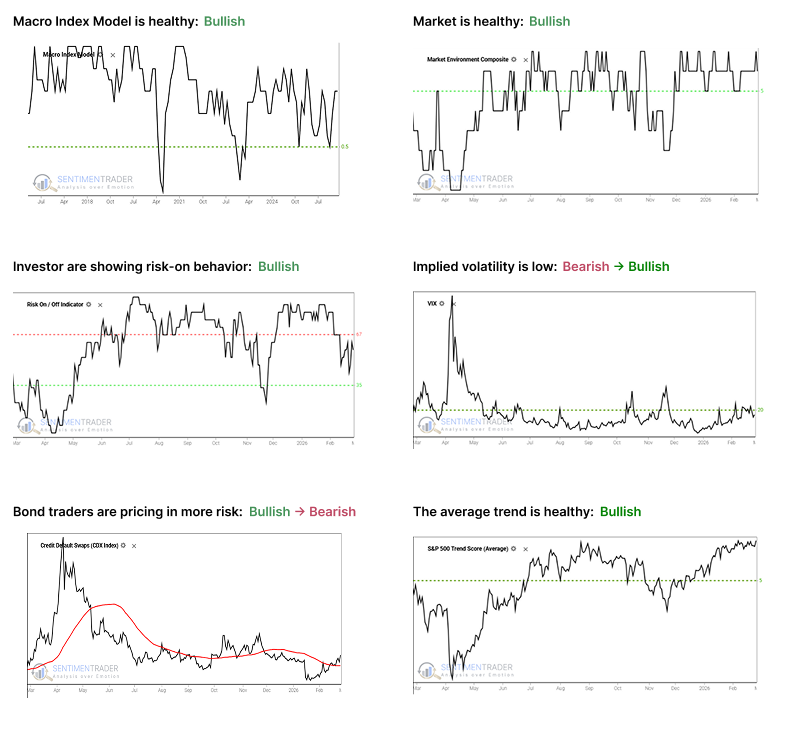
- The Macro Index Model is above the 50% threshold, which has been a vital level as outlined here.
- The Market Environment has been skittish, but is currently healthy. Future returns, especially for higher-beta indices, has been markedly better, with less risk, when the environment is healthy as outlined here.
- The Risk On / Off Indicator shows that investors are still in risk-on mode. This has been a good sign for future returns as outlined here.
- Implied volatility remains below 20, showing a calm environment. The S&P 500 has perfomed well when this is the case as outlined here.
- Credit default swap spreads are above their 50-day moving average, which is modestly concerning as outlined here.
- A composite of trend measures in SPY and the average S&P 500 stock remain above 5, which show healthy trend conditions.
European stocks surge into overbought territory
European stocks traded higher on Friday, bolstering investor confidence as both the London FTSE 100 and Paris CAC 40 indices hit record highs. The London market finished strongly, lifted by a dual tailwind of positive UK economic data and the U.S. Supreme Court's ruling striking down Trump's global tariff plan. The FTSE 100 ultimately closed up 59.85 points, or 0.6%, at 10,686.9.
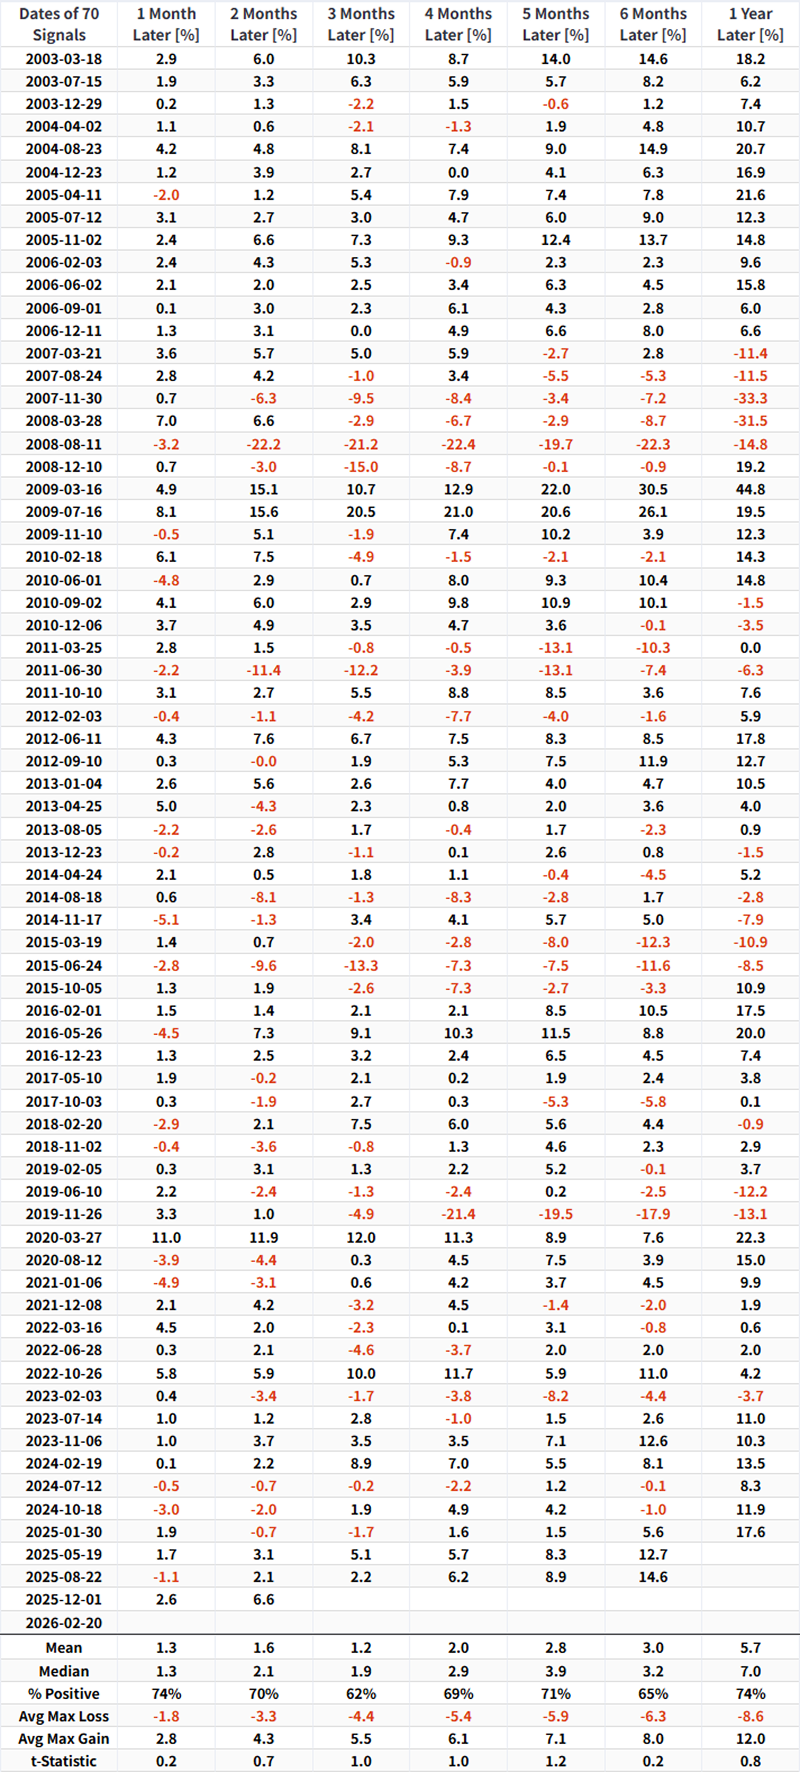
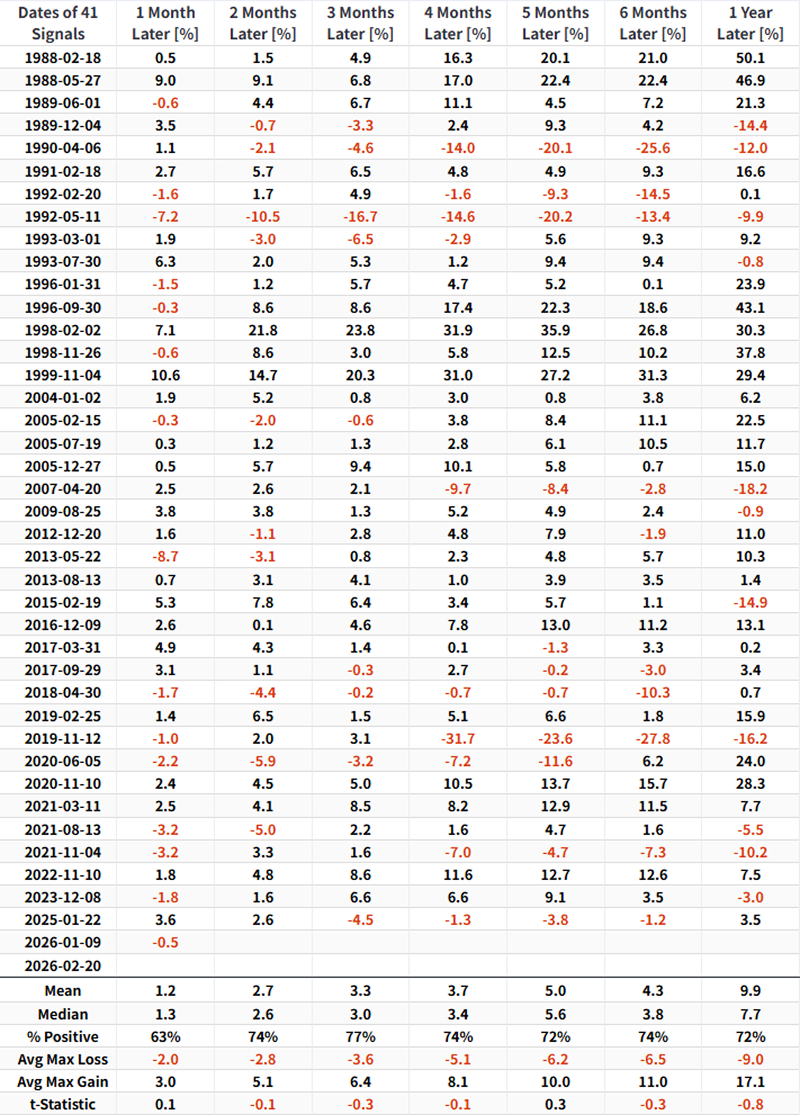
As the broader market moved higher, the market breadth indicator (FTSE Breadth % > 10 Day Avg) climbed sharply to 81, dragging its three-day moving average up to 77. The chart below displays the dates and subsequent performance when this 3-day moving average crosses above 77.
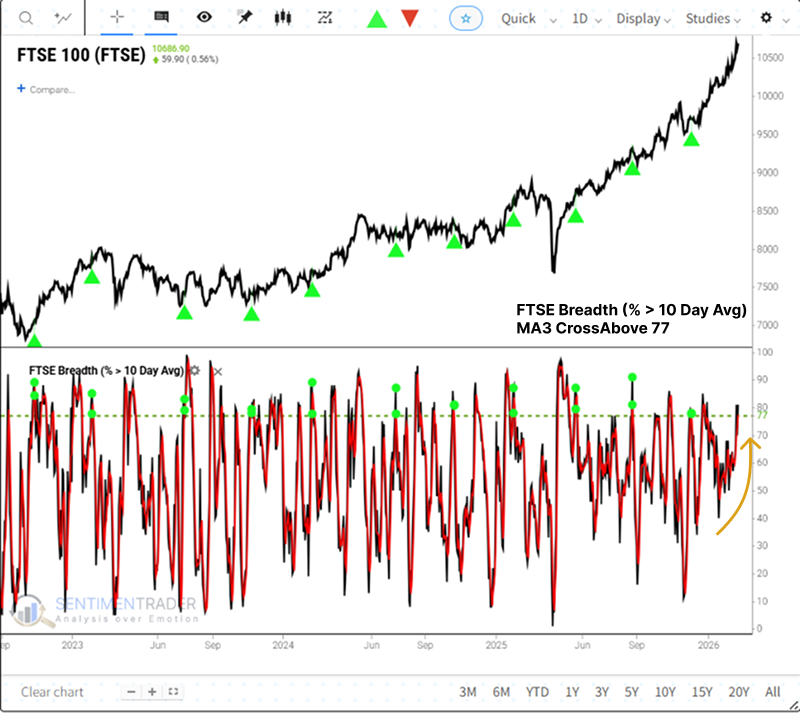
As the table shows, the FTSE 100 typically enjoys positive returns following this signal.
As the FTSE continues to trend higher, market breadth has expanded significantly across multiple timeframes. The percentage of component stocks trading above both their 50-day and 200-day moving averages has climbed, pushing firmly into overbought territory.
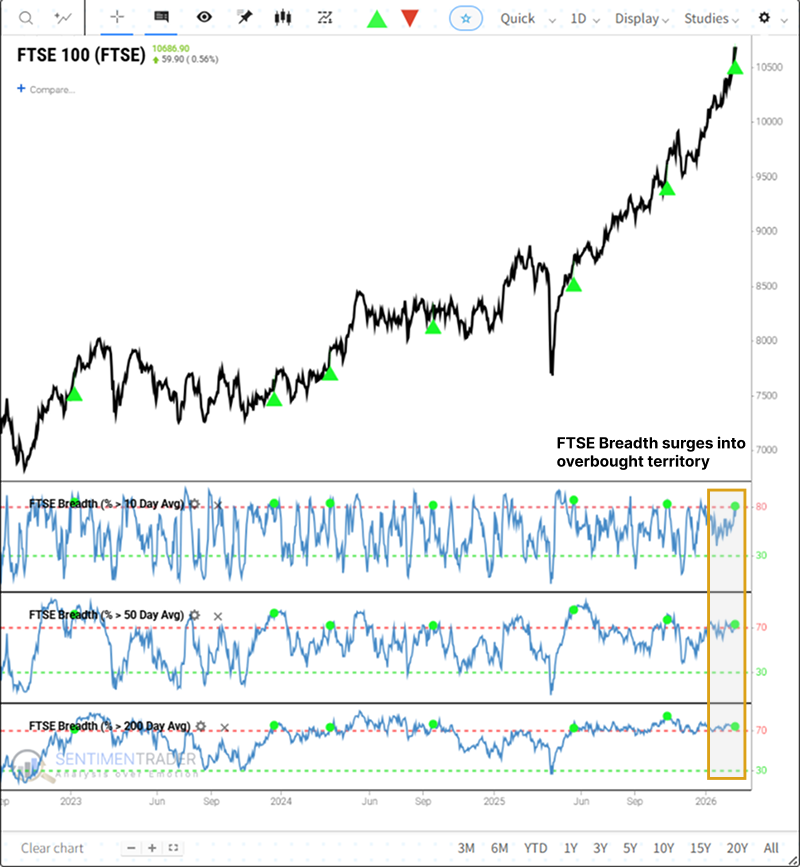
Meanwhile, the Paris CAC 40 Index closed up 1.4%, driving its own breadth indicators into overbought territory as well.
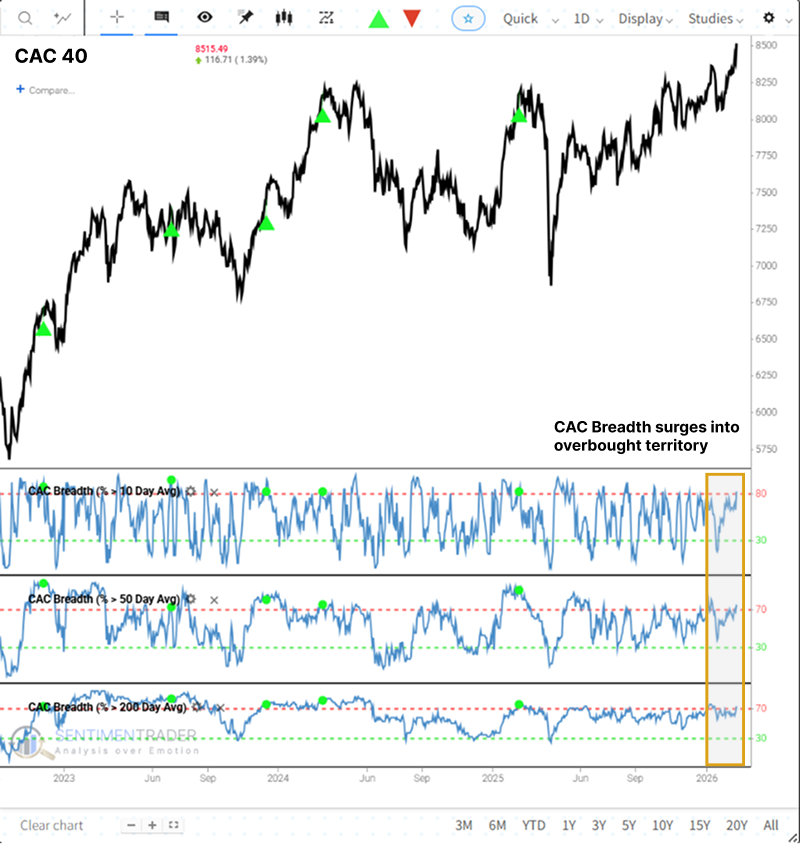
The CAC 40 RSI has broken above 72. A Relative Strength Index (RSI) reading above 72 is considered a strong signal of a bull market rather than a bear market. Strong positive momentum like this often leads to further upside across all timeframes.
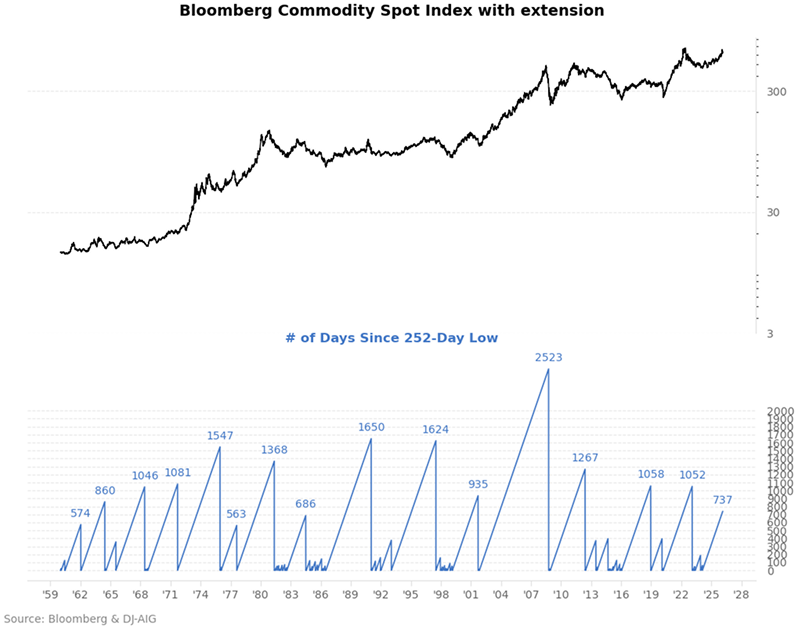
Performance of the Bloomberg Commodity Spot Index
The Bloomberg Commodity Spot Index has demonstrated exceptional price resilience over the past two years or so, consistently refusing to break down to the downside. The streak of not hitting a 1-year (252-day) low has stretched to nearly 750 days, triggering a rare cycle extreme signal on February 19, 2026.
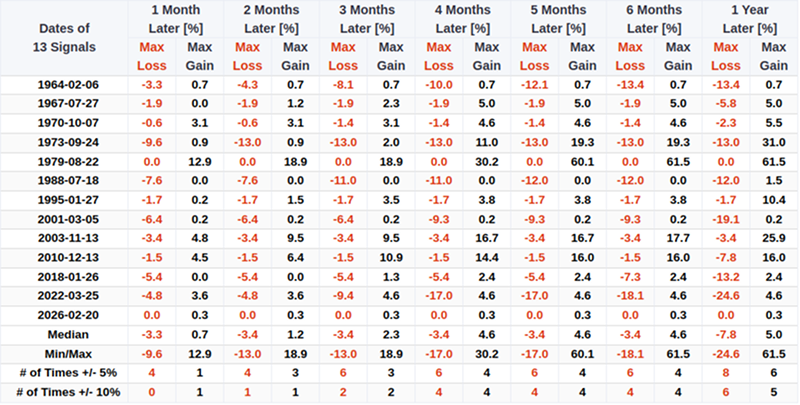
Since 1964, this criterion has been met only 13 times. In the 3 to 4-month window following signal triggers, the index exhibited trend persistence in both return rates and win rates: the probability of rising reached 67%, with the median return peaking at 2.6%.
The chart below shows the annual seasonal trend of the Bloomberg Commodity Spot Index.
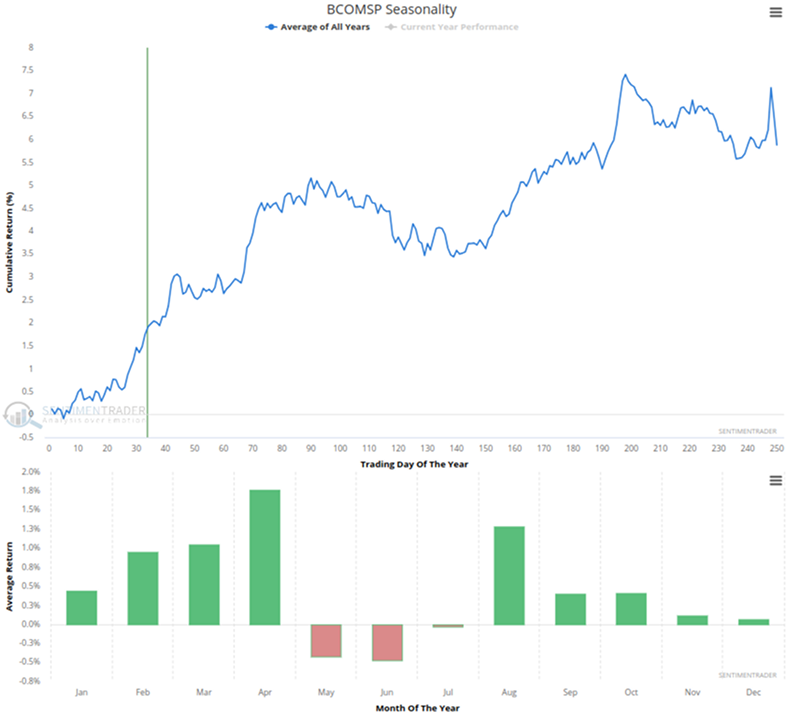
Combined with the current calendar period, commodities are currently in a historically favorable upward phase on average. Bar chart data shows that March and April are typically strong months with tailwinds, with April posting the highest historical average return at nearly 1.8%.
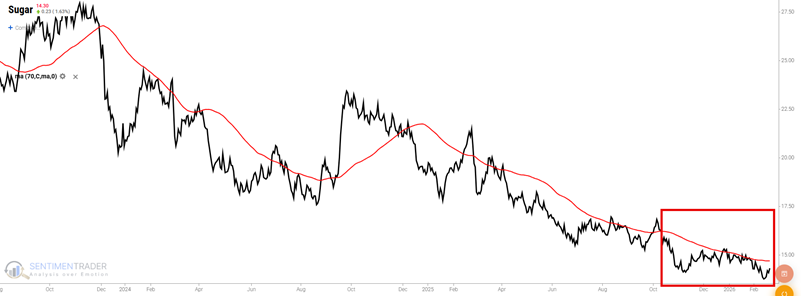
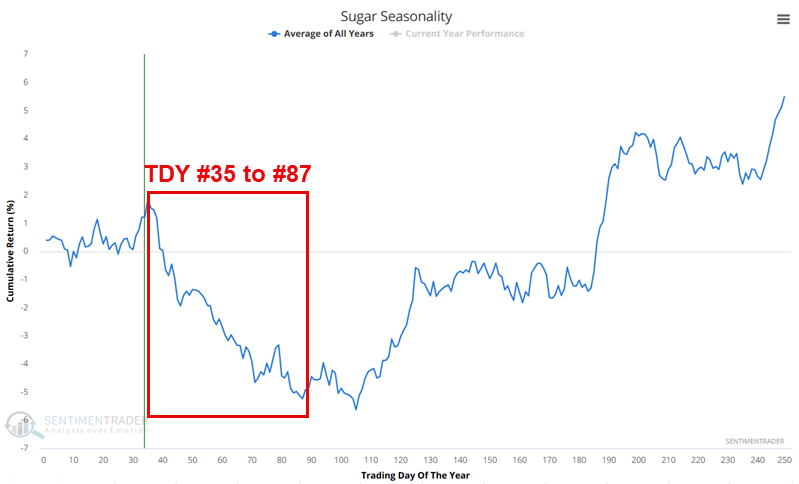
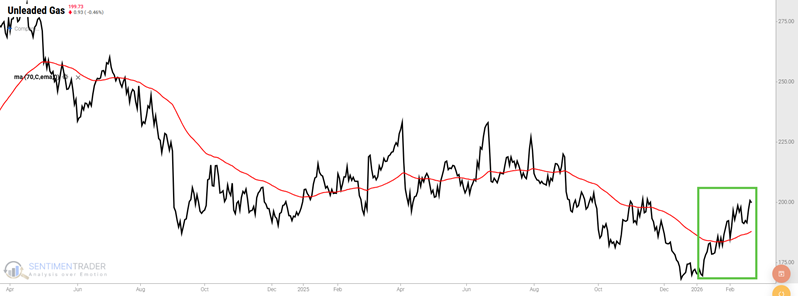
Significant Trends in Sugar and Unleaded Gas
Sugar futures have been in a relentless downtrend since November 2023. Meanwhile, Unleaded Gas futures have soared almost 35% since early January 2026.
Sugar has a long history of being a very cyclical market. The chart below shows the annual seasonal trend for sugar futures. As highlighted in red, this market is entering what is generally the weakest time of year.
While history has been unkind to sugar during the late winter, early spring period, Unleaded Gas futures have tended to experience just the opposite.
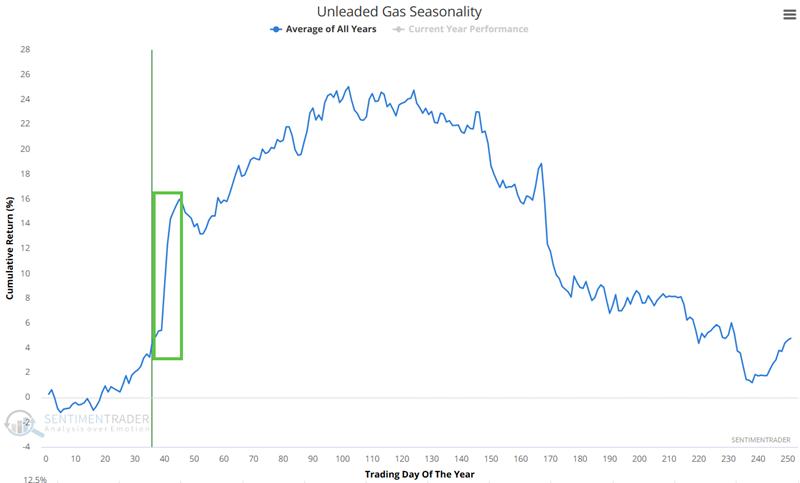
The seasonal information suggests that now is not the time to take a contrarian stance - nor even to let one's foot off the gas, so to speak.
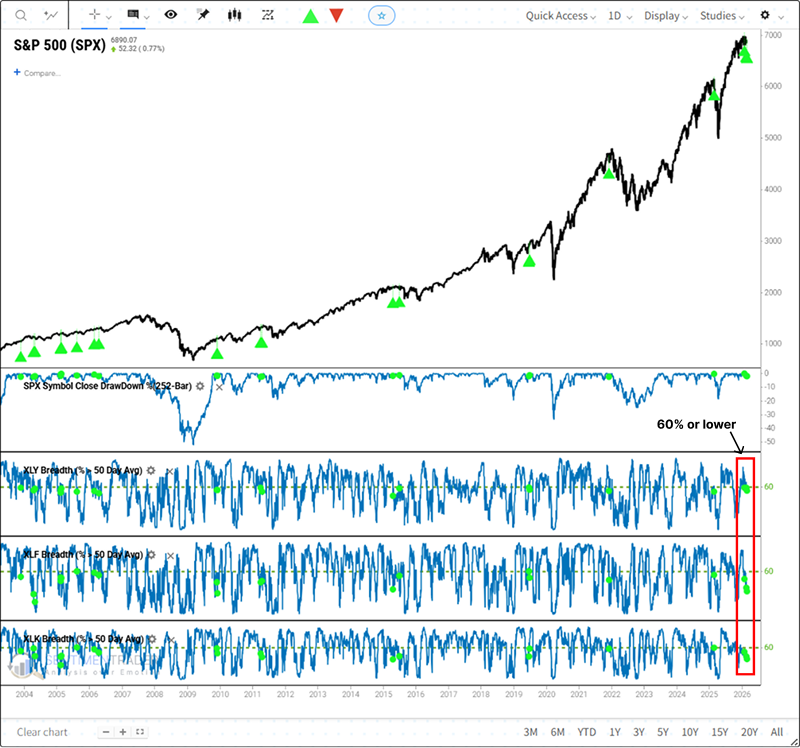
Declining participation in cyclical sector stocks
The S&P 500 Index has been trading in a range-bound, choppy manner for several months. On Monday, the proportion of stocks in the Consumer Discretionary, Financial, and Technology sectors closing above their 50-day moving averages fell below 60%, even as the world's most benchmarked index remained within 2.5% of its one-year high. This backdrop of narrowing market breadth, specifically migrating to these three crucial cyclical sectors, warrants careful attention. For related backtest, click here.
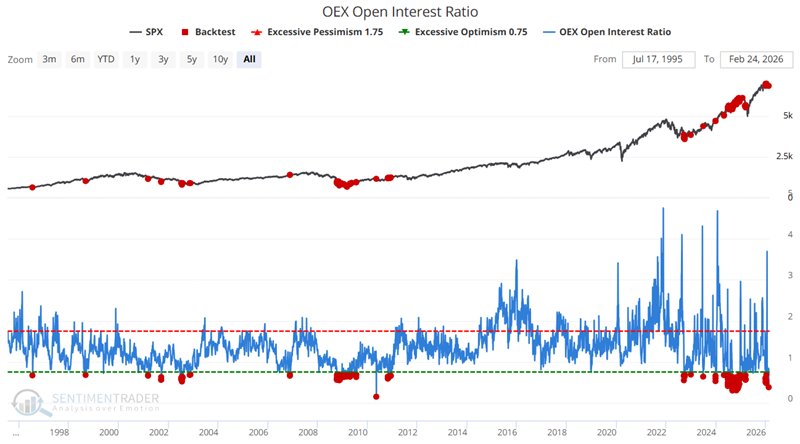
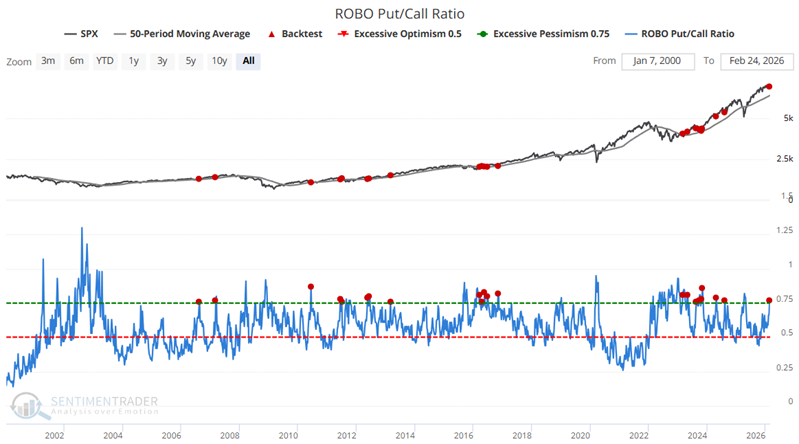
More Put/Call Indicators Flashing Favorable Signs
The chart below highlights all dates when the indicator was below 0.70. The most recent signals occurred on February 23rd and 24th.
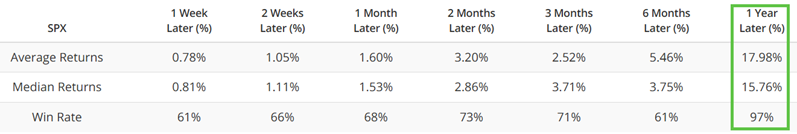
The table below summarizes subsequent S&P 500 results.
The chart below highlights the dates when the ROBO Put/Call Ratio exceeded 0.75 while the S&P 500 Index was above its 50-day moving average. The most recent signal occurred on February 20th.
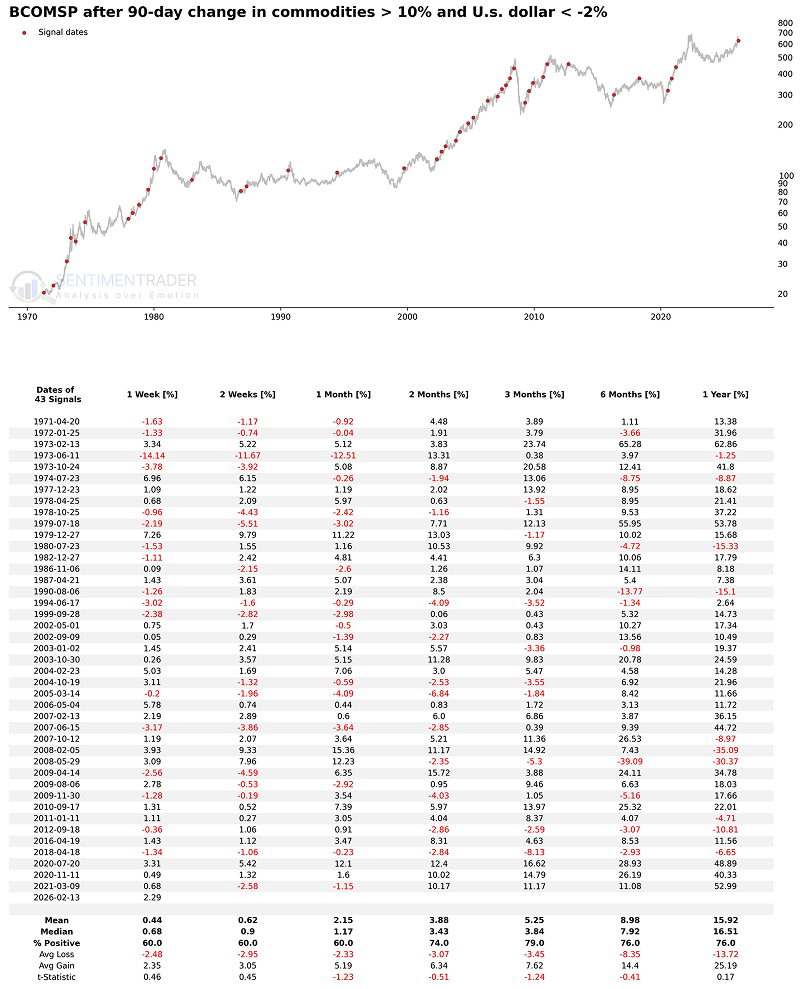
Weak Dollar, Strong Commodities
Among all the current macro market anomalies, one of the most striking phenomena is that as the U.S. dollar continues to weaken, commodity prices are experiencing an strong surge.
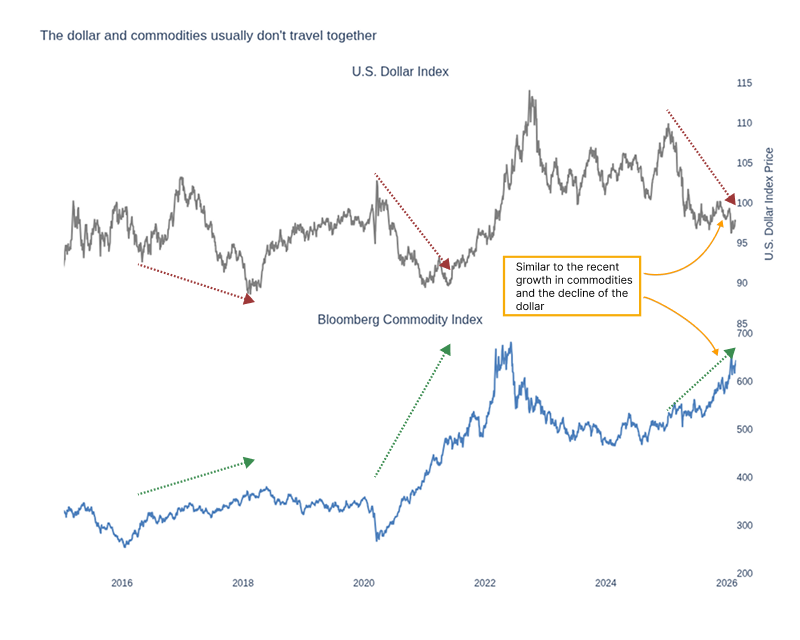
Dating back to 1971, instances where the U.S. Dollar Index fell by at least 2% while the Bloomberg Commodity Spot Index (BCOMSP) surged by at least 10% within a 90-day rolling period are rare. After applying a 60-trading-day cooling-off period for signal de-duplication, there have been only 43 independent macro trigger points in total.
For commodities, the situation is completely different. Once this momentum ignites, it typically embodies the principle of "the strong get stronger."
About TradingEdge Weekly...
The goal of TradingEdge Weekly is to summarize some of the research published to SentimenTrader over the past week. Sometimes there is a lot to digest, and this summary highlights the highest conviction or most compelling ideas we discussed. This is NOT the published research; rather, it pulls out some of the most relevant parts. It includes links to the published research for convenience, and if you don't subscribe to those products, it will present the options for access.