
TradingEdge Weekly for Feb 20 - Warning signs, Defensive sector crowding, Seasonal weakness, Homebuilders momentum, Mexican stock rally, Nasdaq sentiment

Key points:
- Market tops often involve deterioration under the surface - key indicators to watch
- Utilities sector showing extreme crowding with overbought conditions
- Late February to mid-March historically weak for multiple markets
- Homebuilders show strength while broader market consolidates
- Mexican market breadth signals bullish medium-term outlook
- Nasdaq sentiment indicators suggest bull market continuation
House view:
- Stocks:
- Short-term: Modestly bearish. VIX and CDX are still teetering on the boundary between risk-on and risk-off regimes. U.S. equities pull back after consecutive rebounds, with the S&P 500 capped by the 50-day moving average (6,895) and weak near-term momentum. Tech, discretionary, and financials lead downside as markets fully price out Fed rate cuts in spring, digesting the "higher for longer" rate narrative. This time frame covers 1-4 weeks.
- Intermediate-term: No view. Market momentum continues to weaken. The S&P 500 holds above the critical 200-day moving average (6523) with neutral RSI (46.44), but upside is constrained by AI capex return concerns and valuation pressure. Positive economic resilience hasn't translated to sustained upside, while geopolitical risks create offsetting support for defensive sectors. This tug-of-war between rate headwinds and fundamental resilience shows no clear edge. This time frame covers 1-5 months.
- Long-term: Bullish. The long-term uptrend for major U.S. indices remains intact, supported by underlying economic resilience and AI computing infrastructure spending. The S&P 500 and Dow maintain bullish structural positions, with volatility and short-term deleveraging viewed as corrective within the broader bull cycle. This time frame covers 6-12 months.
- Energy and defense sectors favor above-average returns
- Defensive sectors (utilities, staples) show high win rates but lower average returns
- Very long-term (one year+) favors rotation away from high-valuation AI application-layer stocks to value-oriented manufacturing and industrials
- Bonds: Long-term cycles remain bearish, but short-term safe-haven flows create counter-trend support. We haven't seen much among analysts' studies to suggest a change in trend. The U.S. Treasury yield curve is steepening. Historically, February-March has mixed seasonal performance for long-duration bonds (TLT), with headwinds from "higher for longer" Fed policy outweighing tactical safe-haven demand.
- Commodities: Signs point to a strengthening secular bull market driven by geopolitical "war premiums" and supply constraints. An effective commodity trend model is currently bullish, with energy and precious metals leading gains. Crude oil breaks above the 200-day moving average to a 6-month high on a 9.01 million barrel drop in U.S. inventories and U.S.-Iran tensions (Strait of Hormuz risk). Gold churns near its key $5,000 psychological level with extreme resilience post-liquidity flash crash, supported by central bank buying and geopolitical hedging demand. Silver remains volatile but follows gold's directional trend.
- Crypto: We follow several simple systems for U.S.-traded bitcoin, which we consider the equivalent of the S&P 500 for crypto. Amid the market's paradigm shift to real assets and fiat credit doubts, crypto assets face valuation revaluation pressure from tech stock sell-off contagion, but long-term fundamental support from tokenization remains. Market volatility rises with the overall financial market, and short-term price performance is dominated by risk appetite shifts, with structural opportunities tied to institutional adoption and underlying technology innovation.
- Triple 40: Bearish
- RSI Momentum: Bearish
- Trend and Relative Trend: Bearish
- PMI: Bullish
- M2 ROC: Bullish
- Notable Moves in Global Markets:
- Europe: The pan-European STOXX 600 index retreated 0.5% to 625.33 points on Thursday, pulling back sharply from a record close reached the previous day, as investors sifted through mixed earnings reports from major multinational giants. Earnings expectations have improved slightly this reporting season, but mixed results continue to create volatility.
- Japan: The Nikkei 225 index extended gains, closing at 57,467.83 points on Thursday, supported by a weaker yen, positive sentiment from overnight U.S. equity gains, and optimism around AI market expansion. On Friday, the index pulled back to 56,825.70.
Where we're at
Most investors have the most riding on equities. We feel that the most significant determinants of success for investors are whether to adjust their allocation to that asset class based on factors that have historically had a good record of preceding above- or below-random returns in the months ahead.
Those factors include the probability of a looming recession, sentiment, price action, volatility, breadth, and the bond market. The chart below summarizes the main indicators and composite models we watch for those factors, and they're mostly in bullish regimes. Valuations are not part of these factors since the relationship has been too inconsistent on time frames under one year.
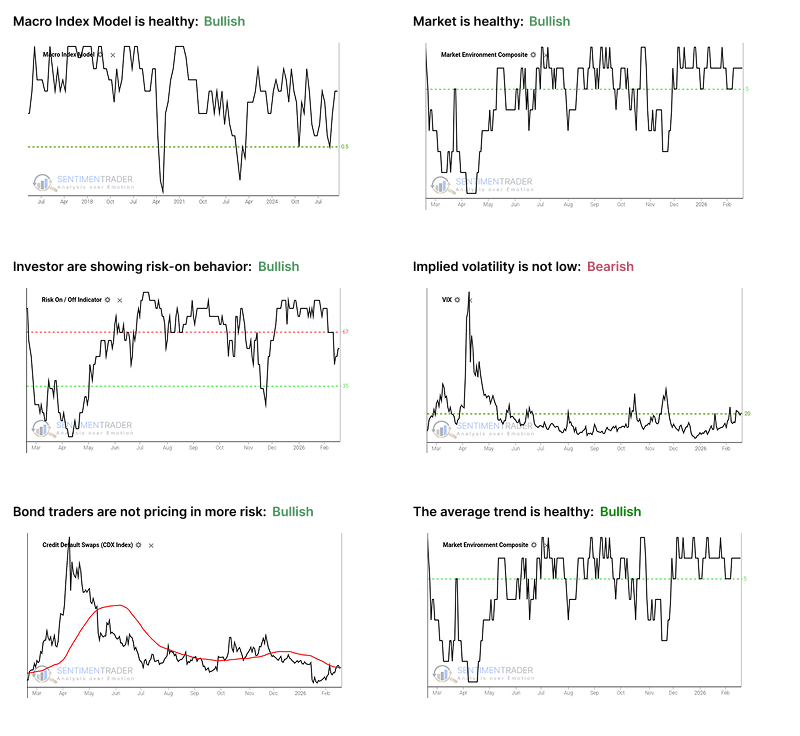
- The Macro Index Model is above the 50% threshold, which has been a vital level as outlined here.
- The Market Environment has been skittish, but is currently healthy. Future returns, especially for higher-beta indices, has been markedly better, with less risk, when the environment is healthy as outlined here.
- The Risk On / Off Indicator shows that investors are still in risk-on mode. This has been a good sign for future returns as outlined here.
- Implied volatility is at or above 20, signaling a volatile environment. The S&P 500 has historically performed poorly when this is the case, as outlined here.
- Credit default swap spreads are below their 50-day moving average, which drastically improves stock returns as outlined here.
- A composite of trend measures in SPY and the average S&P 500 stock remain above 5, which show healthy trend conditions.
Warning signs as market nears potential top
The price charts below for the S&P 500 Index, Nasdaq 100 Index, Dow Jones Industrial Average, and Russell 2000 show each index near all-time highs and still well above its respective 200-day moving average.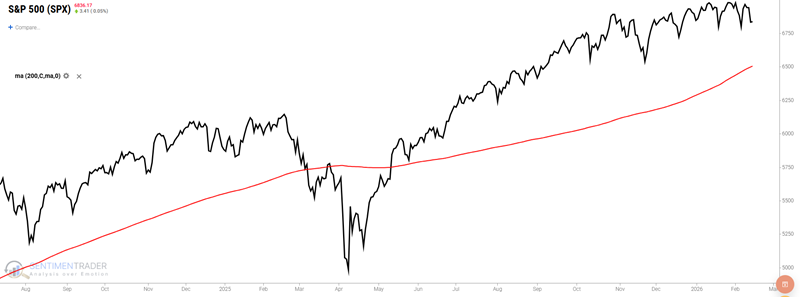
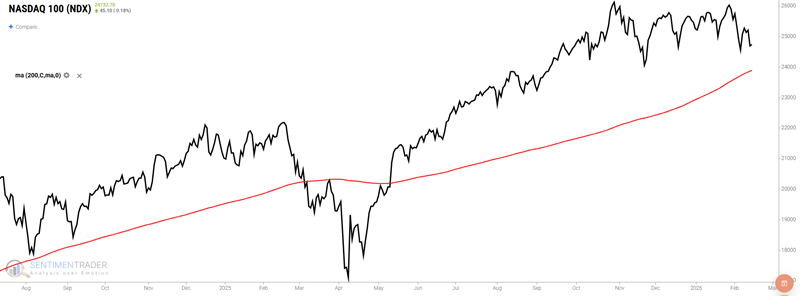
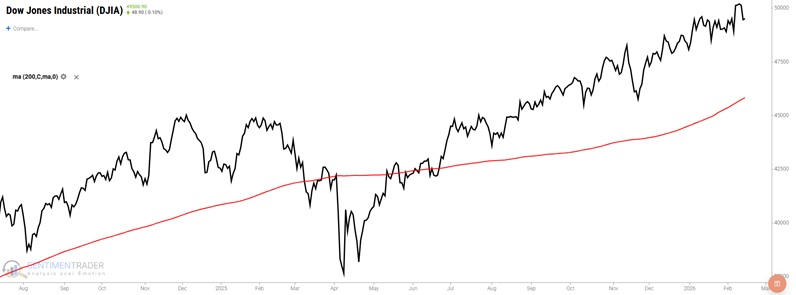
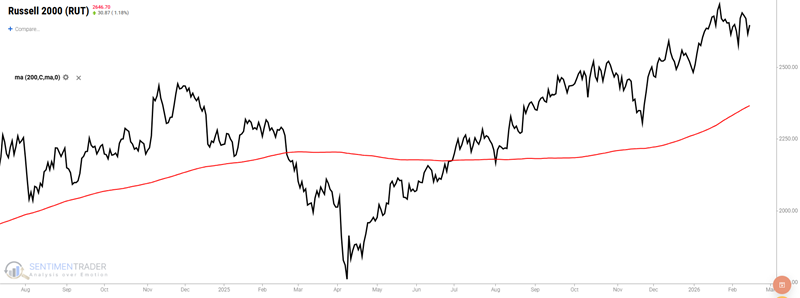
Historically, market tops typically - though importantly, not always - take some time to play out. Often, the major indexes continue higher or, at worst, trade sideways, while many stocks top out and start to head lower. In essence, the "Generals continue to lead, but fewer soldiers follow."
Nasdaq HiLo Logic Index shows warning
The chart below highlights all dates when the 10-day average of the Nasdaq HiLo Logic Index crossed above 3.00. The most recent signal occurred on February 2nd.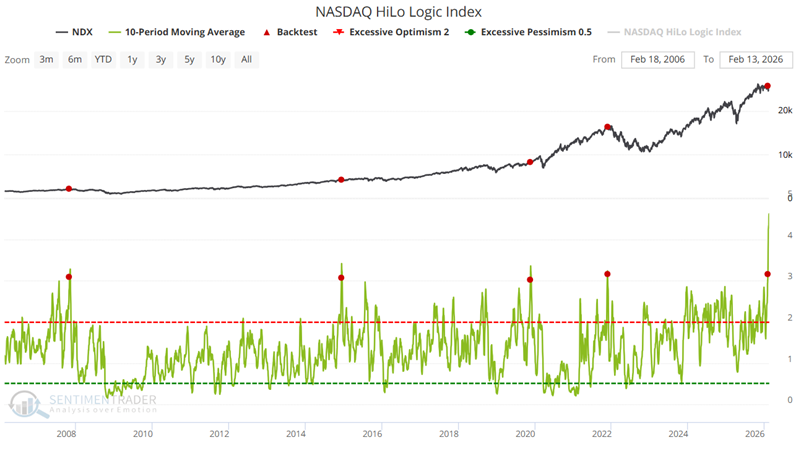
The table below summarizes subsequent Nasdaq 100 Index performance.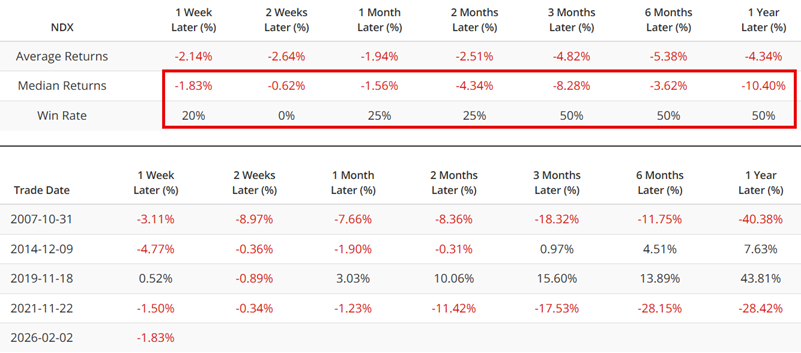
Extreme crowding in defensive sectors
The XLU sector is experiencing an extreme buying frenzy internally. The most striking data point is that as much as 87.1% of its constituent stocks are trading above the upper Bollinger Band (Above BB). Meanwhile, 77.42% of stocks in the sector have a Relative Strength Index (RSI) above 70, and 90.32% of constituents are trading above their 200-day moving average.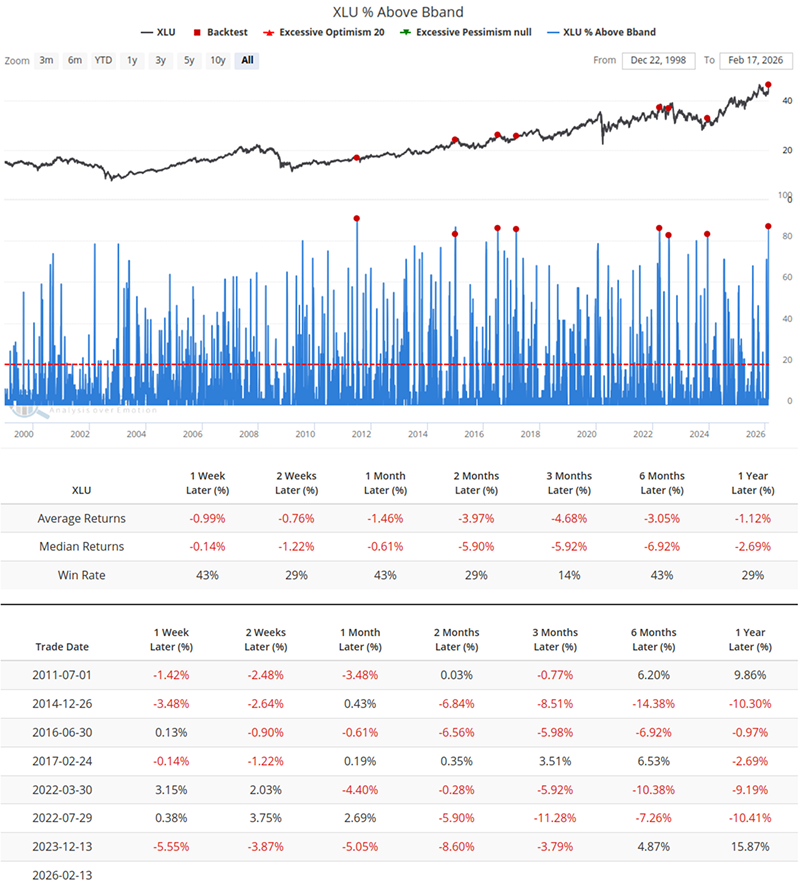
Within the 3-month window following signal triggers, XLU posted a win rate of only 14%. Even in the subsequent 1-week and 2-week periods, the average returns were negative.
Seasonal weakness ahead for multiple markets
The late February to mid-to-late March period has a history of market weakness. For the S&P 500 (SPY), an unfavorable period extends from February 18th through March 12th.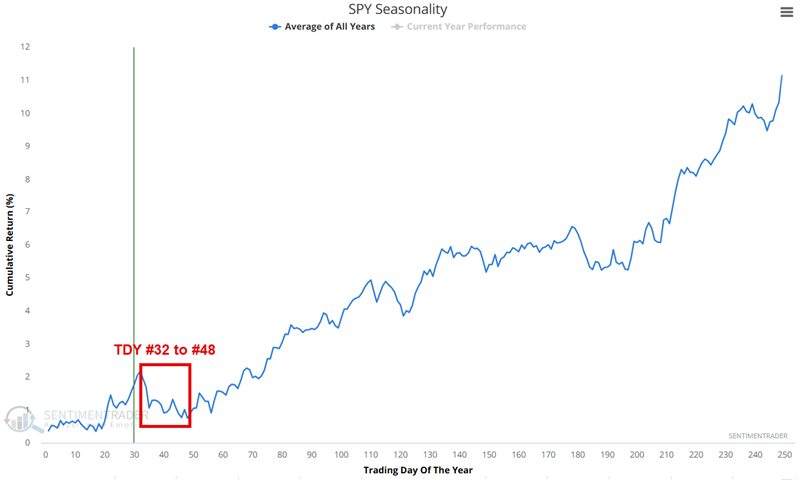
The chart below displays the hypothetical growth of $1 invested in SPY only during this period since 1994. The cumulative loss equals -35%.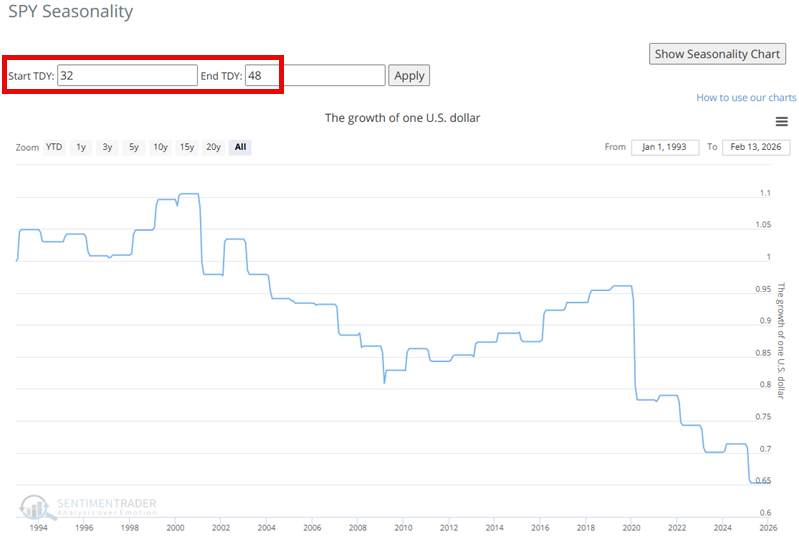
Homebuilders show strength
Directly buoyed by last week's moderate CPI data (cooling inflation), the iShares U.S. Homebuilders ETF (ITB) closed above its 20-week high on Friday, resonating with the S&P 500 Index hovering near its 52-week peak.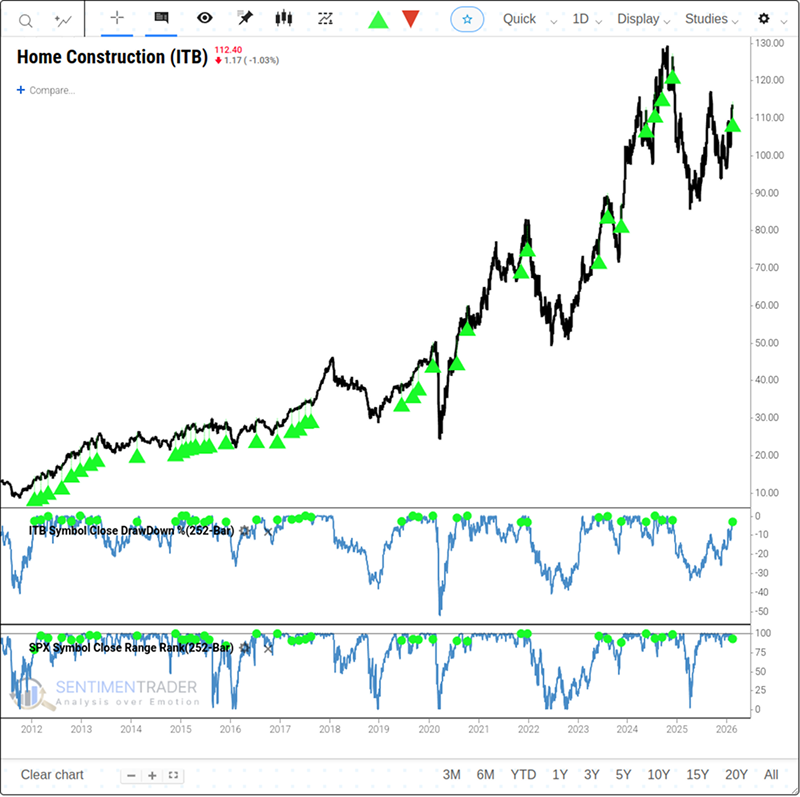
When we filter out duplicate signals by requiring the S&P 500's range rank to drop below 50% before a new alert can trigger, the signal's performance improves further.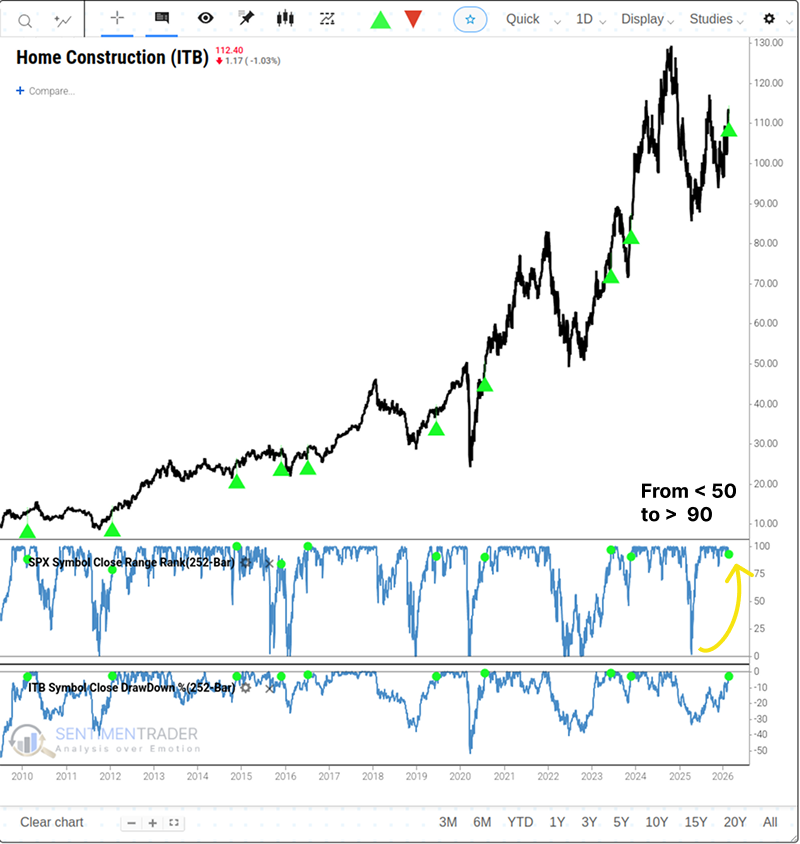
Although the sample size is small, the signal boasts an 89% win rate over the one-year timeframe.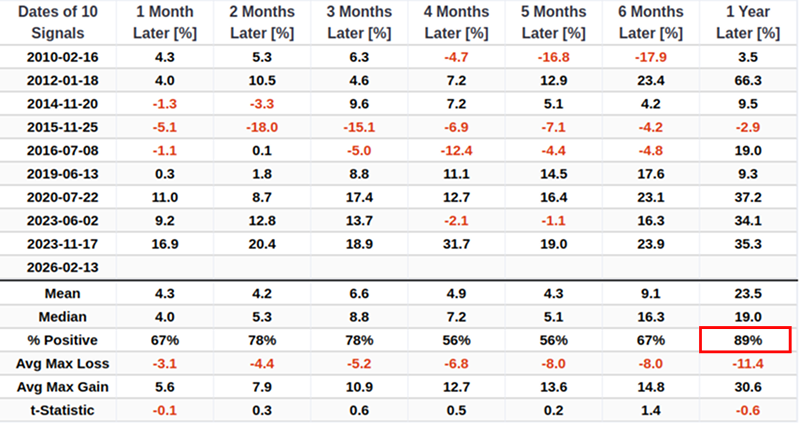
Mexican market breadth signals rally
The proportion of stocks in the MEXBOL Index trading above their 50-day moving average has surged from below 30% to above 90%, reaching a new extreme level.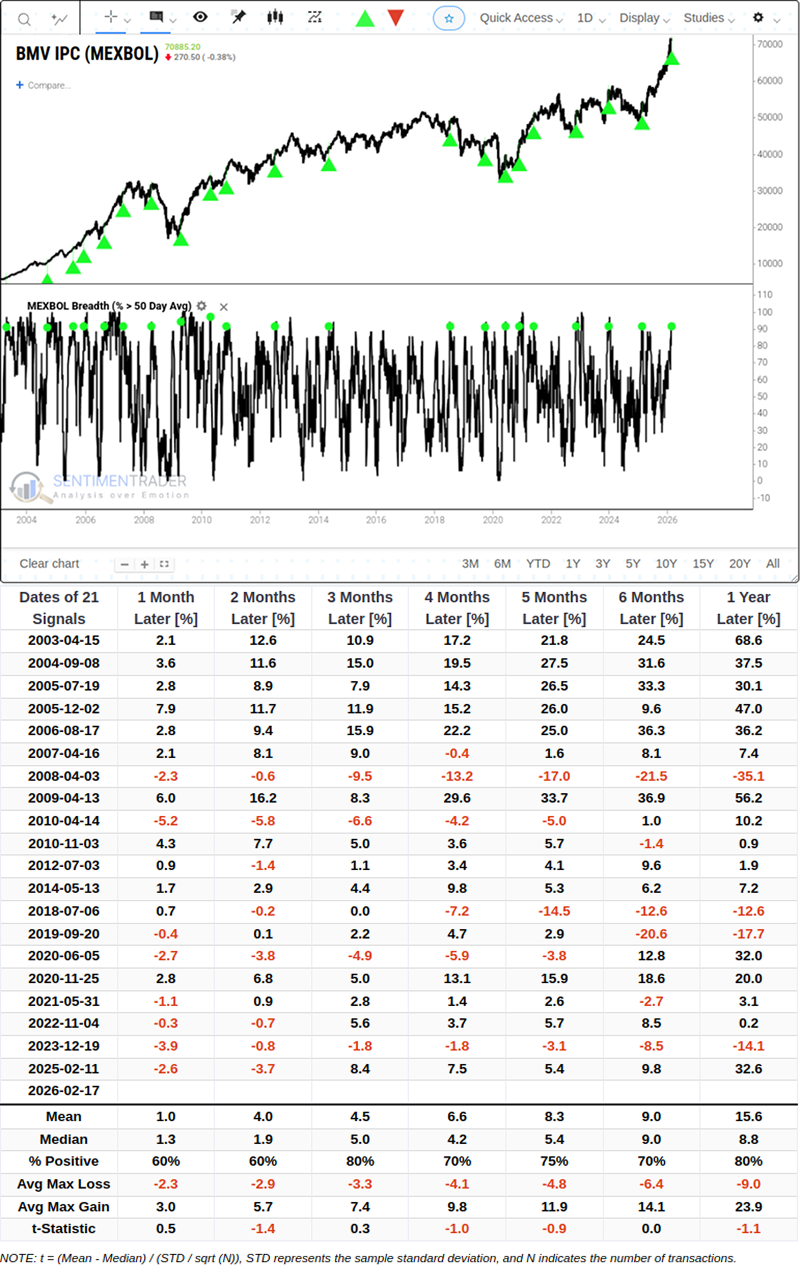
Optimization tests identified the optimal holding period for the Mexican Currency Index (MEXBOL Index) as 59 days. Under this condition, 16 out of 20 tests resulted in profits, representing a 76% win rate.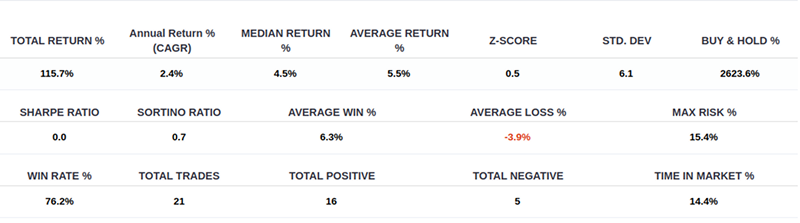
Nasdaq signals suggest bull market continuation
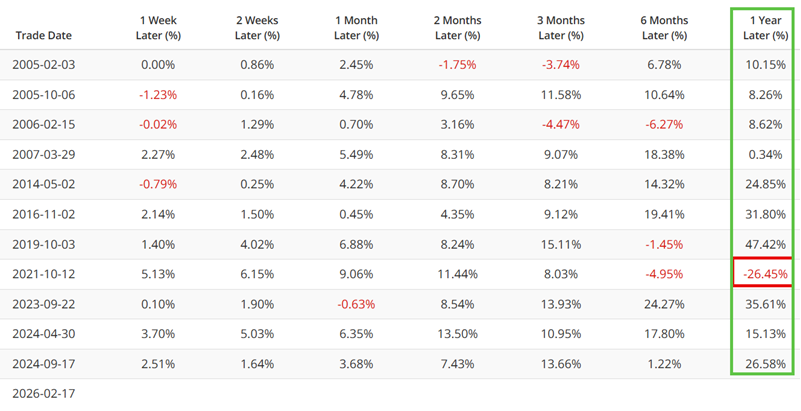
The chart below highlights those dates when the 50-day average of our QQQ Optix indicator crossed below 45. The most recent signal occurred on February 17th.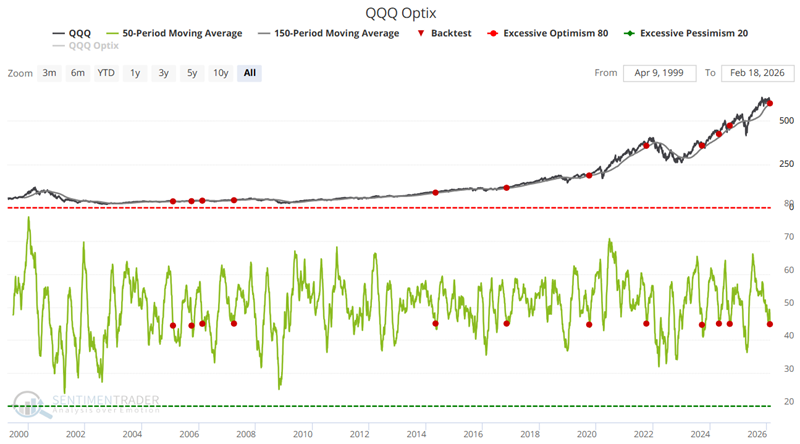
The tables below summarize subsequent QQQ performance and results on a signal-by-signal basis.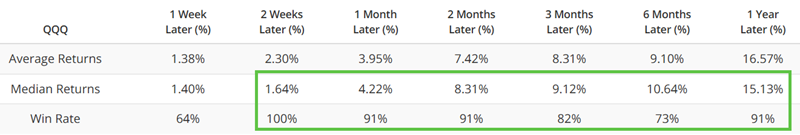
About TradingEdge Weekly...
The goal of TradingEdge Weekly is to summarize some of the research published to SentimenTrader over the past week. Sometimes there is a lot to digest, and this summary highlights the highest conviction or most compelling ideas we discussed. This is NOT the published research; rather, it pulls out some of the most relevant parts. It includes links to the published research for convenience, and if you don't subscribe to those products, it will present the options for access.