
TradingEdge Weekly for Feb 13- Gold VIX spike, bond market calm, risk-off transition, insider activity, energy momentum, regional banks seasonality

Key points:
- Rare Gold VIX signal suggests potential volatility in metals and commodities
- Credit default swaps indicate a calm bond market supporting equities
- Risk-On/Off indicator transitions from elevated levels, suggesting increased volatility
- Corporate insider activity shows bullish sentiment across key sectors
- Energy sector shows strong momentum but overheated sentiment
- Regional banks face seasonal headwinds despite recent strength
House view:
- Stocks:
- Short-term: Bearish. VIX and CDX are still teetering on the boundary between risk-on and risk-off regimes. The S&P 500 closed below the 50-day moving average (around 6,894), signaling a weakening of short-term momentum. Risk-off fully triggers as hot January NFP (130k vs 53k expected) dismantles rapid Fed easing bets, forcing markets to price "higher for longer" rates. This time frame covers 1-4 weeks.
- Intermediate-term: No view. Market momentum continues to weaken. Sector divergence reaches extreme levels: capital flees crowded growth & AI themes, rotating heavily into defensive value & geopolitical hedge sectors. Fed policy uncertainty and incoming inflation data keep volatility elevated. This time frame covers 1-5 months.
- Long-term: Bullish. U.S. economic resilience persists relative to global peers. Long-term breadth indicators across sectors and global markets show no significant downside, typically signaling positive returns for most stock indices over the next 6 to 12 months. This time frame covers 6-12 months.
- Overweight: Energy, utilities, consumer staples, high-quality defensives.
- Underweight: High-Capex tech, software/SaaS, unprofitable growth, rate-sensitive cyclicals.
- Opportunities: European industrials & luxury, U.S. defense & resource-related sectors.
- Bonds: Long-term cycles remain bearish. The U.S. Treasury yield curve is steepening. Real rates remain restrictive, while rising policy uncertainty is driving up volatility across the broader fixed income market. We haven't seen much among analysts' studies to suggest a change in trend.
- Commodities: Severe liquidity flash crash hits precious metals in a "sell-everything" deleveraging wave, breaking classic safe-haven correlations. Gold collapses through the $5,000 psychological support. An effective commodity trend model is currently bullish for precious metals, short-term price pullbacks present attractive incremental buying opportunities. Silver plunges nearly 10% in forced liquidation, with the gold-silver ratio spiking to 65:1. WTI crude falls sharply despite Middle East tensions, overwhelmed by IEA supply-surplus warnings and rate-hike repricing. The complex is technically damaged with fundamentals temporarily overridden by liquidity stress.
- Crypto: We follow several simple systems for U.S.-traded bitcoin, which we consider the equivalent of the S&P 500 for crypto. Amid the market's paradigm shift to real assets and fiat credit doubts, crypto assets face valuation revaluation pressure from tech stock sell-off contagion, but long-term fundamental support from tokenization remains. Market volatility rises with the overall financial market, and short-term price performance is dominated by risk appetite shifts, with structural opportunities tied to institutional adoption and underlying technology innovation.
- Triple 40: Bearish
- RSI Momentum: Bearish
- Trend and Relative Trend: Bearish
- PMI: Bullish
- M2 ROC: Bullish
- Notable Moves in Global Markets:
- Europe: Sharp divergence from U.S. pain - major indices hit all-time highs, led by luxury strength (Hermès, LVMH), industrial outperformance (Siemens), and M&A optimism (Schroders). European value, quality, and less AI-Capex sensitivity drive relative outperformance.
Where we're at
Most investors have the most riding on equities. We feel that the most significant determinants of success for investors are whether to adjust their allocation to that asset class based on factors that have historically had a good record of preceding above- or below-random returns in the months ahead.
Those factors include the probability of a looming recession, sentiment, price action, volatility, breadth, and the bond market. The chart below summarizes the main indicators and composite models we watch for those factors, and they're mostly in bullish regimes. Valuations are not part of these factors since the relationship has been too inconsistent on time frames under one year.
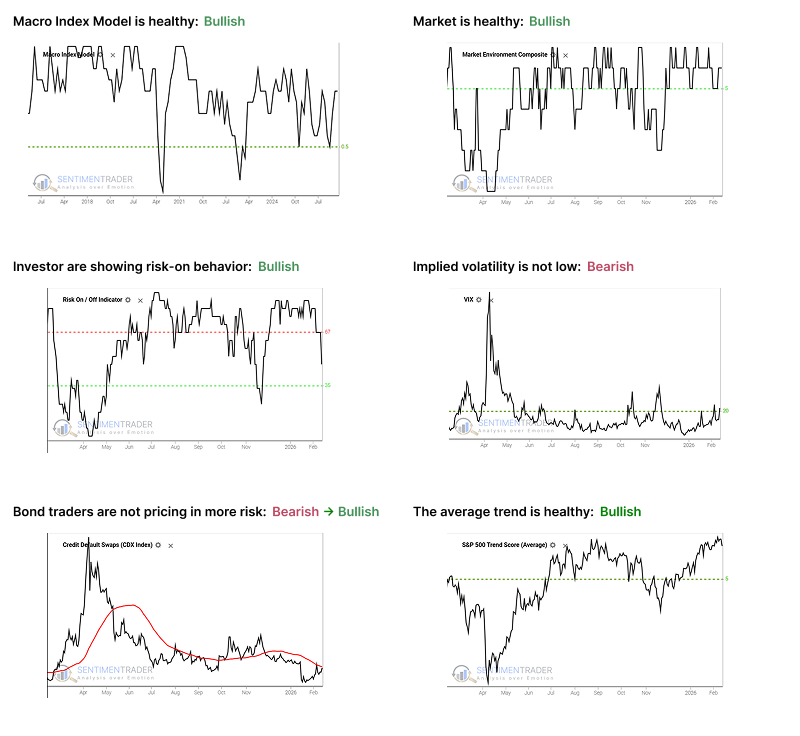
- The Macro Index Model is above the 50% threshold, which has been a vital level as outlined here.
- The Market Environment has been skittish, but is currently healthy. Future returns, especially for higher-beta indices, has been markedly better, with less risk, when the environment is healthy as outlined here.
- The Risk On / Off Indicator shows that investors are still in risk-on mode. This has been a good sign for future returns as outlined here.
- Implied volatility is at or above 20, signaling a volatile environment. The S&P 500 has historically performed poorly when this is the case, as outlined here.
- Credit default swap spreads are below their 50-day moving average, which drastically improves stock returns as outlined here.
- A composite of trend measures in SPY and the average S&P 500 stock remain above 5, which show healthy trend conditions.
A spike and reversal in Gold VIX
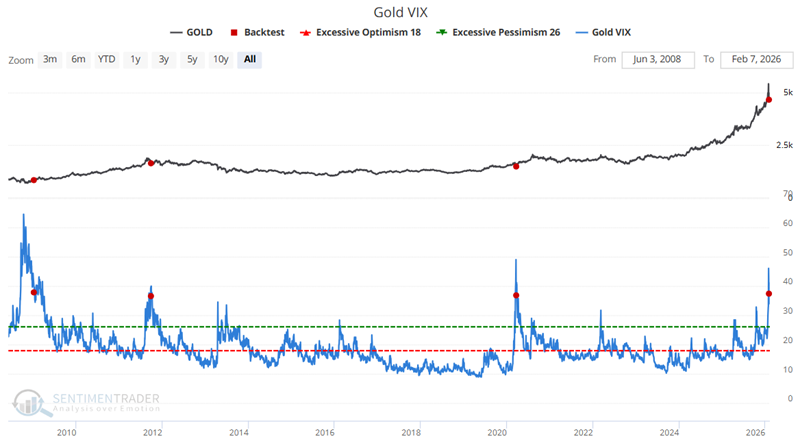
Similar to the VIX Index, which most people are familiar with and tracks traders' expectations of future volatility in the stock market based on option pricing models, our Gold VIX indicator tracks volatility expectations using options on the SPDR Gold Trust ETF (GLD).
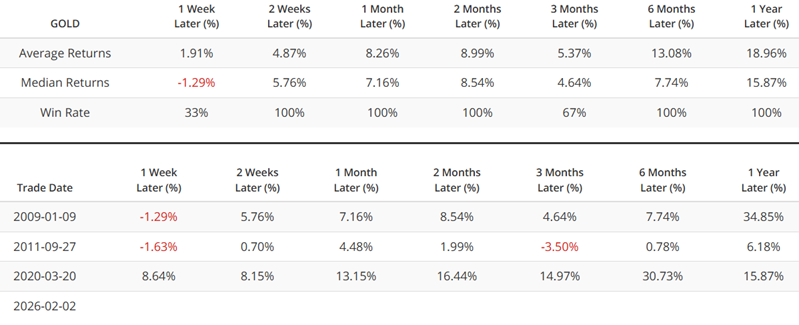
As we discussed in this recent note, the Gold VIX indicator spiked to an extremely high level. The VIX Index crossed above 38 on January 29th and dropped back below 38 on February 2nd.
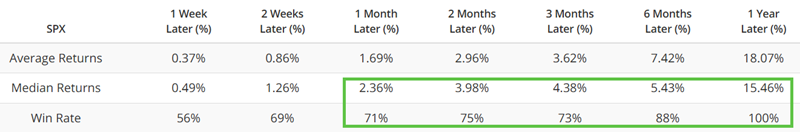
This type of reversal has occurred only three previous times since 2009. So the massive caveat to everything that follows is that small sample sizes can always be called into question and should not be trusted implicitly as a precise indication of what will happen in the future. However, the results following the three previous signals are compelling enough across enough markets to warrant a mention. Just remember that everything presented below is 'Food for thought' and not 'A table-pounding call to action.'
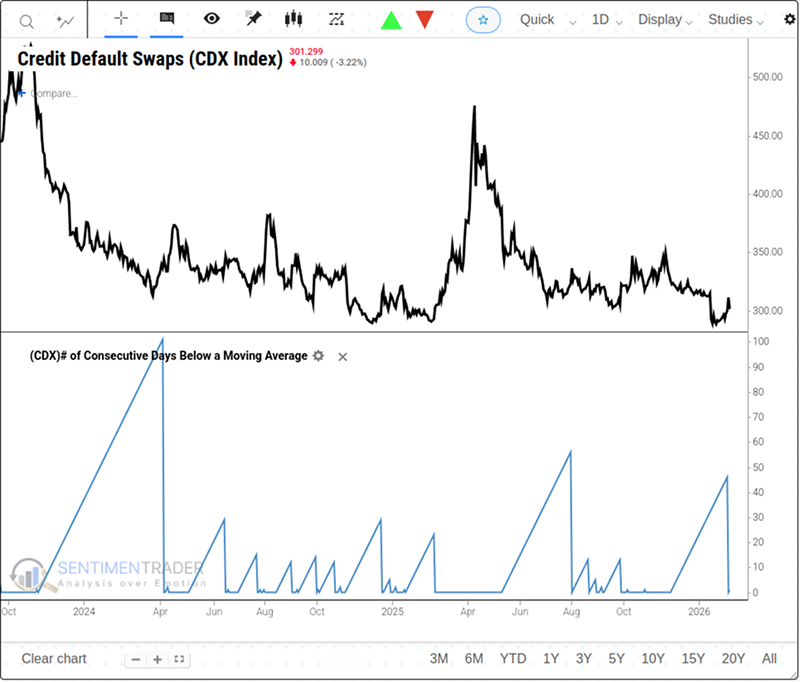
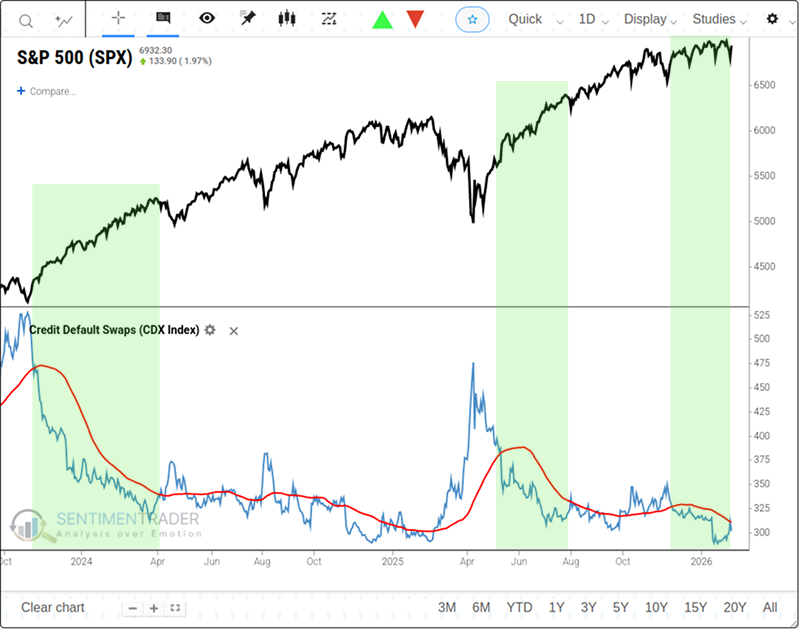
Credit spreads remain well-behaved
One of the cornerstones of a healthy stock market environment is a lack of bond market anxiety. Whether the bond market is 'smarter' is up for debate; it's not something we've ever been able to prove with consistency. However, it is undeniably a vital signal for risk assets.
A good proxy for bond market anxiety is bond traders' pricing of credit default swaps (CDX). As long as traders are not paying up for protection against bond defaults, especially if they're not rapidly re-pricing that risk, things are usually okay in the stock market.
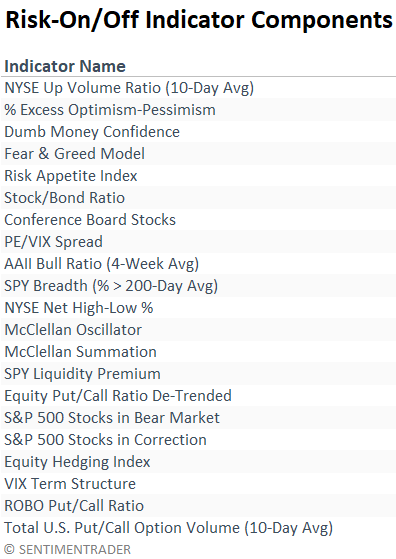
Pause in High Risk Appetite
Since late 2025, the market has been in an extremely optimistic state. The Risk-On/Off indicator-a composite reading of 21 different sentiment and breadth metrics-had remained above the critical 67% threshold for 42 consecutive days.
This phenomenon typically signals a 'tailwind period' for the market, characterized by elevated investor sentiment and a healthy internal market structure. However, this winning streak was broken on February 5, when the indicator fell back below 67%.
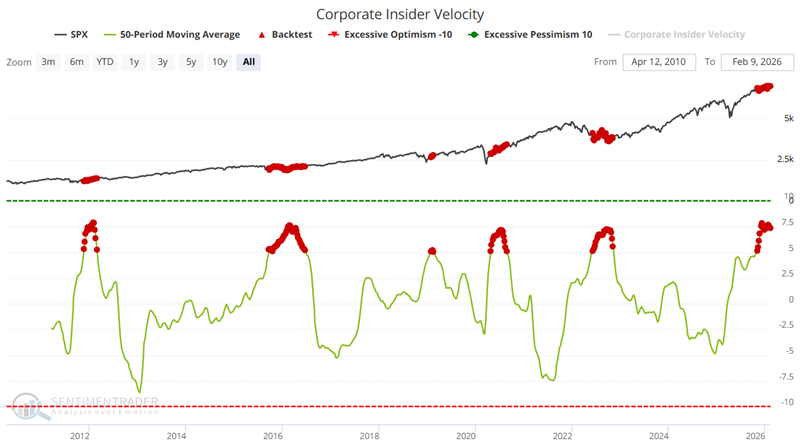
Velocity indicators offer a look 'below the surface'
For the S&P 500 Index, the Nasdaq 100 Index, and the S&P 500 sectors, we track insider buying and selling across the constituent stocks. We track separately buying, selling, the buy/sell ratio, and a unique measure we call 'insider velocity.'
This indicator shows the velocity of corporate insider buying versus selling in S&P 500 stocks. It takes a 4-week rate of change for insider buys and subtracts a 4-week rate of change for insider sales. The greater the positive difference, the more insiders are buying their stock, and the more positive it is for the market. The lower the difference, the more intensely they're selling their stock, and the worse it is for the market.
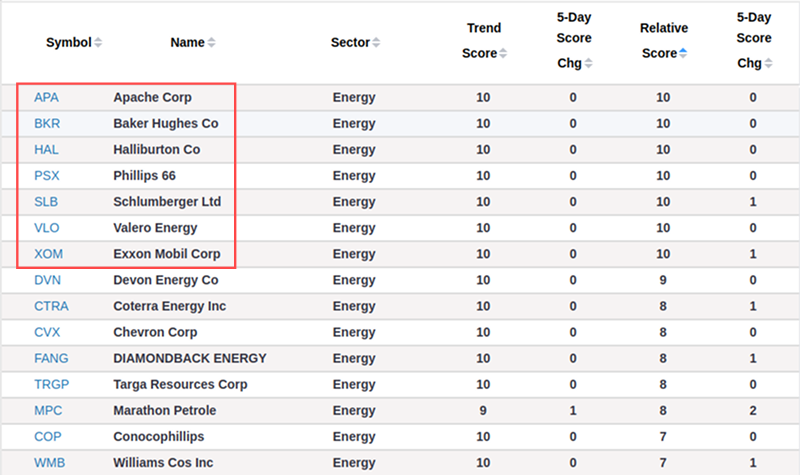
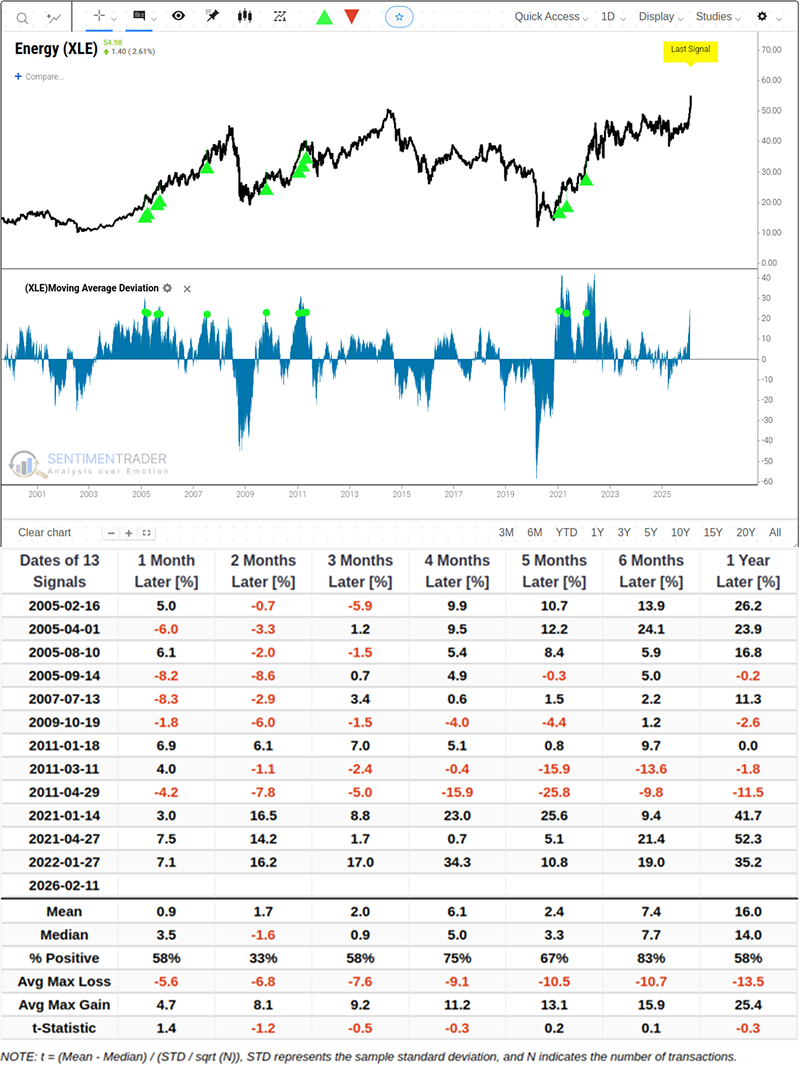
Sustained Confidence in Energy
When it comes to broad thematic market trends, we typically observe early movers first driving up the prices of the most obvious candidates before selling to trend followers. A similar pattern has emerged in the energy sector in recent weeks.
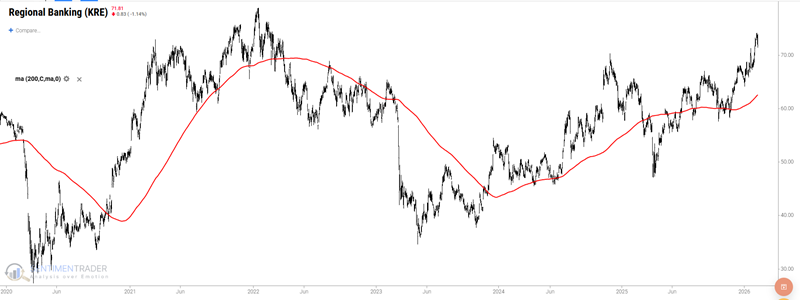
Regional banks are looking good but face seasonal headwinds
No one can complain too loudly about the performance of regional banks lately. In the chart below, we see the price action S&P 500 Regional Banking Sector ETF (KRE).
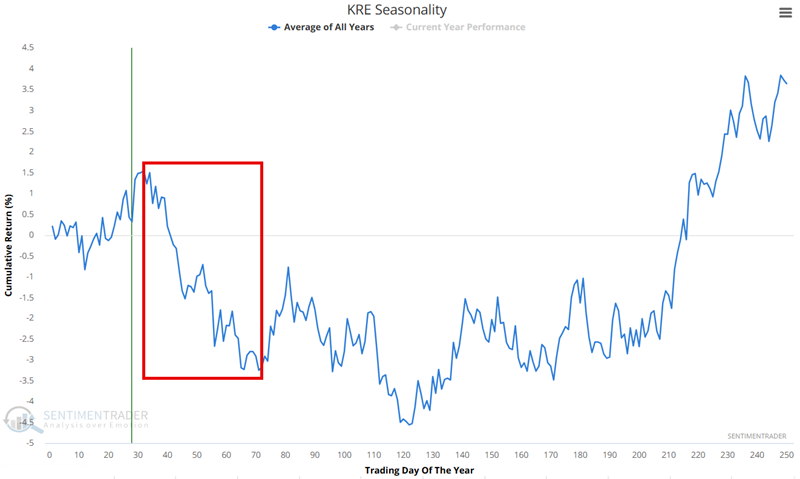
The regional banks sector has shown itself to be a highly cyclical performer. The chart below displays the Annual Seasonal Trend for ticker KRE. It also highlights the period extending from Trading Day of the Year (TDY) #32 through TDY #71. For 2026, this period extends from the close on February 18th through April 15th.
About TradingEdge Weekly...
The goal of TradingEdge Weekly is to summarize some of the research published to SentimenTrader over the past week. Sometimes there is a lot to digest, and this summary highlights the highest conviction or most compelling ideas we discussed. This is NOT the published research; rather, it pulls out some of the most relevant parts. It includes links to the published research for convenience, and if you don't subscribe to those products, it will present the options for access.