
TradingEdge Weekly for Dec 5 - Post-Election December performance, Russell 2000 reversal, Seven-month S&P 500 streak, Zweig Breadth Thrust recovery, Investor sentiment, VIX buy signal, Insider clues

Key points:
- December has historically been one of the best-performing months for stocks, especially in post-election years
- The Russell 2000 triggered a "Reverse Up" buy signal, signaling potential strength in small-caps
- The S&P 500's seven-month winning streak suggests continued bullish momentum
- Zweig Breadth Thrust and other indicators show market breadth recovery
- Various sentiment indicators reveal shifting investor psychology
- Corporate insider buying is increasing across multiple sectors
- Market liquidity conditions have improved dramatically
House View:
- Stocks:
- Short-term: Bullish. Major U.S. indices trade in a narrow range near record highs, with broadening market breadth as capital rotates from large-cap tech to rate-sensitive small-caps. Sentiment is buoyed by strong expectations of a Fed rate cut at the December meeting. This time frame covers 1-4 weeks.
- Intermediate-term: No view. Valuations remain elevated relative to historical averages, supported by expectations of strong 2026 earnings growth. However, risks loom from potential inflation rebound (reflation risk) and uncertainty over the pace of Fed easing in 2026. Sector rotation is expected to remain dynamic, with no clear directional edge for the broader market. This time frame covers 1-5 months.
- Long-term: Bullish. Structural growth drivers remain intact, anchored by AI infrastructure investment and economic resilience. Small-cap stocks are poised to narrow their valuation discount as liquidity conditions improve. The labor market's structural tightness supports consumer spending, while corporate cost-cutting and productivity gains underpin margins. This time frame covers 6-12 months.
- Cyclical momentum favors semiconductor, industrial, and small-cap segments-benefiting from rate cuts and economic normalization.
- Defensive resilience persists in discount retail and essential services, offering hedges against potential consumer weakness.
- Very long-term (one year+) favors sectors tied to AI productivity gains and infrastructure investment, as well as undervalued small-cap value stocks.
- Bonds: Long-term cycles remain bearish. Treasury yields fluctuate amid conflicting signals-short-term yields are anchored by Fed rate cut expectations, while long-term yields face upward pressure from fiscal deficit concerns and a potential inflation rebound. Safe-haven flows provide intermittent support during equity market volatility, but persistent inflation stickiness and increased Treasury issuance limit sustained rallies. Cyclical indicators confirm no near-term reversal in the long-term trend.
- Commodities: Divergent trends persist across sectors. An effective commodity trend model maintains a bullish bias for precious metals.
- Gold: Remains resilient at elevated levels, supported by Fed rate cut expectations, central bank reserve diversification, and geopolitical risk hedging. Physical demand from key consumer markets provides additional floor support.
- Crude oil: Trades in a narrow range amid mixed signals. OPEC+ production policy adjustments offer limited support, while concerns over weak global manufacturing demand and oversupply weigh on prices. The market awaits clearer signs of demand recovery to break out of its range.
- Crypto: We follow several simple systems for bitcoin, which we consider the equivalent of the S&P 500 for crypto. Due to bitcoin's explosive growth over long periods, it's dangerous to equate neutral conditions with being bearish for some of these. However, if a system is "out," we consider it bearish for this summary.
- Triple 40: Bearish
- RSI Momentum: Bearish
- Trend and Relative Trend: Bearish
- PMI: Bearish
- M2 ROC: Bullish
- Notable Moves in Global Markets:
- Europe (STOXX 600): Rallies for three consecutive sessions, driven by unexpected regulatory tailwinds for the auto sector-potential relaxation of U.S. fuel efficiency standards benefits European luxury carmakers. Industrial and energy stocks gain on infrastructure and grid investment expectations, while the region's valuation discount attracts global capital seeking defensive exposure.
- Japan (Nikkei 225): Key psychological barriers have been breached, driven by robust performance from technology conglomerates and signs of persistent inflation. A weaker yen and investor optimism over corporate governance reforms have provided market tailwinds. Rising domestic bond yields are interpreted as signals of economic normalization, bolstering corporate earnings prospects.
- Greater China (Hang Seng & A-shares): Range-bound amid stimulus vs. tariff risks. Beijing's policy support props up financials/property, but Trump's potential 2026 tariff hikes weigh on valuations. Sentiment remains cautious-opportunities limited to export-focused manufacturers and high-dividend blue chips with share buybacks.
Where we're at
Most investors have the most riding on equities. We feel that the most significant determinants of success for investors are whether to adjust their allocation to that asset class based on factors that have historically had a good record of preceding above- or below-random returns in the months ahead.
Those factors include the probability of a looming recession, sentiment, price action, volatility, breadth, and the bond market. The chart below summarizes the main indicators and composite models we watch for those factors, and they're mostly in bullish regimes. Valuations are not part of these factors since the relationship has been too inconsistent on time frames under one year.
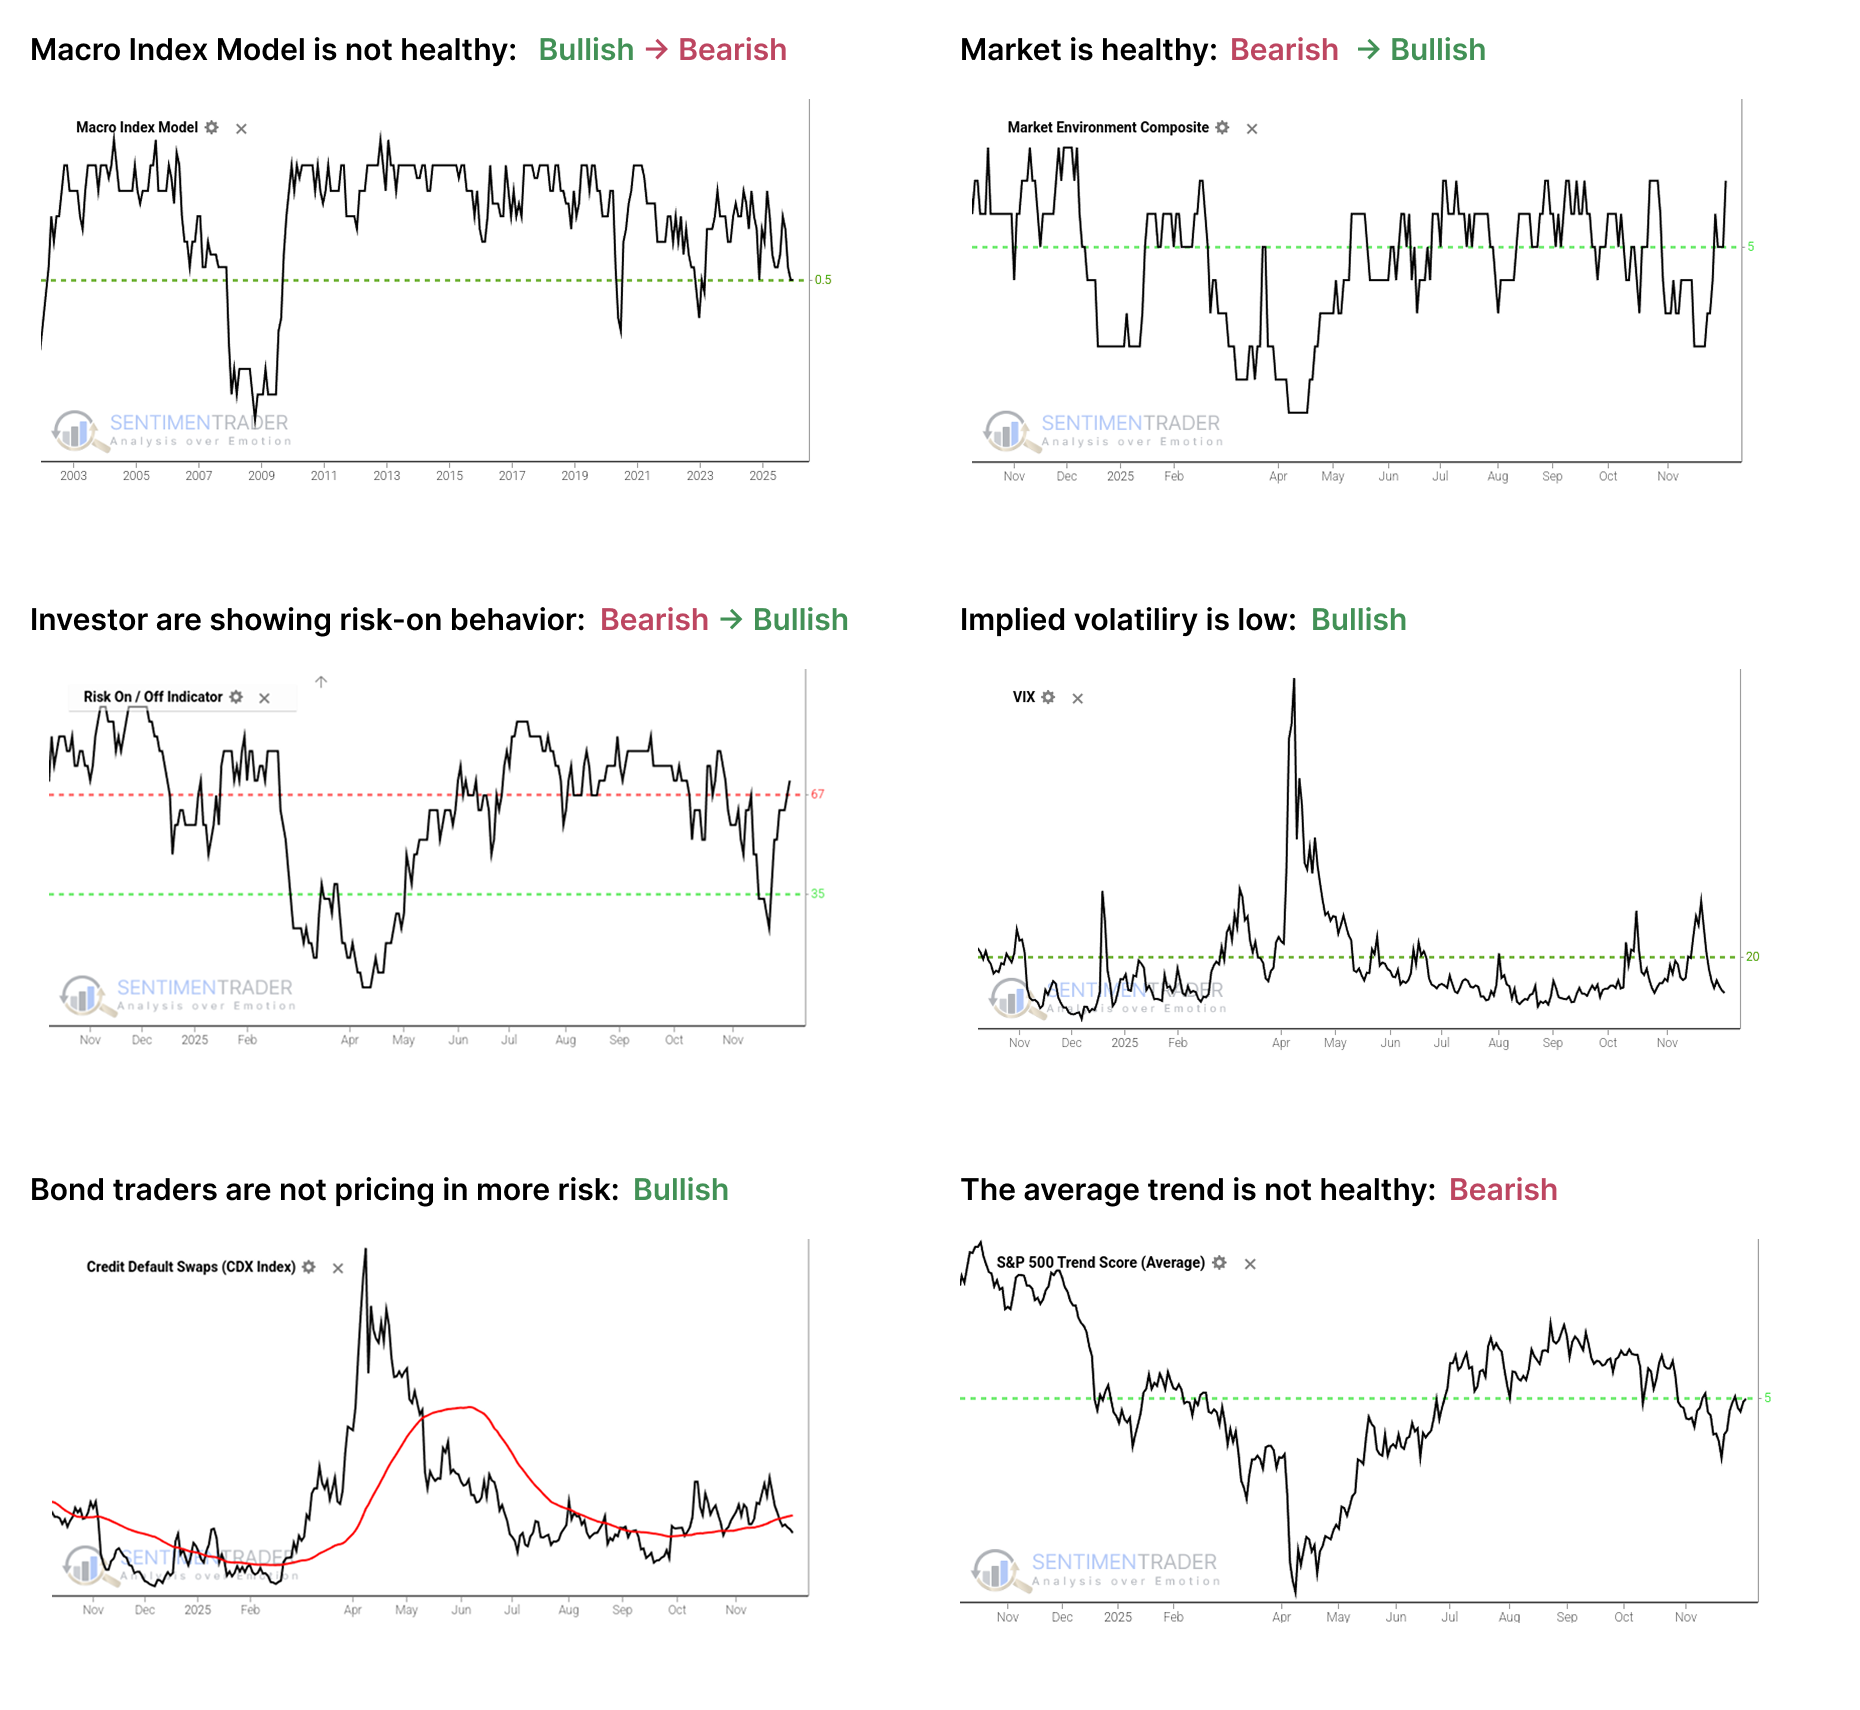
- The Macro Index Model is at or below the 50% threshold, which has proven to be a critical warning level as outlined here.
- The Market Environment has been skittish since April, but is currently healthy. Future returns, especially for higher-beta indices, has been markedly better, with less risk, when the environment is healthy as outlined here.
- The Risk On / Off Indicator shows that investors are still in risk-on mode. This has been a good sign for future returns as outlined here.
- Implied volatility remains below 20, showing a calm environment. The S&P 500 has perfomed well when this is the case as outlined here.
- Credit default swap spreads are below their 50-day moving average, which drastically improves stock returns as outlined here.
- A composite of trend measures in SPY and the average S&P 500 stock remain below 5, which show unhealthy trend conditions.
Since April, the most compelling studies have had a strongly bullish bias on longer time frames. You can follow these through the Active Studies page. From time to time, when the analysts' studies provide an overwhelming message, it will override the charts above, but there has been no consensus in the studies to suggest overriding the bullish environment.
Other major markets have been mostly rangebound for four months, and there is little among what we follow to suggest a compelling edge either way.
Post-election year December performance
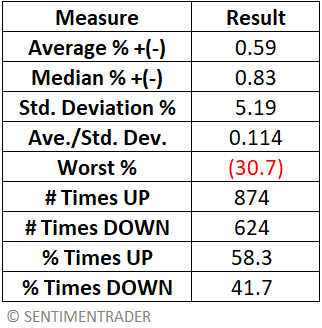
In this piece, we examine Dow Jones Industrial performance during December of Post-Election years since 1901. First, let's establish a baseline of comparison by looking at the performance for "all months" starting in 1901. For testing, we use the monthly closing price of the Dow Jones Industrial Average from January 1901 through October 2025.
Now, let's see if there is any appreciable difference in market performance during December of Post-Election years versus the "average" month performance highlighted above.
The chart below displays the growth of $1 invested in the Dow only during December of each post-election year starting in 1901.
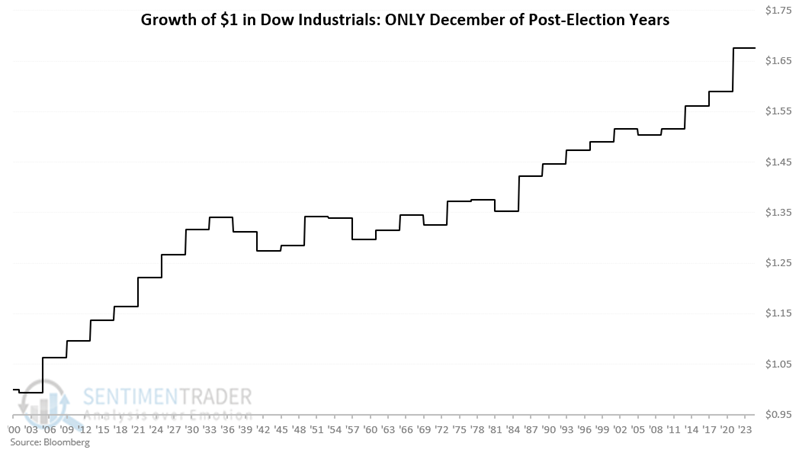
The table below displays a summary of monthly performance for all 30 post-election Decembers since 1901 compared to the baseline results for all months starting in 1901.
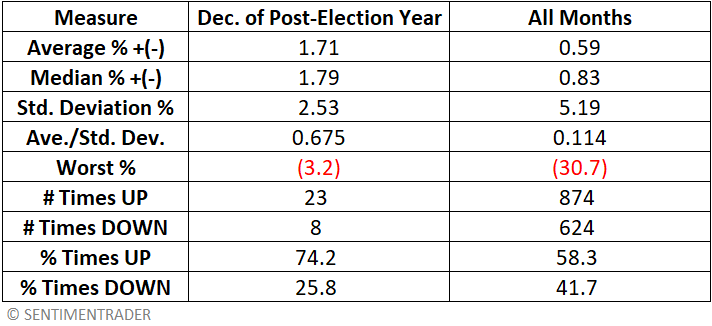
Things to note regarding December of post-election years versus all months since 1901:
- A higher Win Rate (74.2% versus 58.3%)
- Average and Median monthly returns are over two times greater
- A lower standard deviation and higher risk-adjusted returns
- A "worst" monthly loss of just -3.2%
Small-cap resurgence with Russell 2000 Reverse Up signal
The Russell 2000 ETF (IWM) triggered a "Reverse Up" buy signal at the close on Nov 26, 2025. A "Reverse Up" signal identifies when an asset's price rebounds from a one-month low to a one-month high in fewer than ten trading sessions.
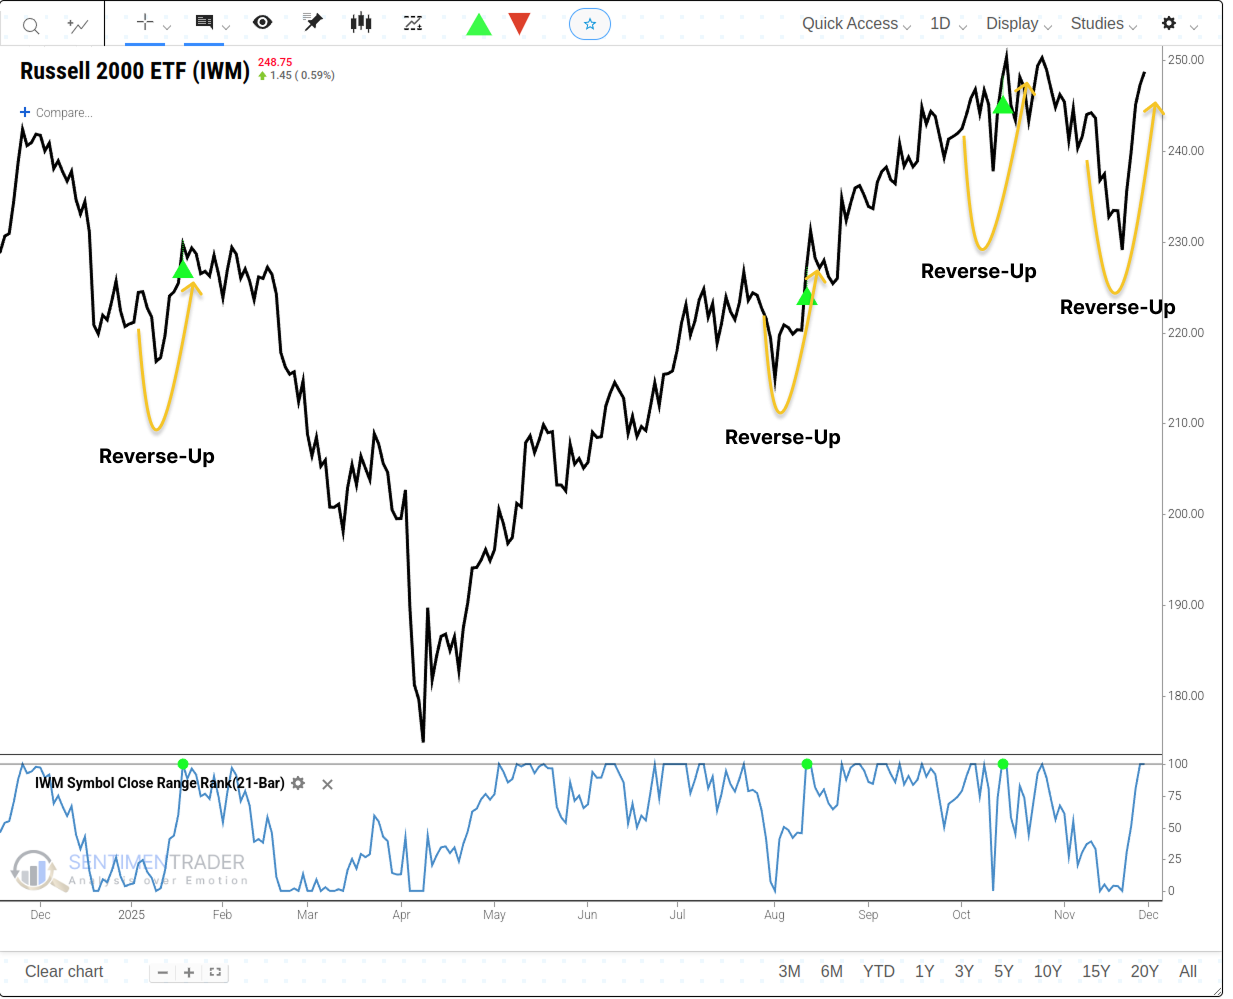
The results look encouraging, especially over the three-month timeframe. Between 2013 and 2020, there were 14 consecutive positive signals over three-month periods.
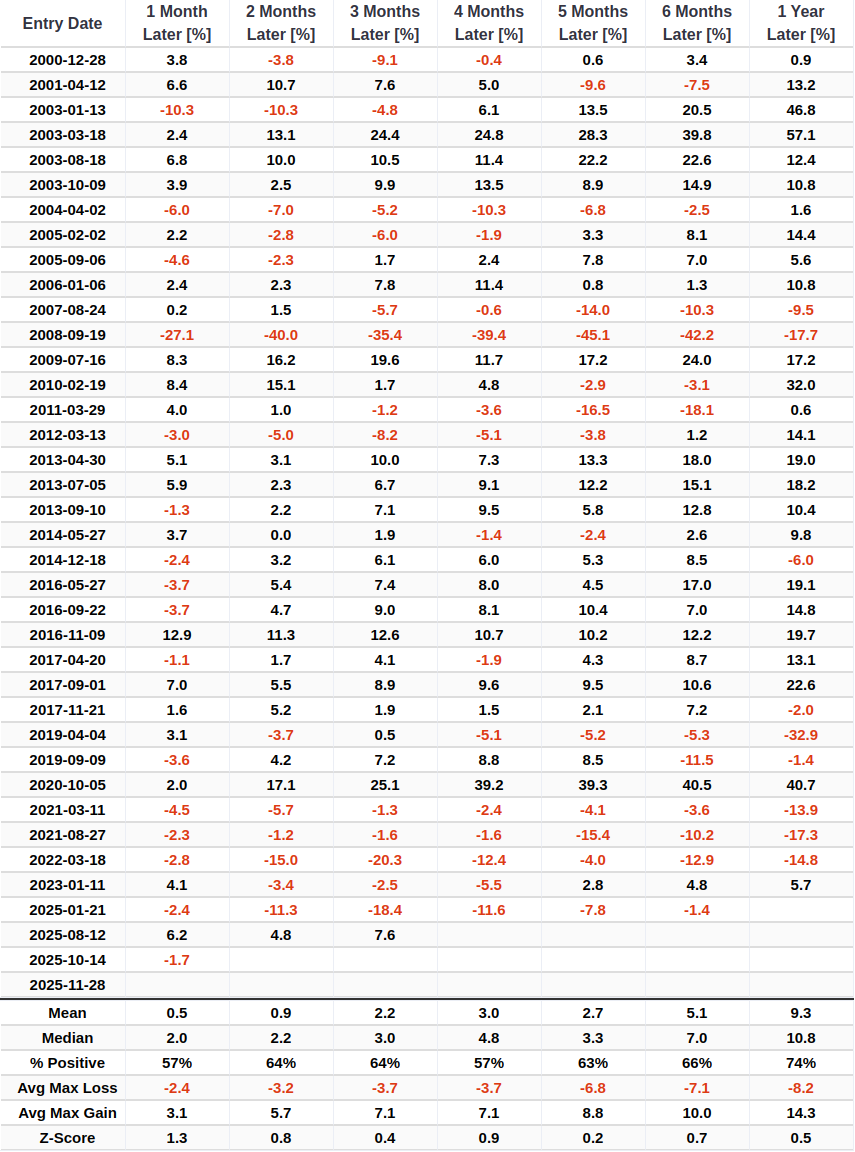
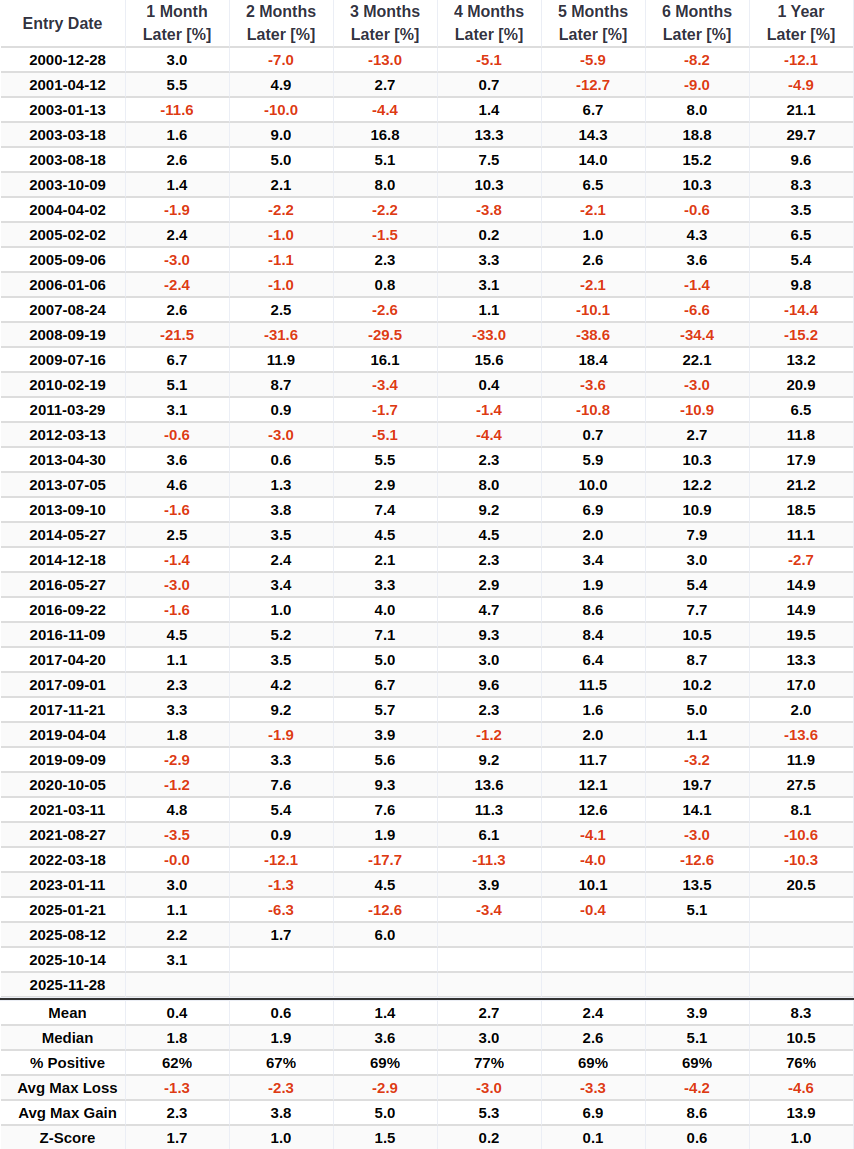
When small-caps trigger this reversal signal, the broader market also tends to benefit. The S&P 500 has shown consistent positive returns following these events.
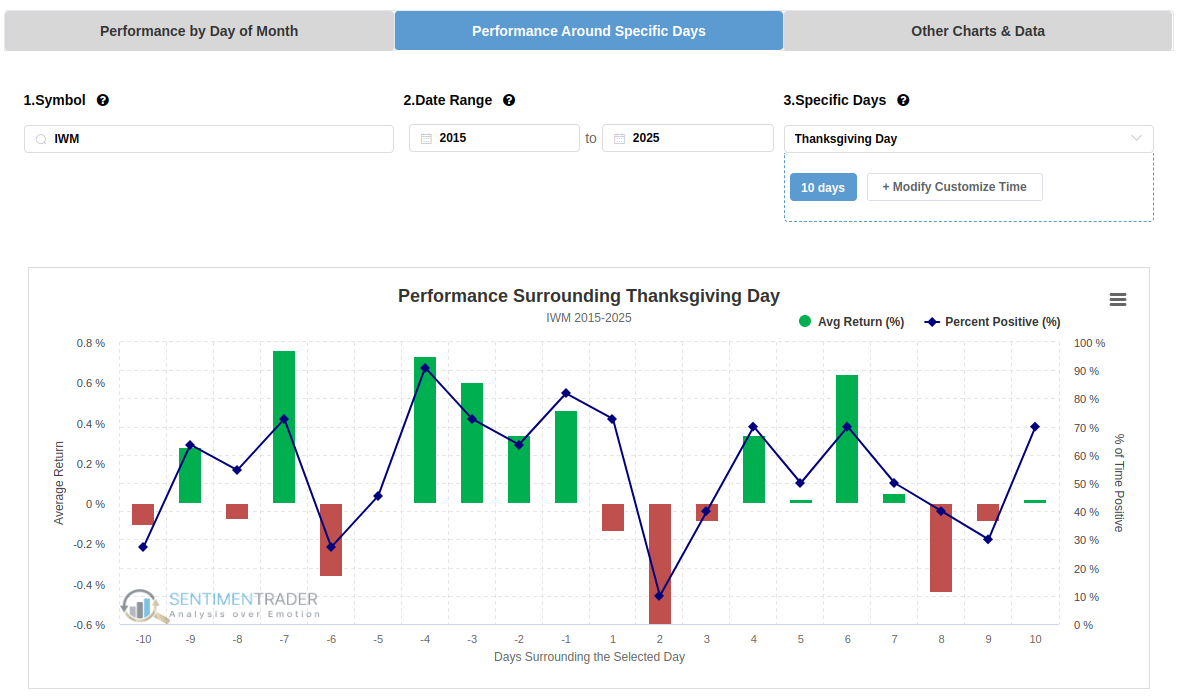
The recent price action aligns closely with historical seasonal trends for this time of year.
Seven-month winning streaks tend to continue
By rallying during the week of Thanksgiving, the S&P 500 Index managed to eke out a gain for November, stretching its consecutive month winning streak to a rare seventh straight month.
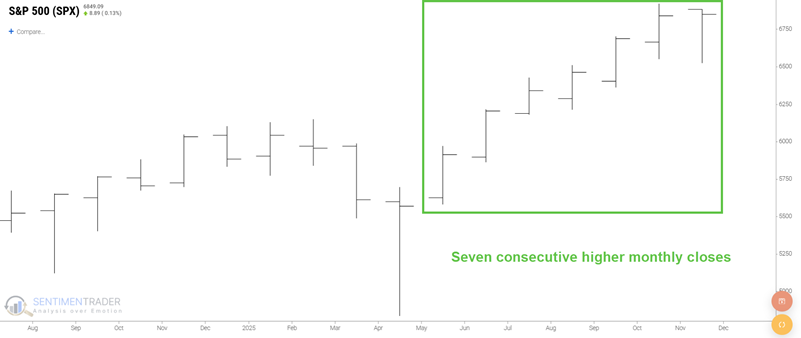
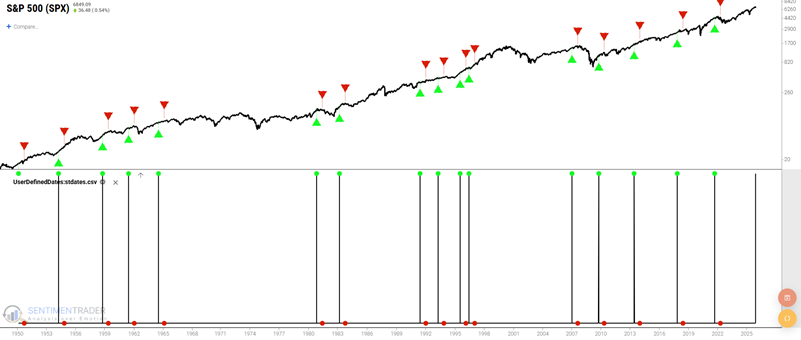
The green up arrows in the chart below highlight all 16 earlier instances where the S&P 500 closed higher for seven consecutive months. The red down arrows represent seven months after the signal dates.
The table below summarizes the results for a seven-month holding period following seven consecutive months of gains for the S&P 500.
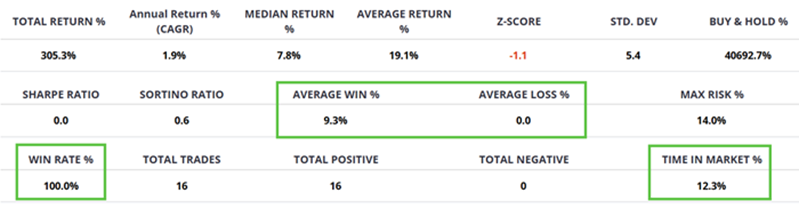
Note that this strategy was only in the stock market 12.3% of the time over the past 75 years. Nevertheless, the S&P 500 was higher seven months later following all sixteen previous signals.
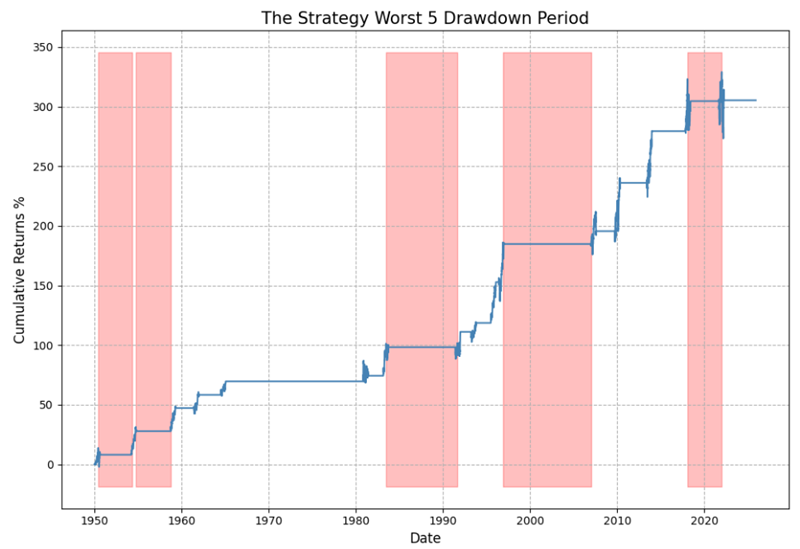
The chart below displays the hypothetical equity curve achieved by purchasing the S&P 500 Index following each signal and holding for seven months.
Market breadth recovery through Zweig Breadth Thrust
The Zweig Breadth Thrust indicator, named after the late money manager Marty Zweig, has long been regarded as the "holy grail" for the start of a bull market.
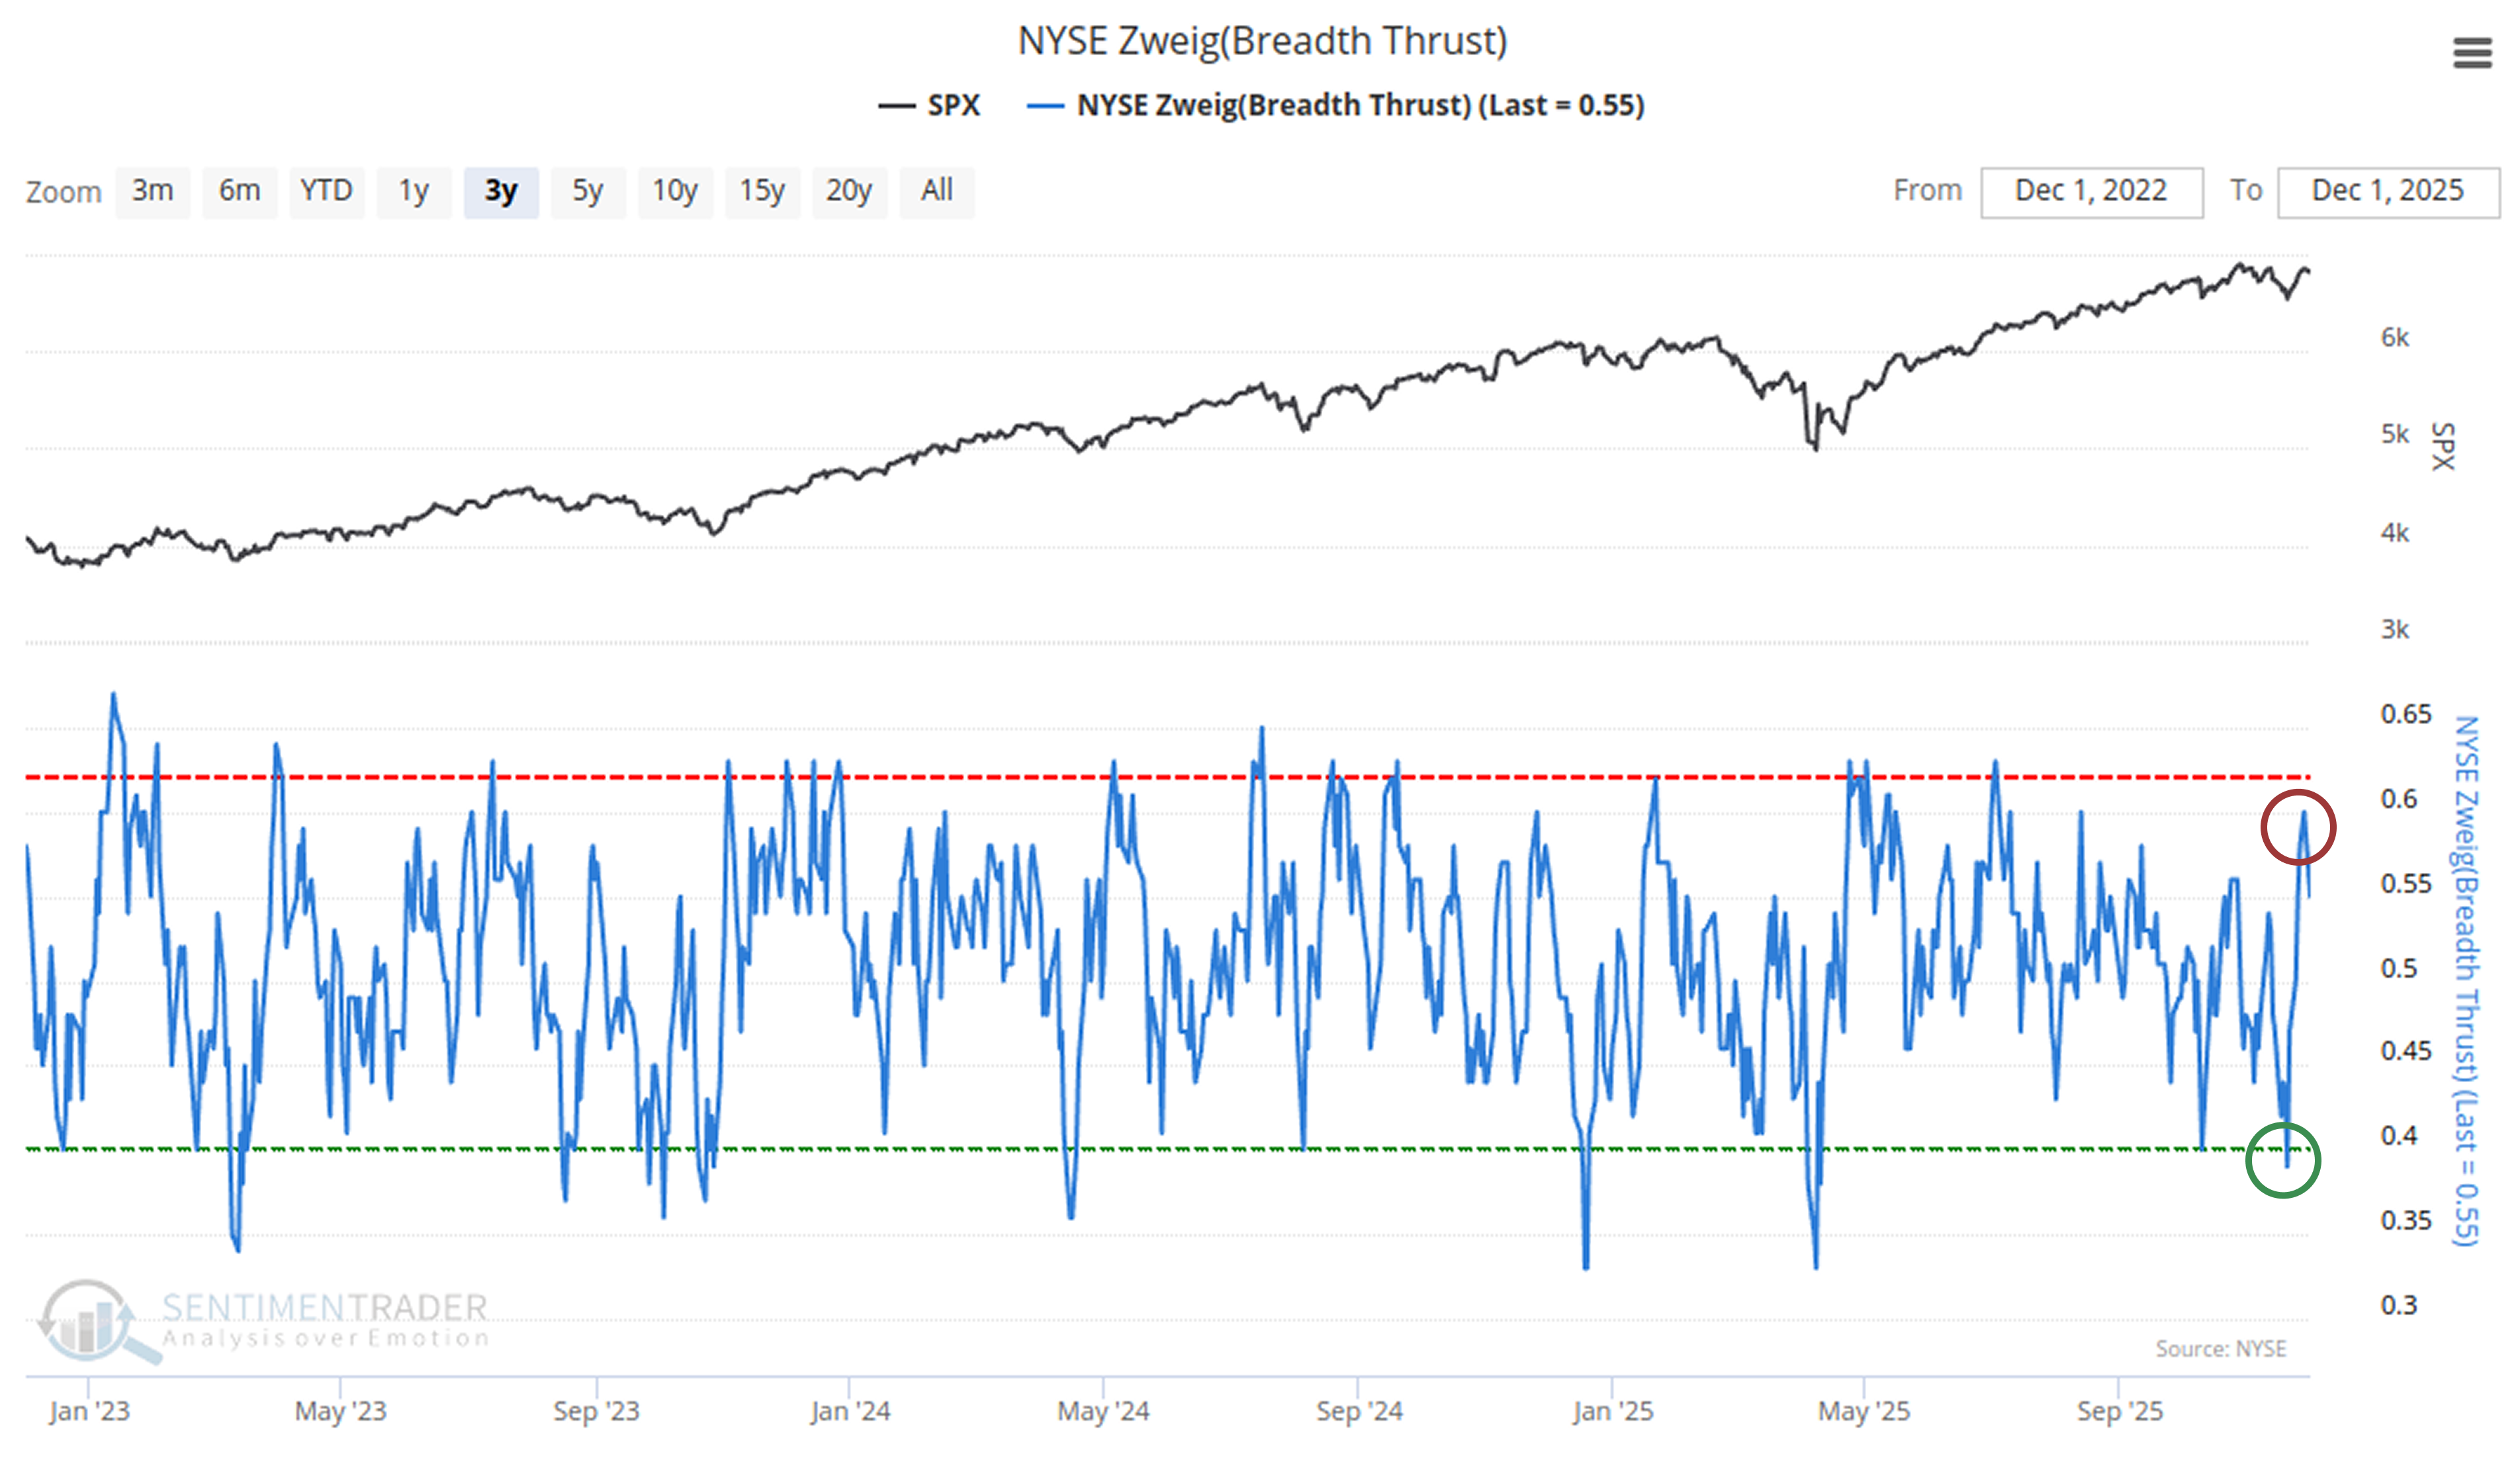
Recently, the indicator has quickly recovered from below 0.4 to above 0.59 within 10 trading days. While not reaching the ZBT signal threshold (0.62), this still represents significant breadth improvement.
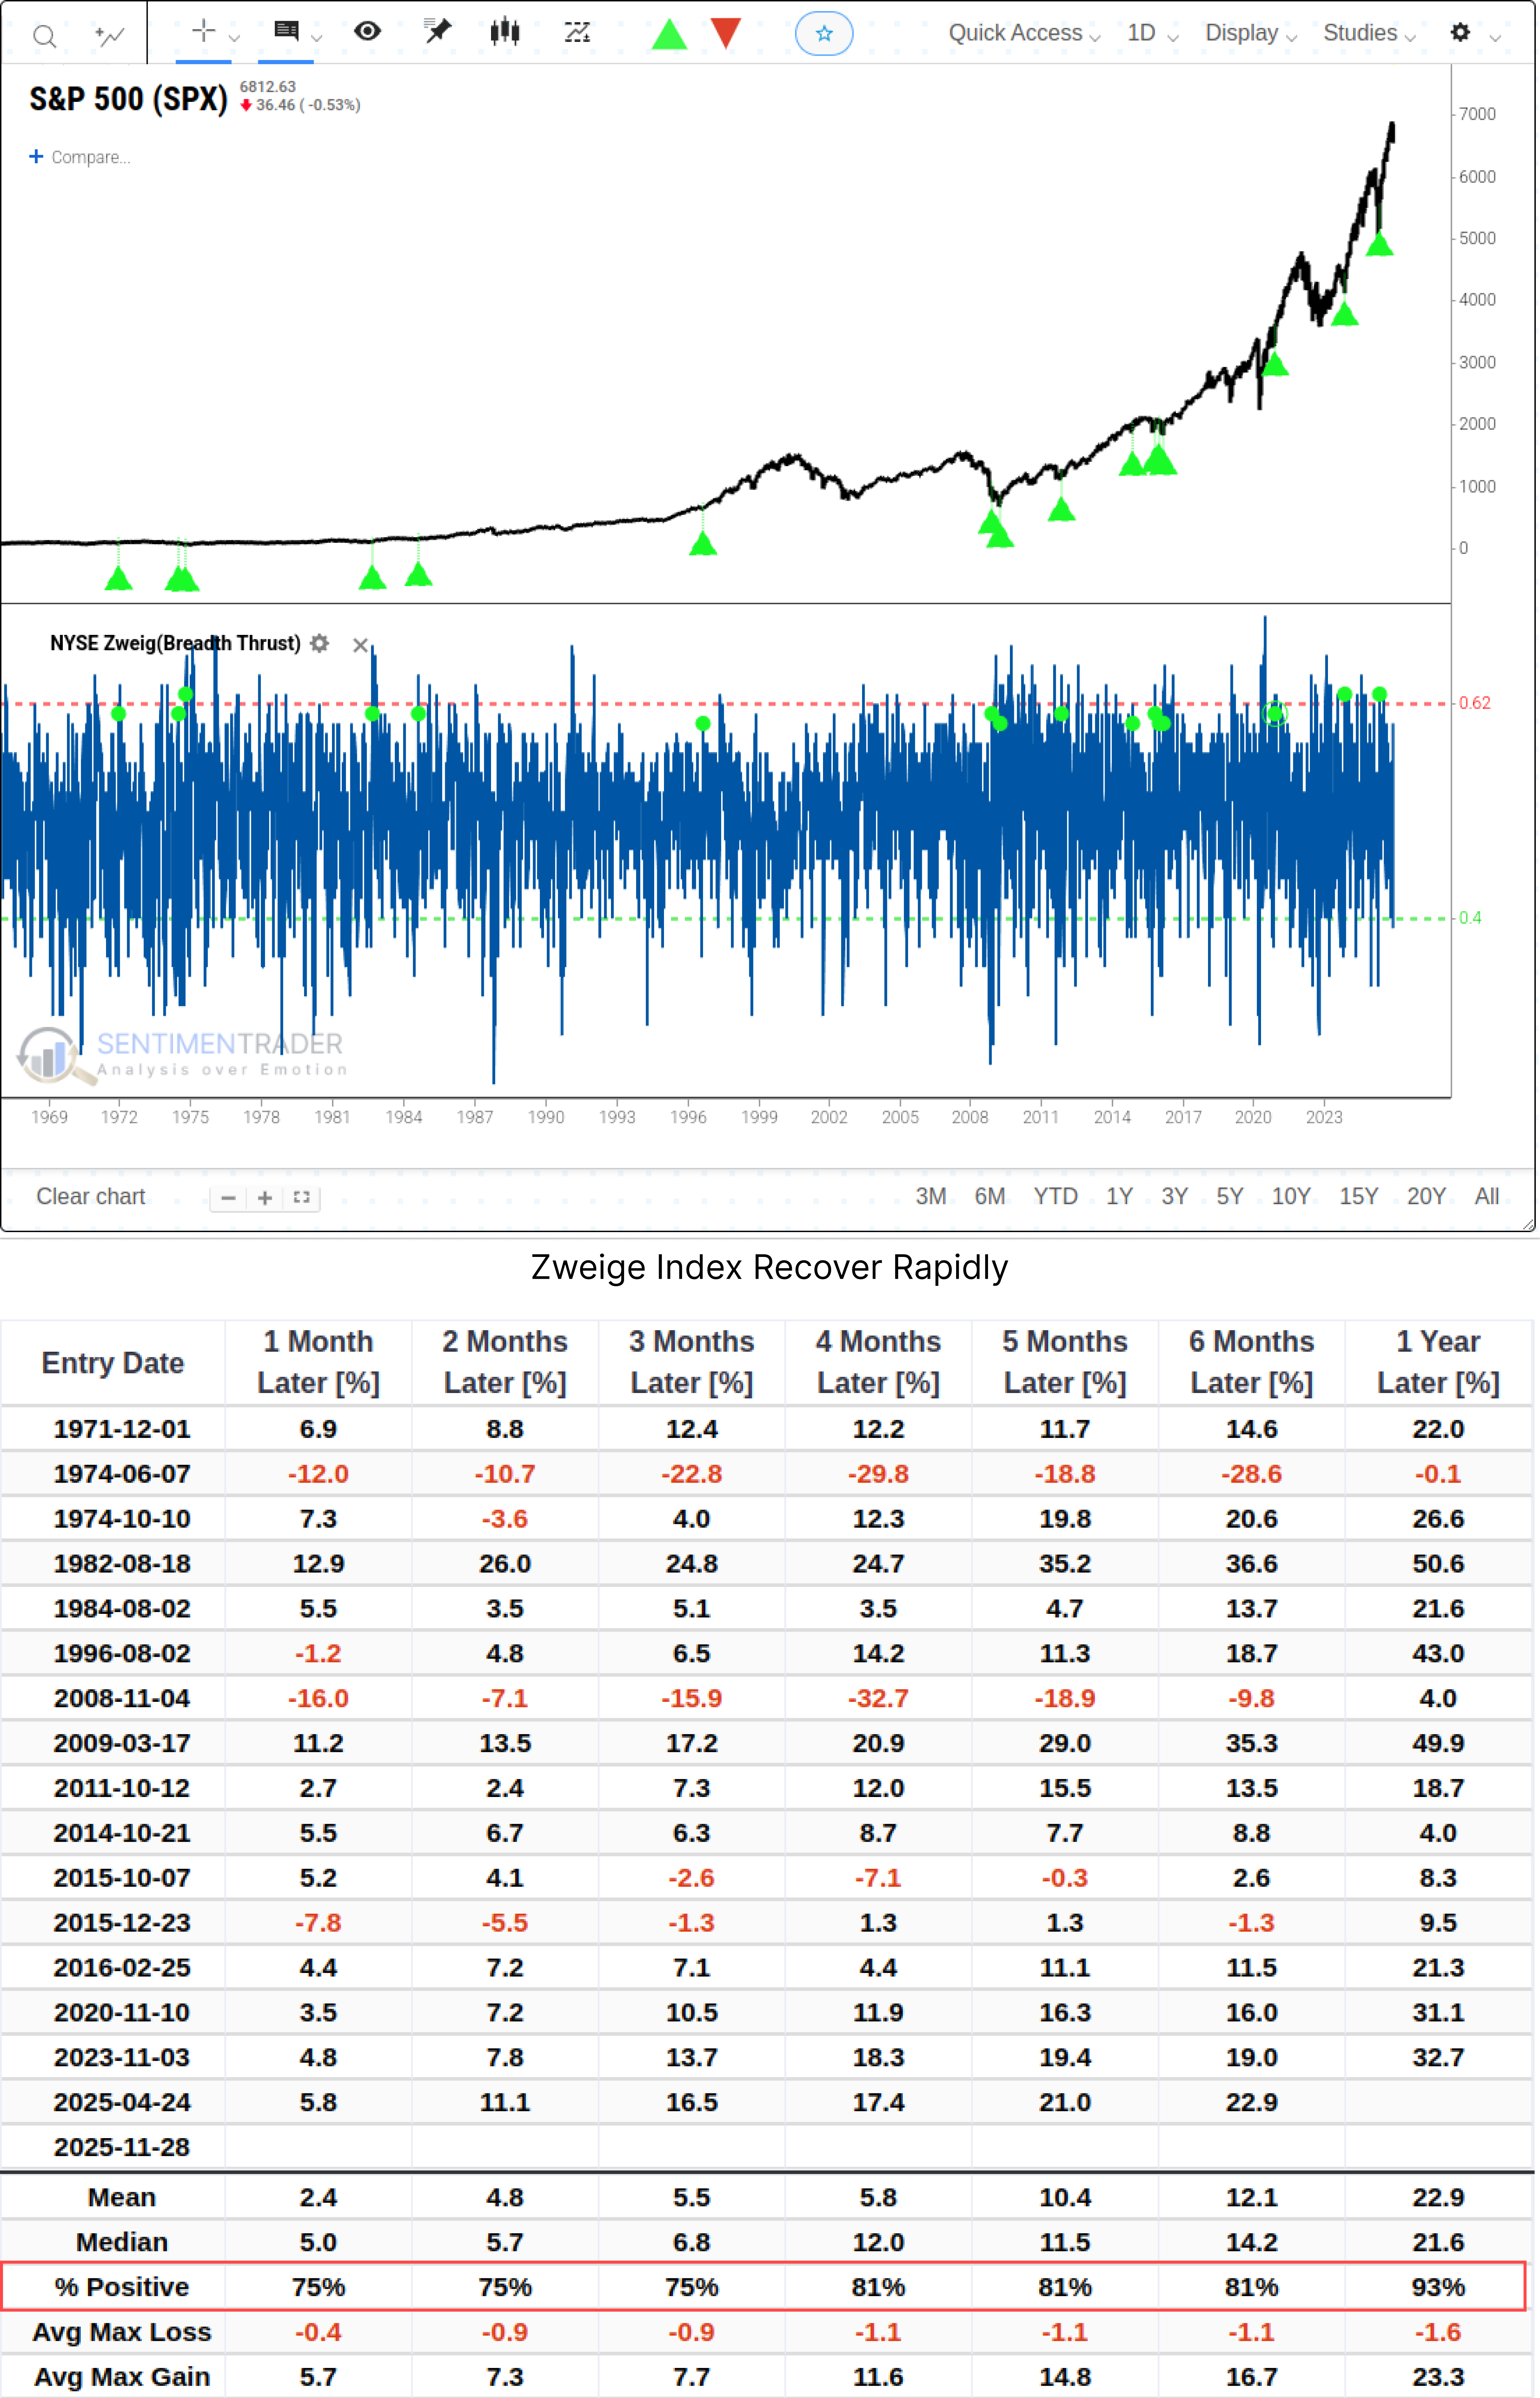
The table demonstrates the bullish impact of these signals on the S&P 500 Index. Even after one year, the average maximum drawdown is only -1.6%, with a win rate as high as 93%.
The McClellan Oscillator also showed a similar recovery pattern, though slightly less powerful than the Zweig indicator.
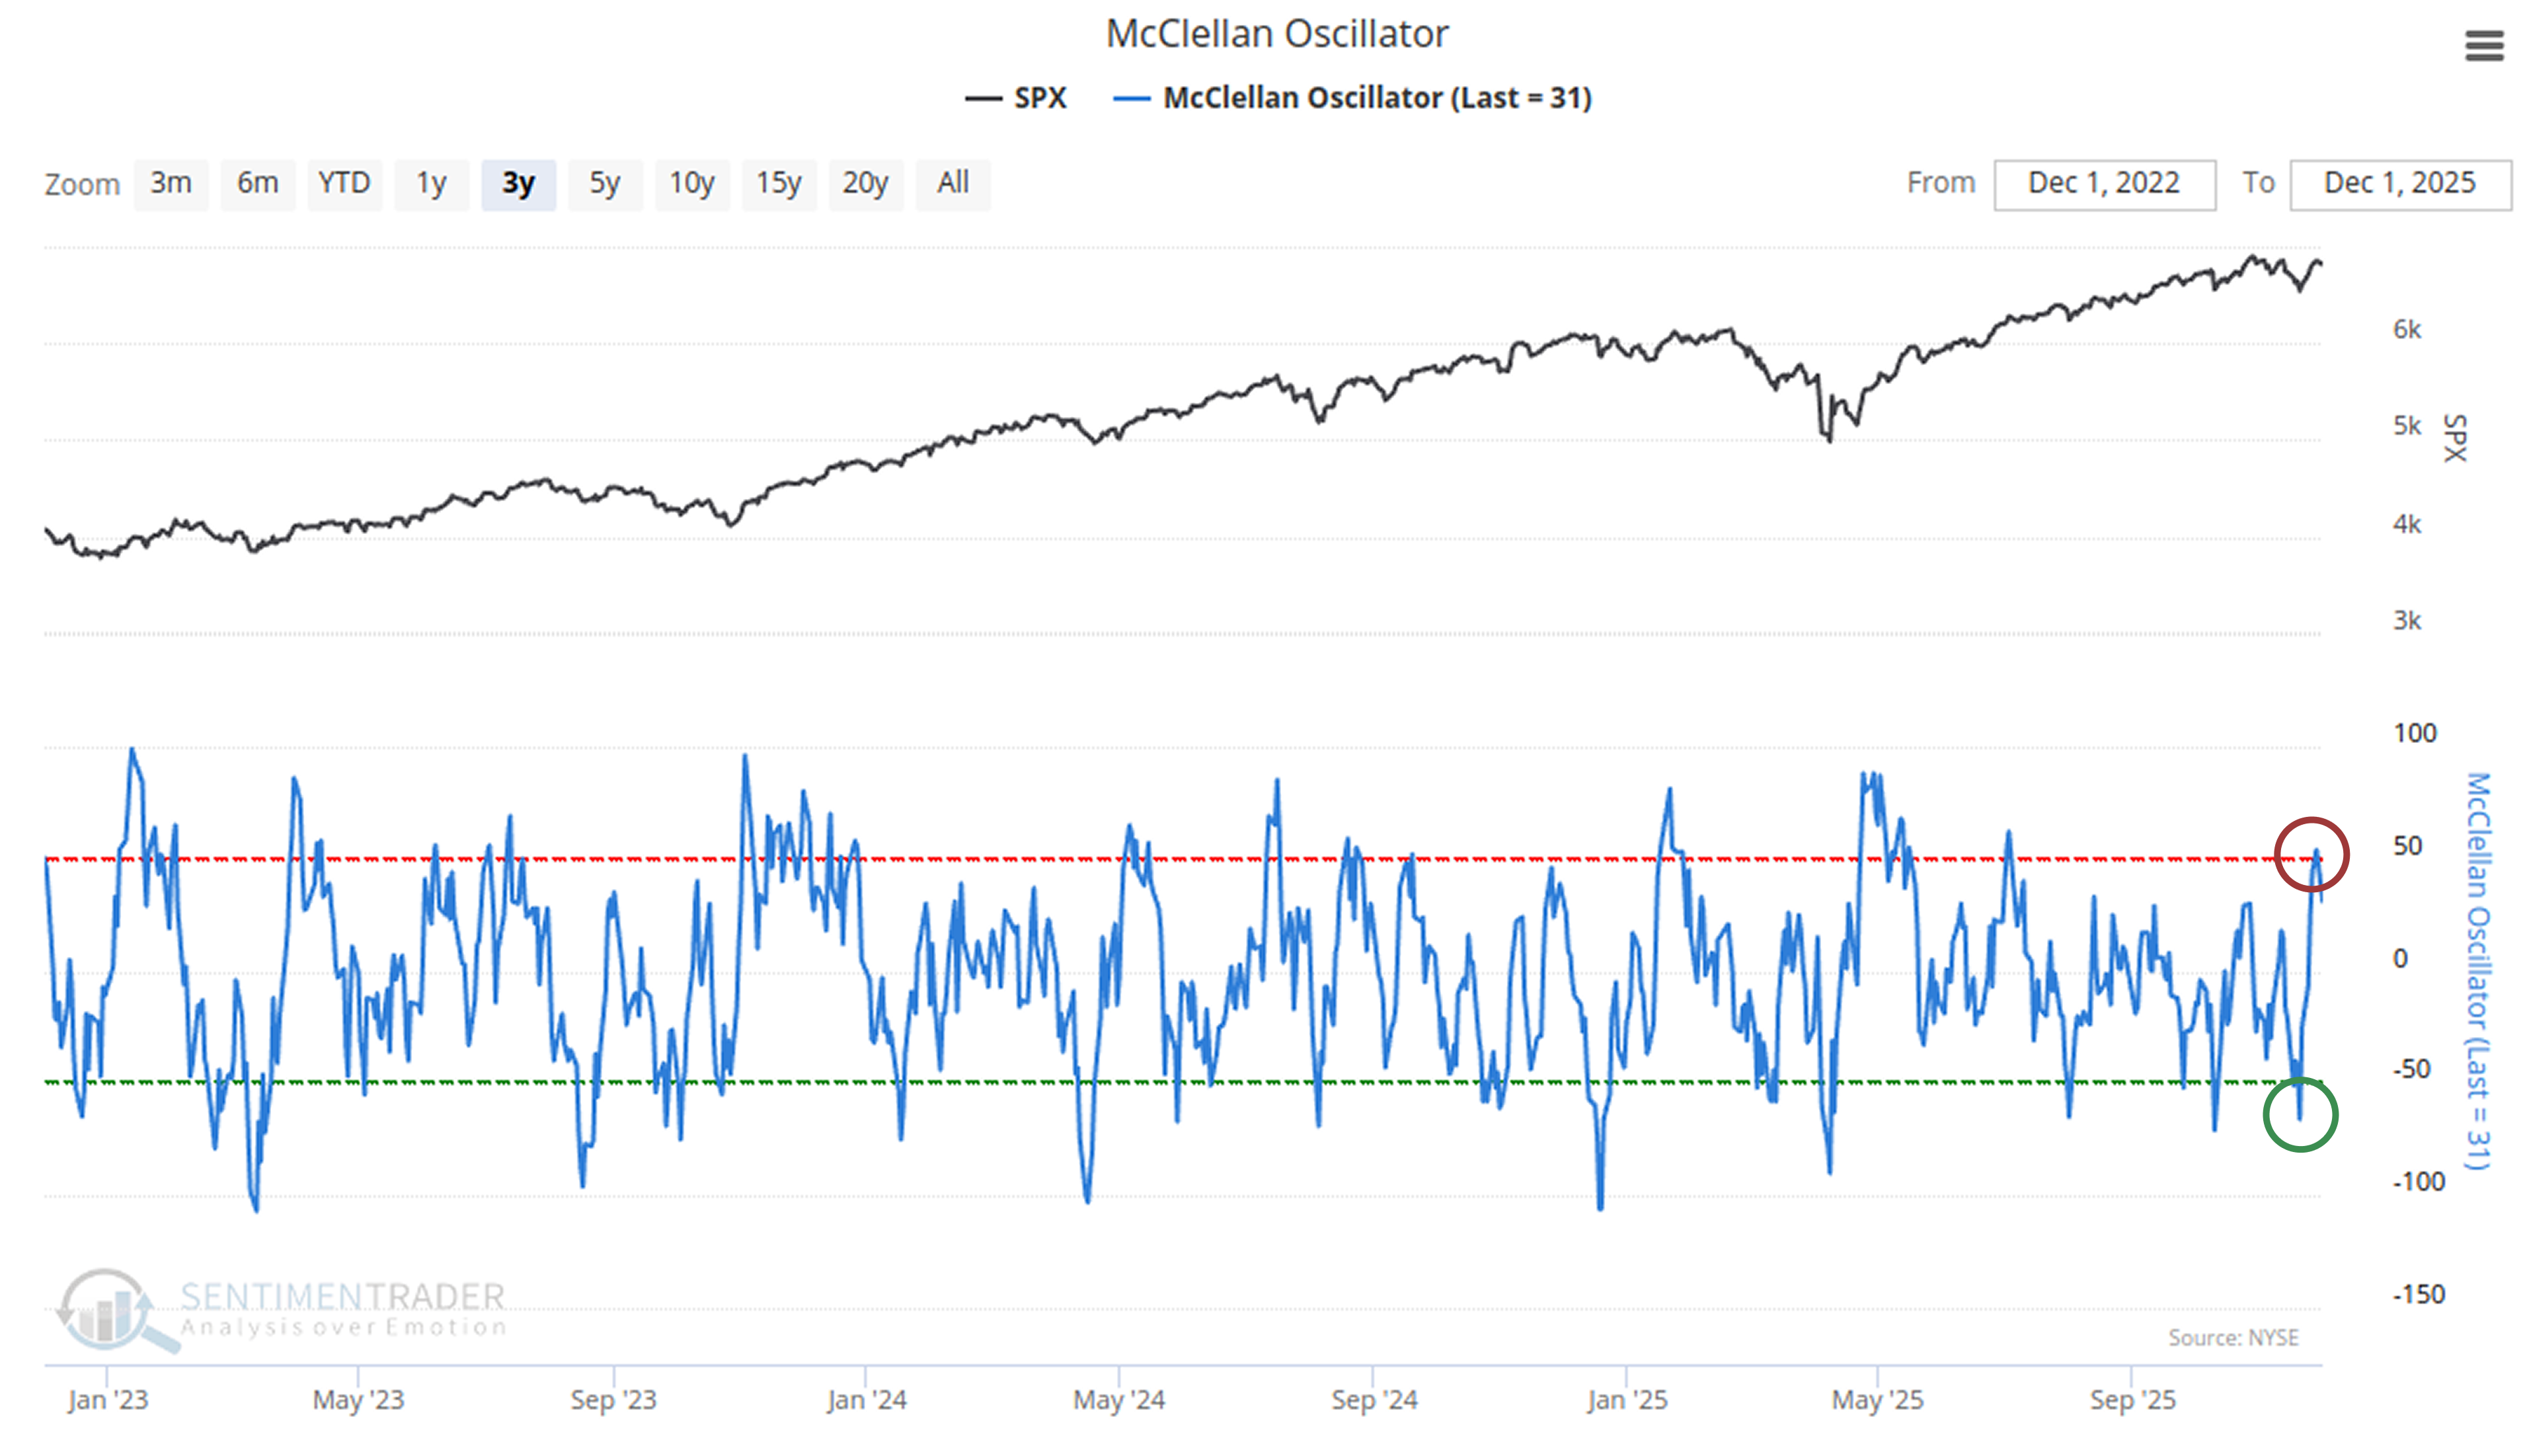
The market's price movement formed a distinctive V-shape pattern, which historically has shown strong momentum continuation.
Investor sentiment shifts reveal underlying psychology
Sentiment is the lifeblood of our work. The one thing that never changes is human nature, making fear and greed/complacency the primary emotions driving investors' actions.
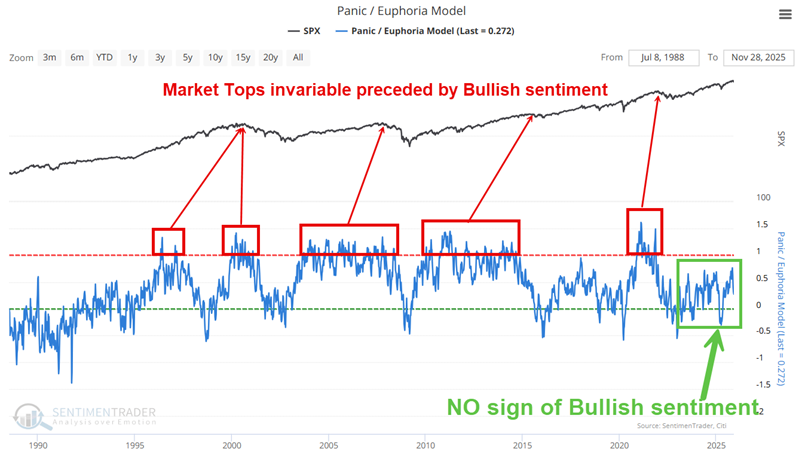
Our Panic/Euphoria Model shows no signs of overly bullish sentiment currently, despite the significant advances over the past three years.
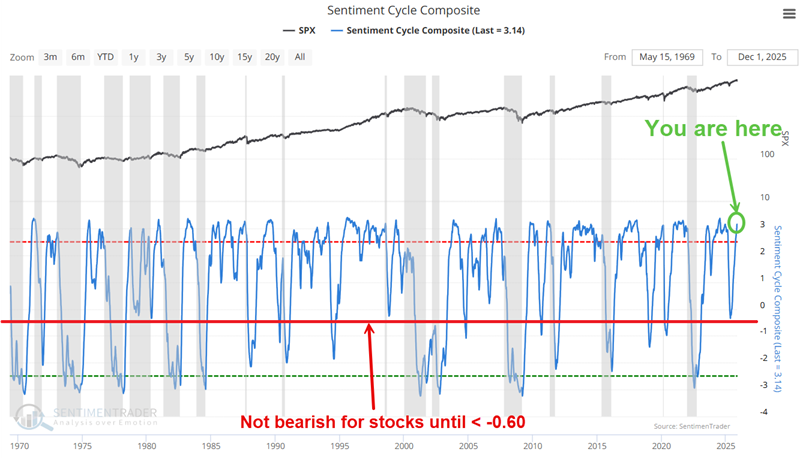
The Sentiment Cycle Composite, currently at 3.14, also shows no current concerns regarding sentiment.
AAII Bears currently show a reading of 42.7%, indicating no sign of overly rampant bullishness among individual investors.

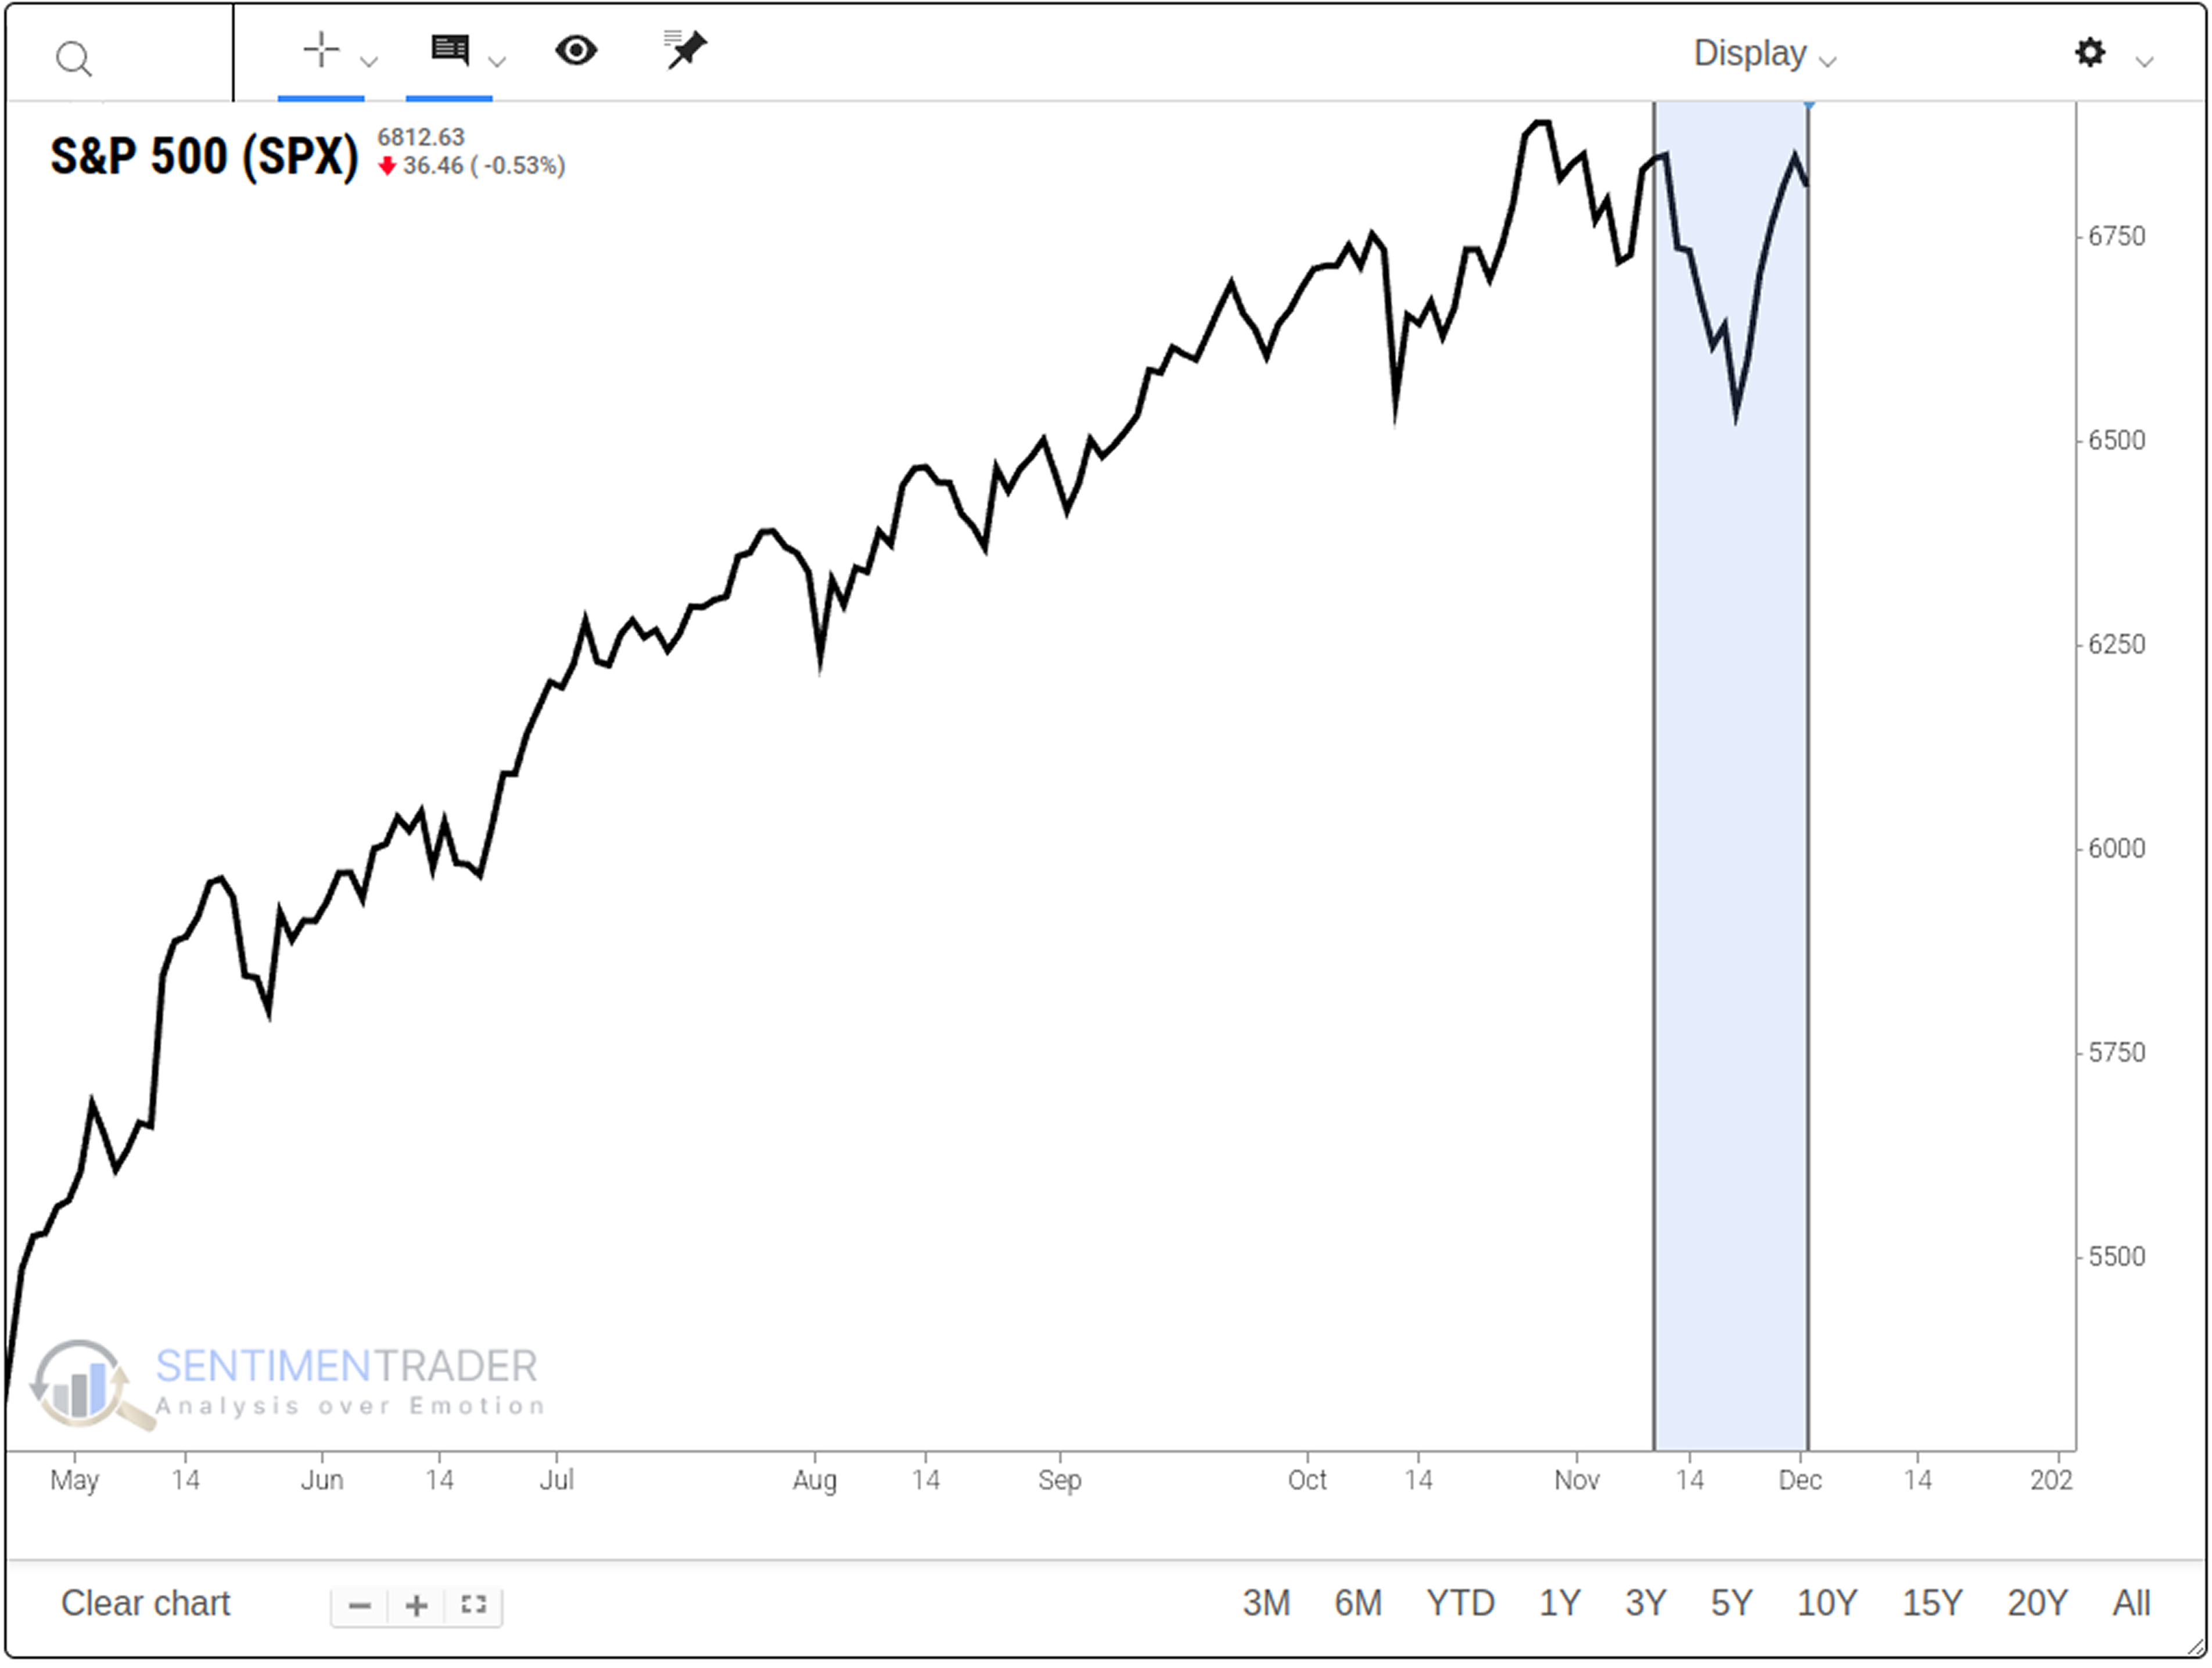
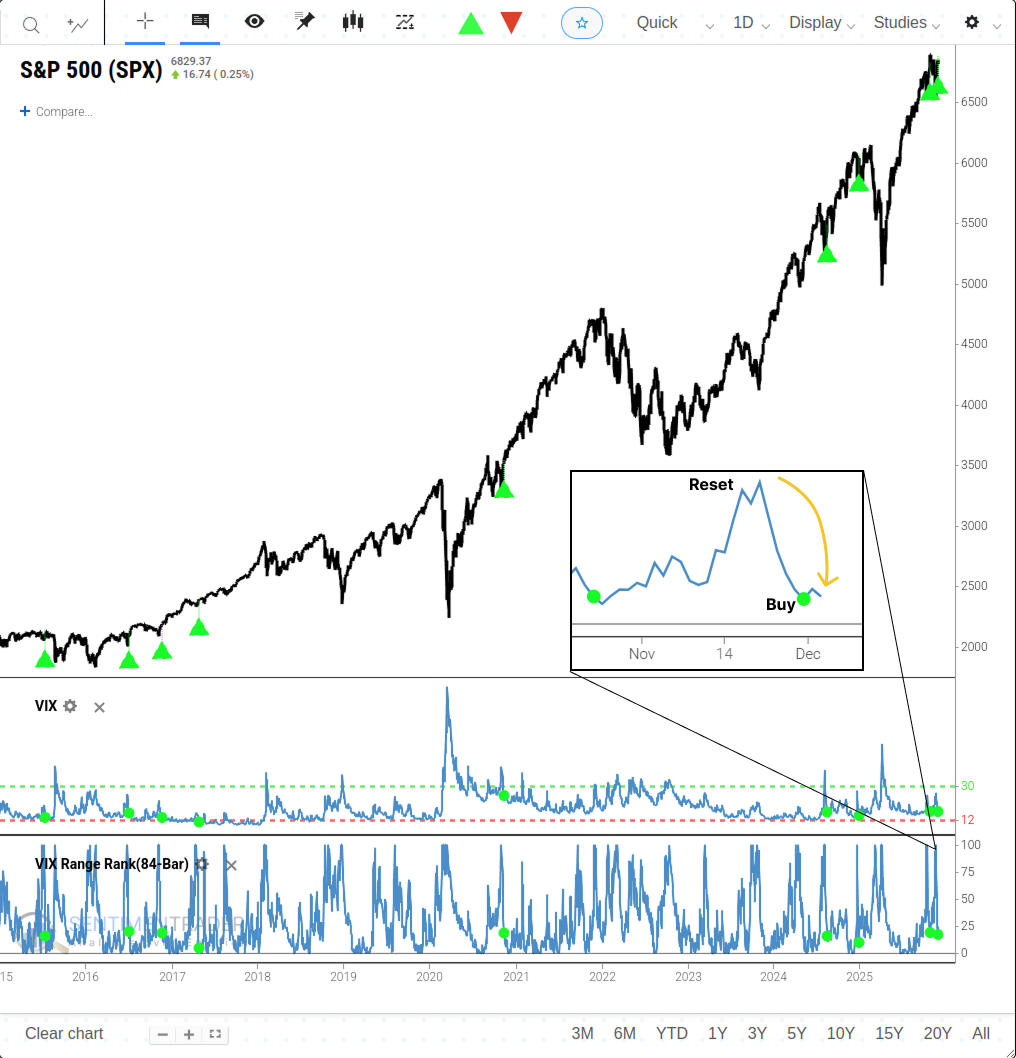
The VIX volatility index recently triggered a buy signal as fear subsided, suggesting potential for continued market strength.
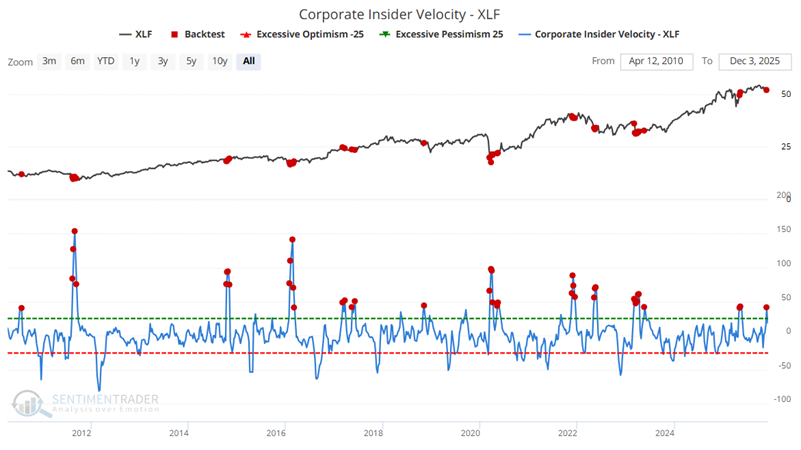
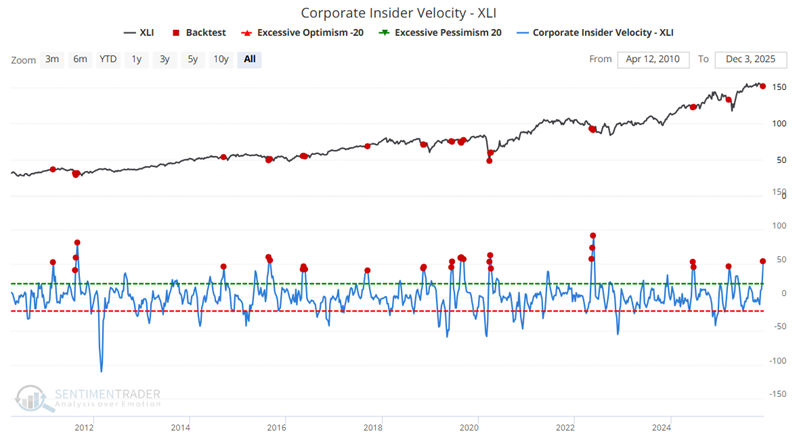
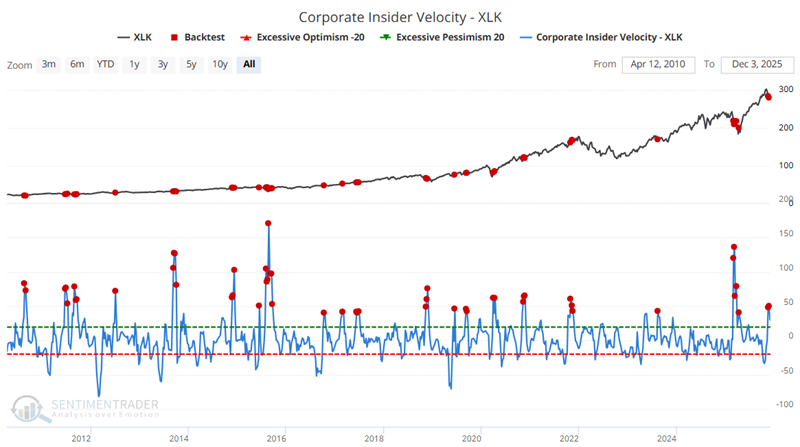
Corporate insider activity spikes across sectors
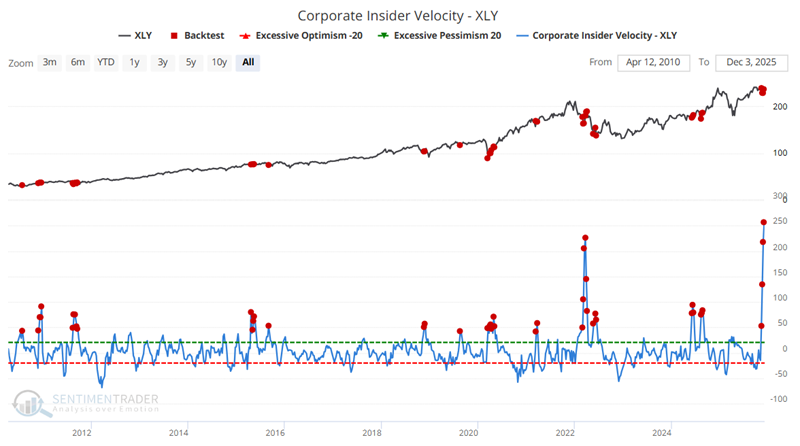
Our Corporate Insider Velocity indicator analyzes buying and selling activity by corporate insiders. The chart below highlights weeks when the indicator crossed above 24, including the recent signal on December 1st.
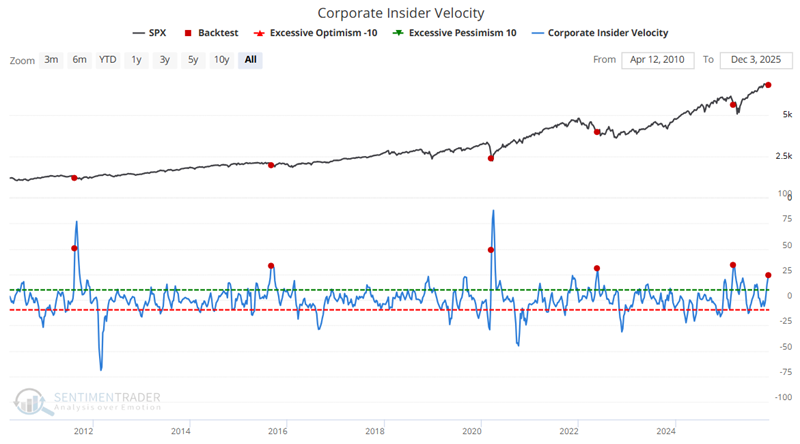
Financials (XLF), Industrials (XLI), Technology (XLK), and Consumer Discretionary (XLY) sectors all show aggressive insider buying activity in recent weeks.
Market liquidity conditions improve dramatically
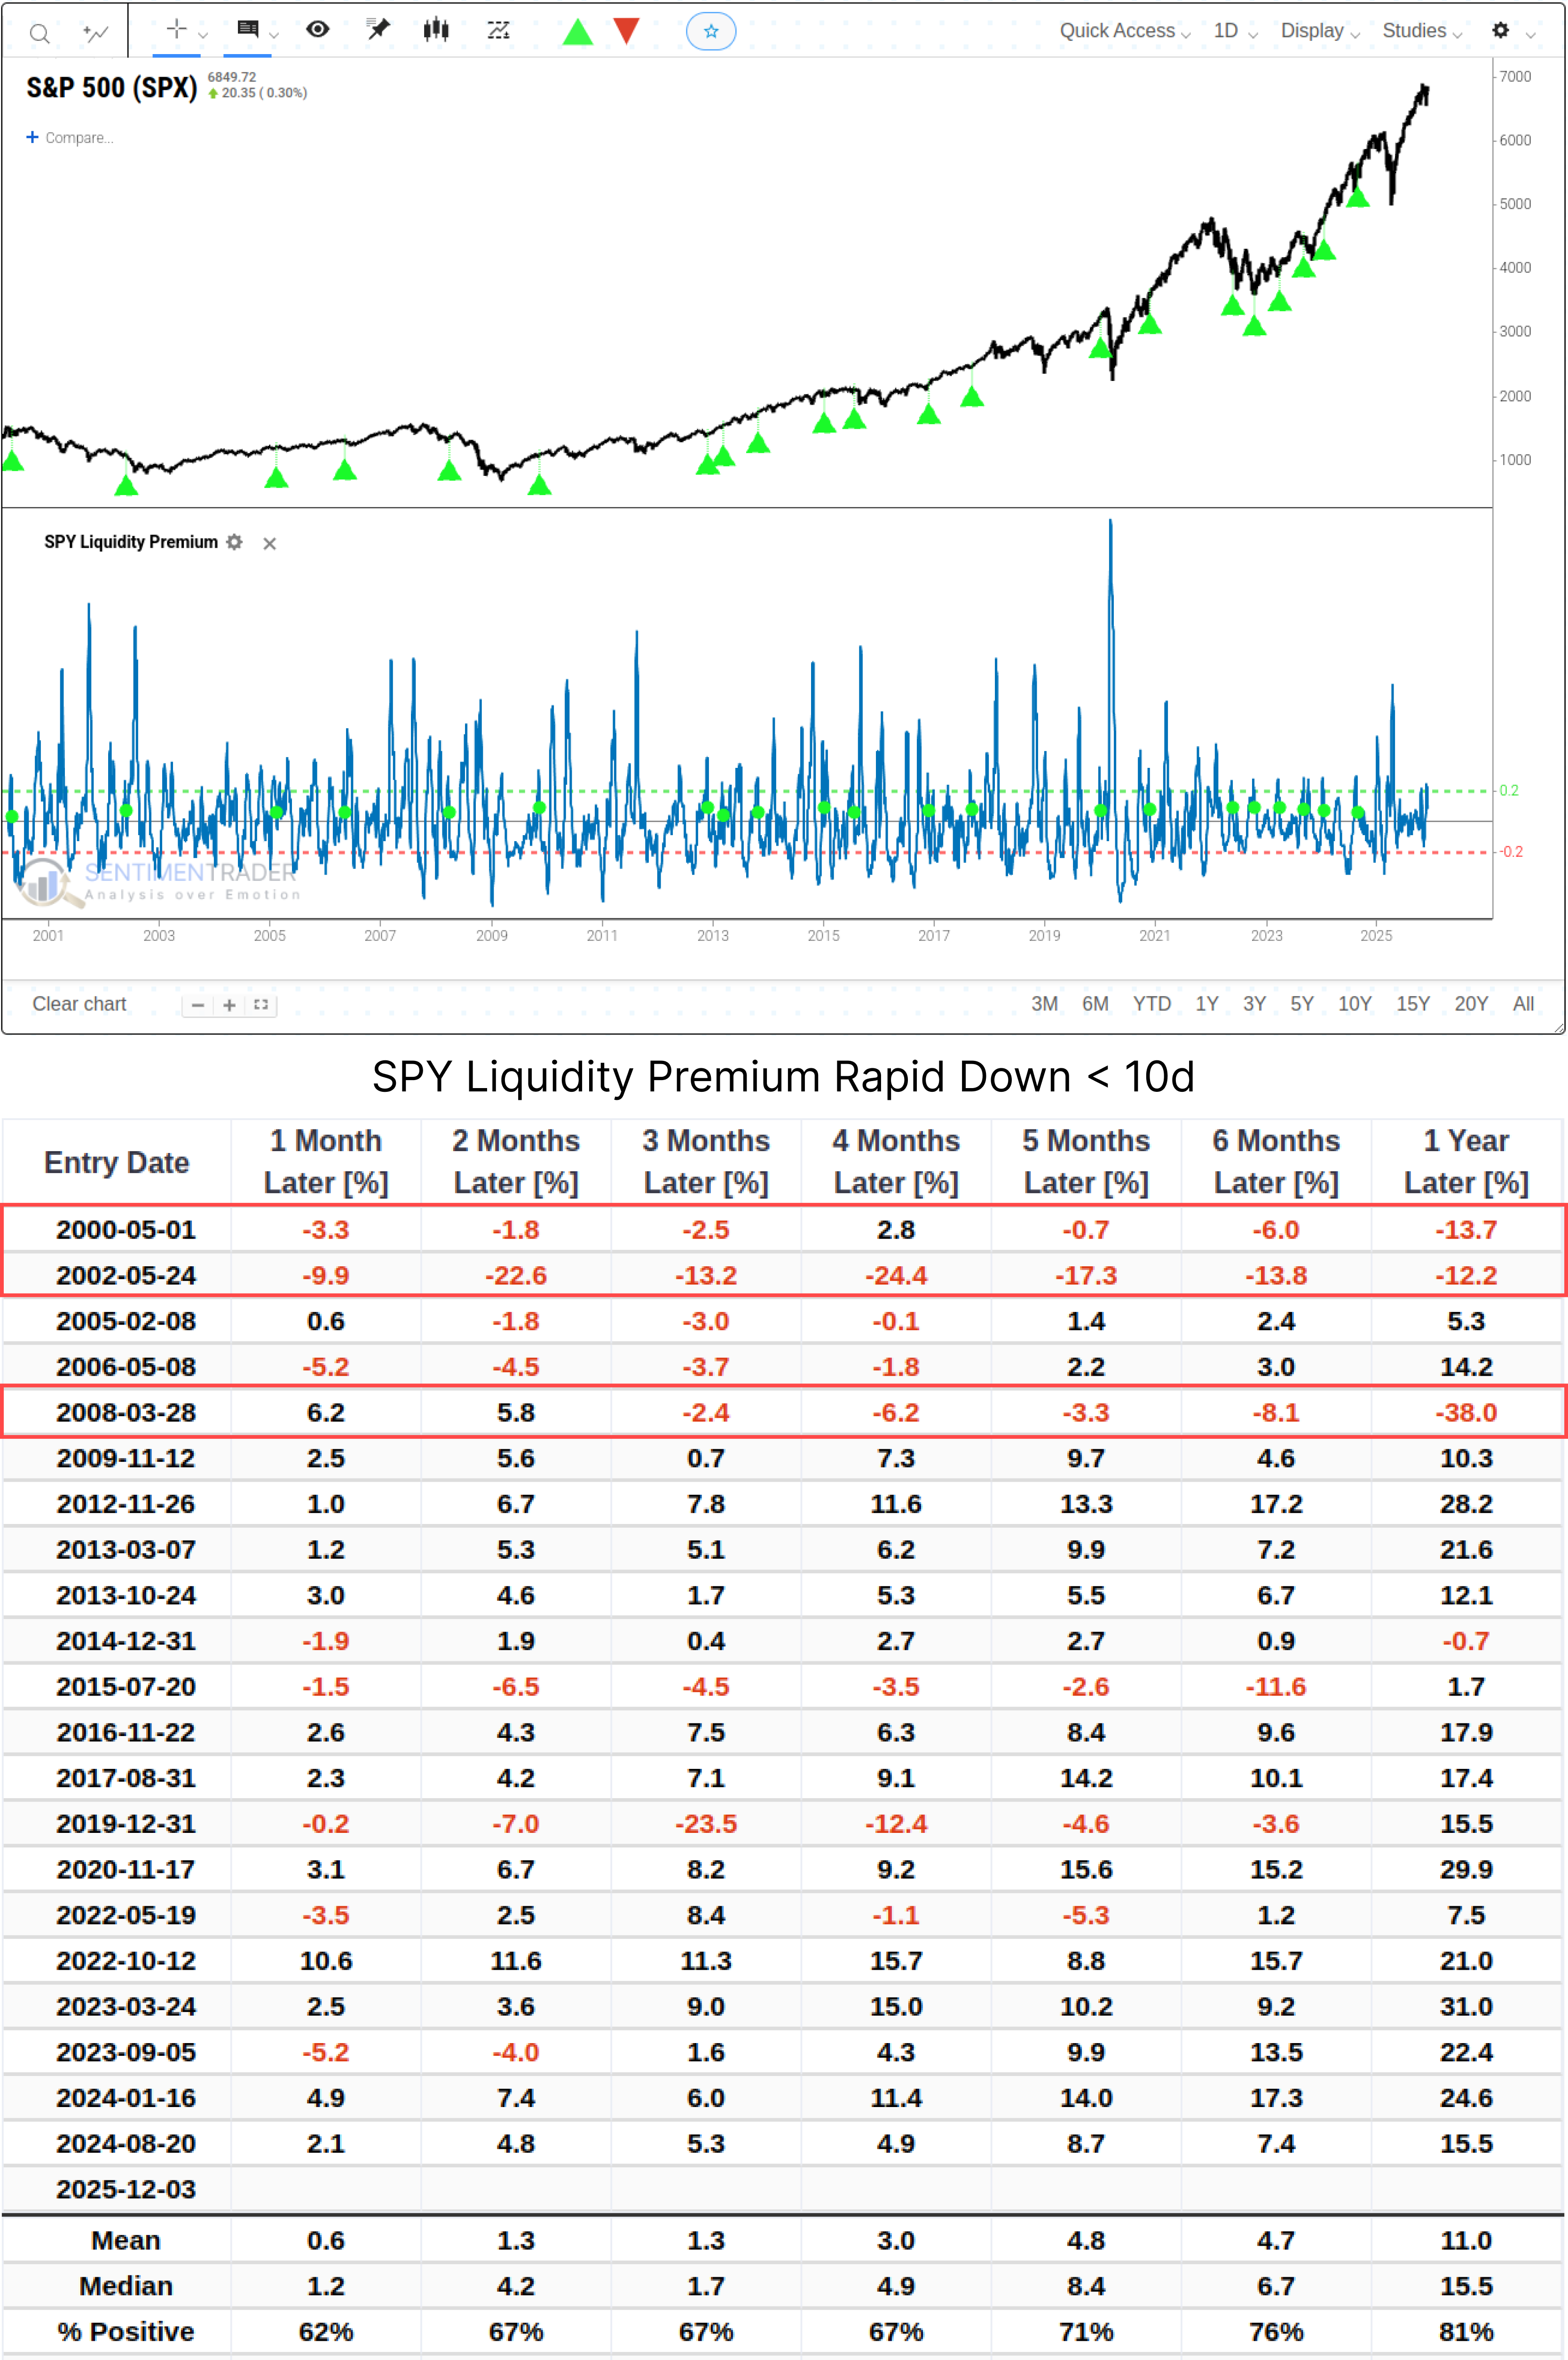
The SPY Liquidity Premium indicator quickly breached the 0.25 level during the recent pullback, then fell from above 0.25 to below 0.10 within 10 trading days.
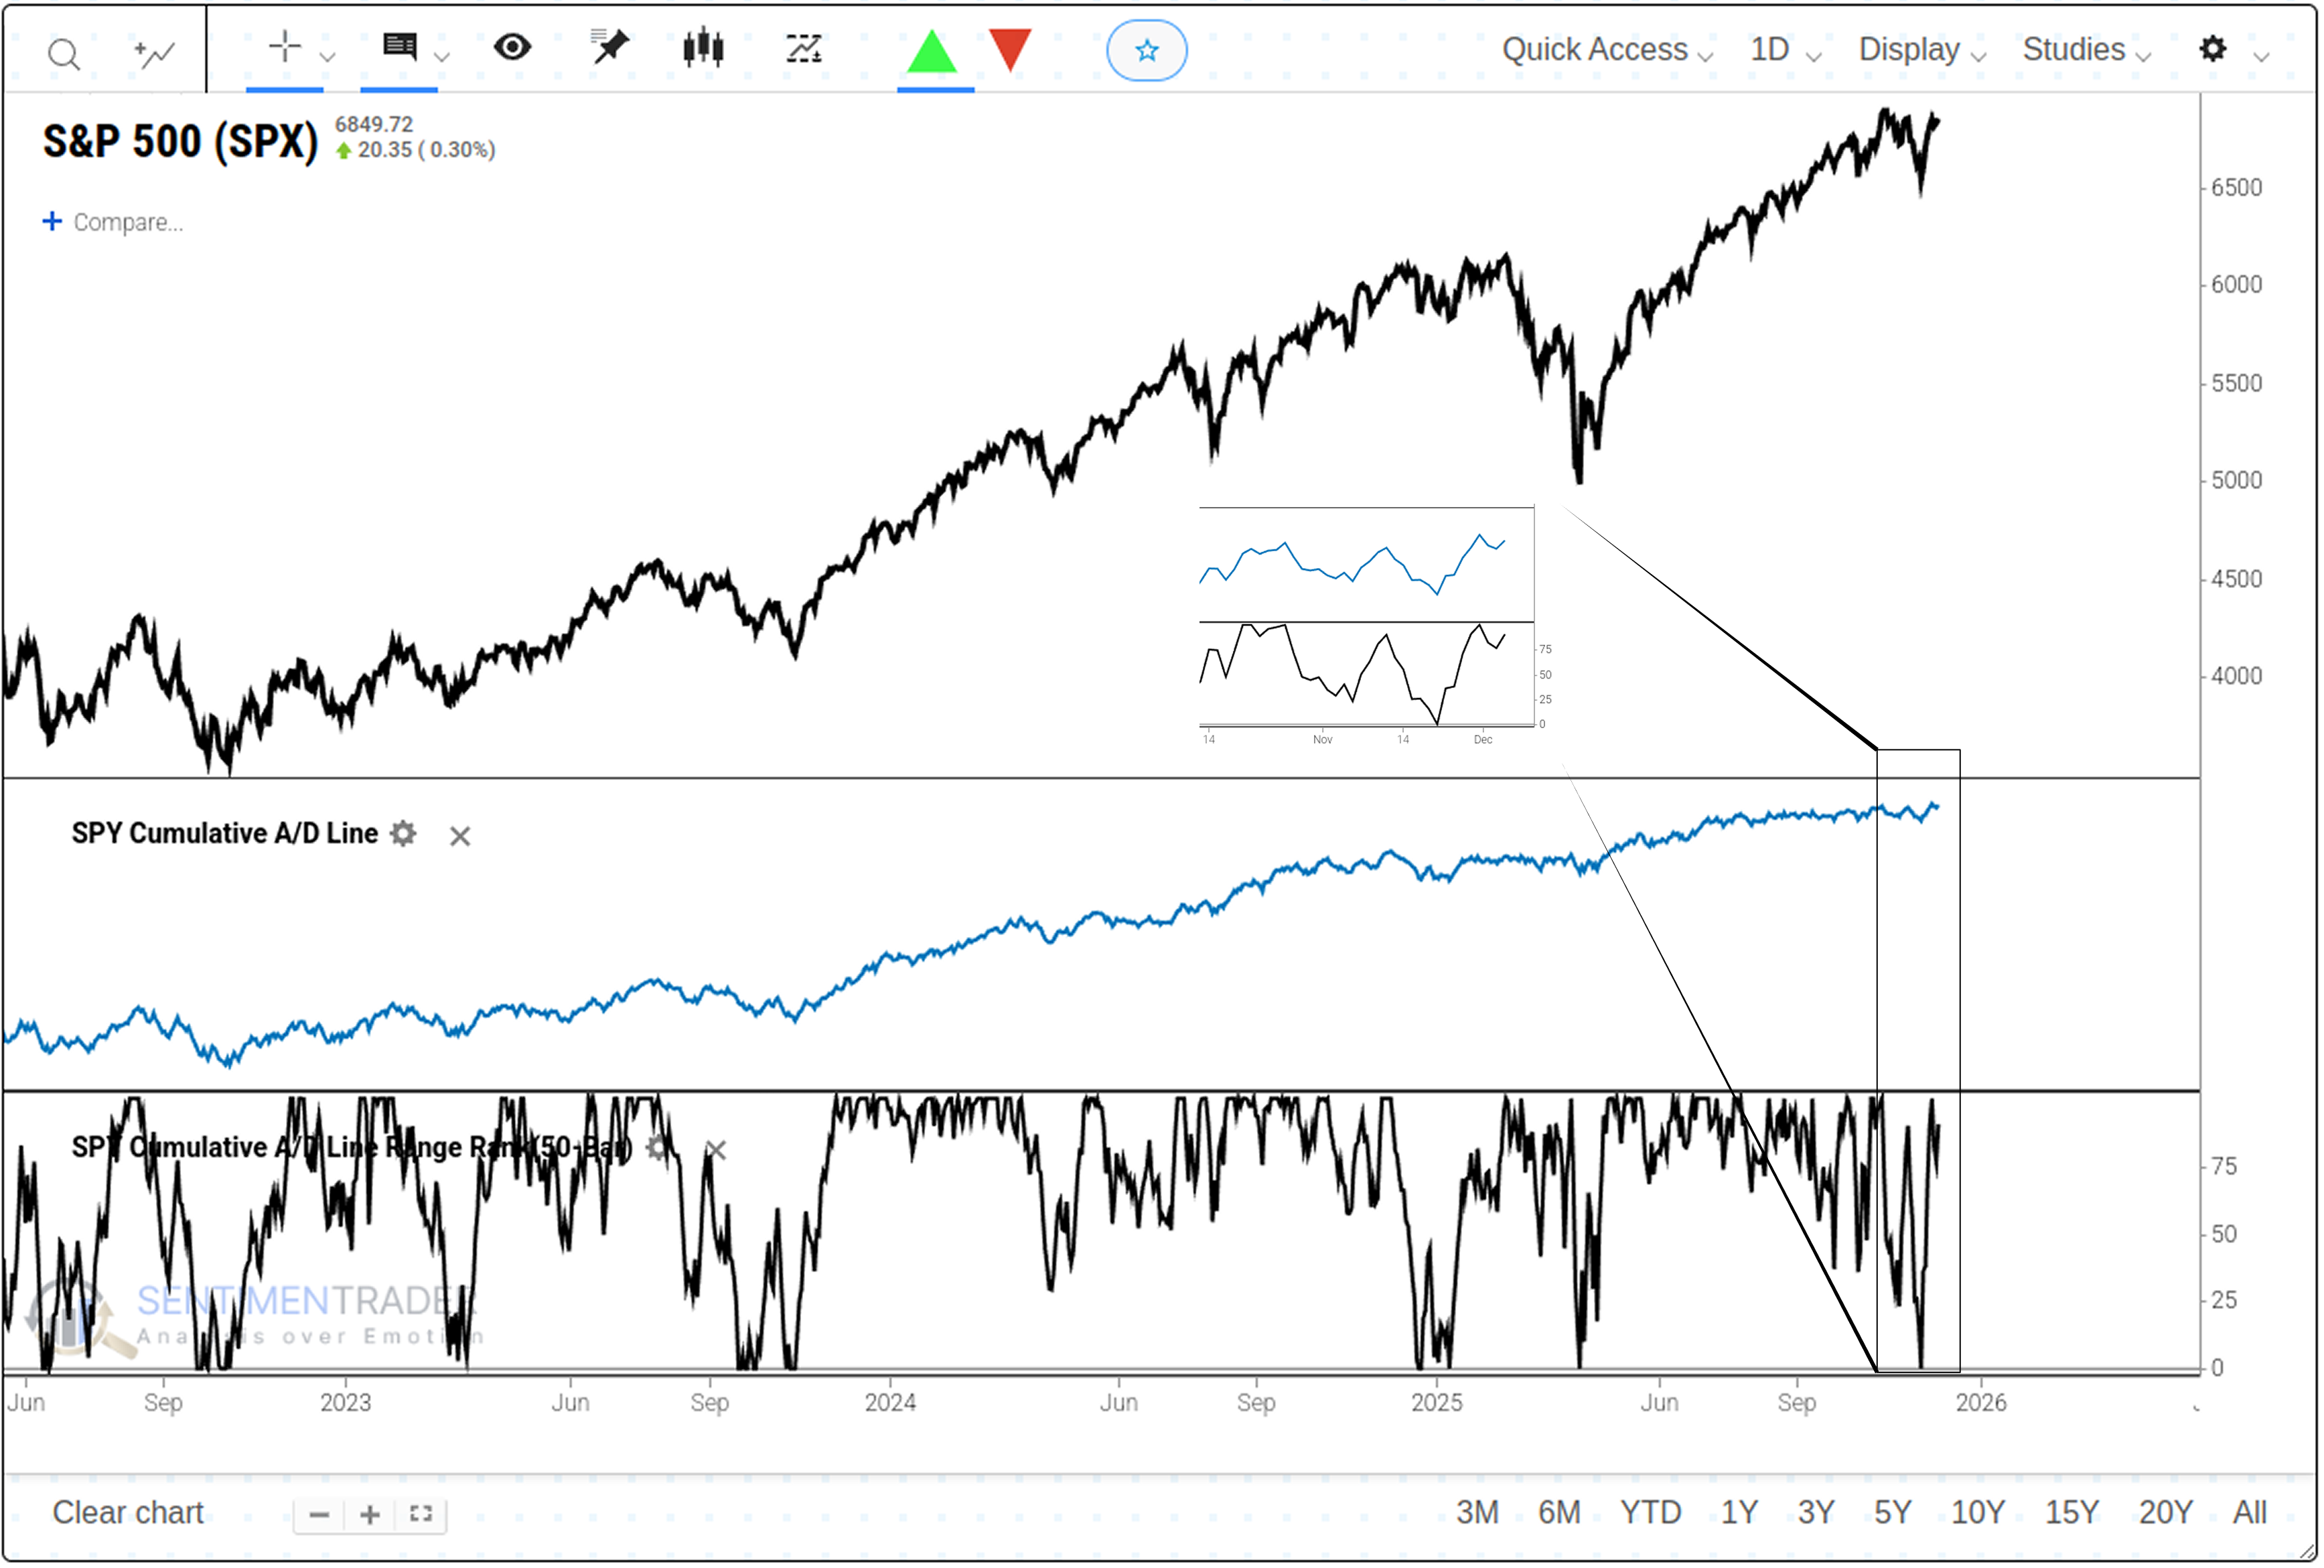
The SPY Cumulative A/D Line reversed from a 50-day low to a 50-day high in an extremely short window, indicating a shift from widespread selling to panic buying.
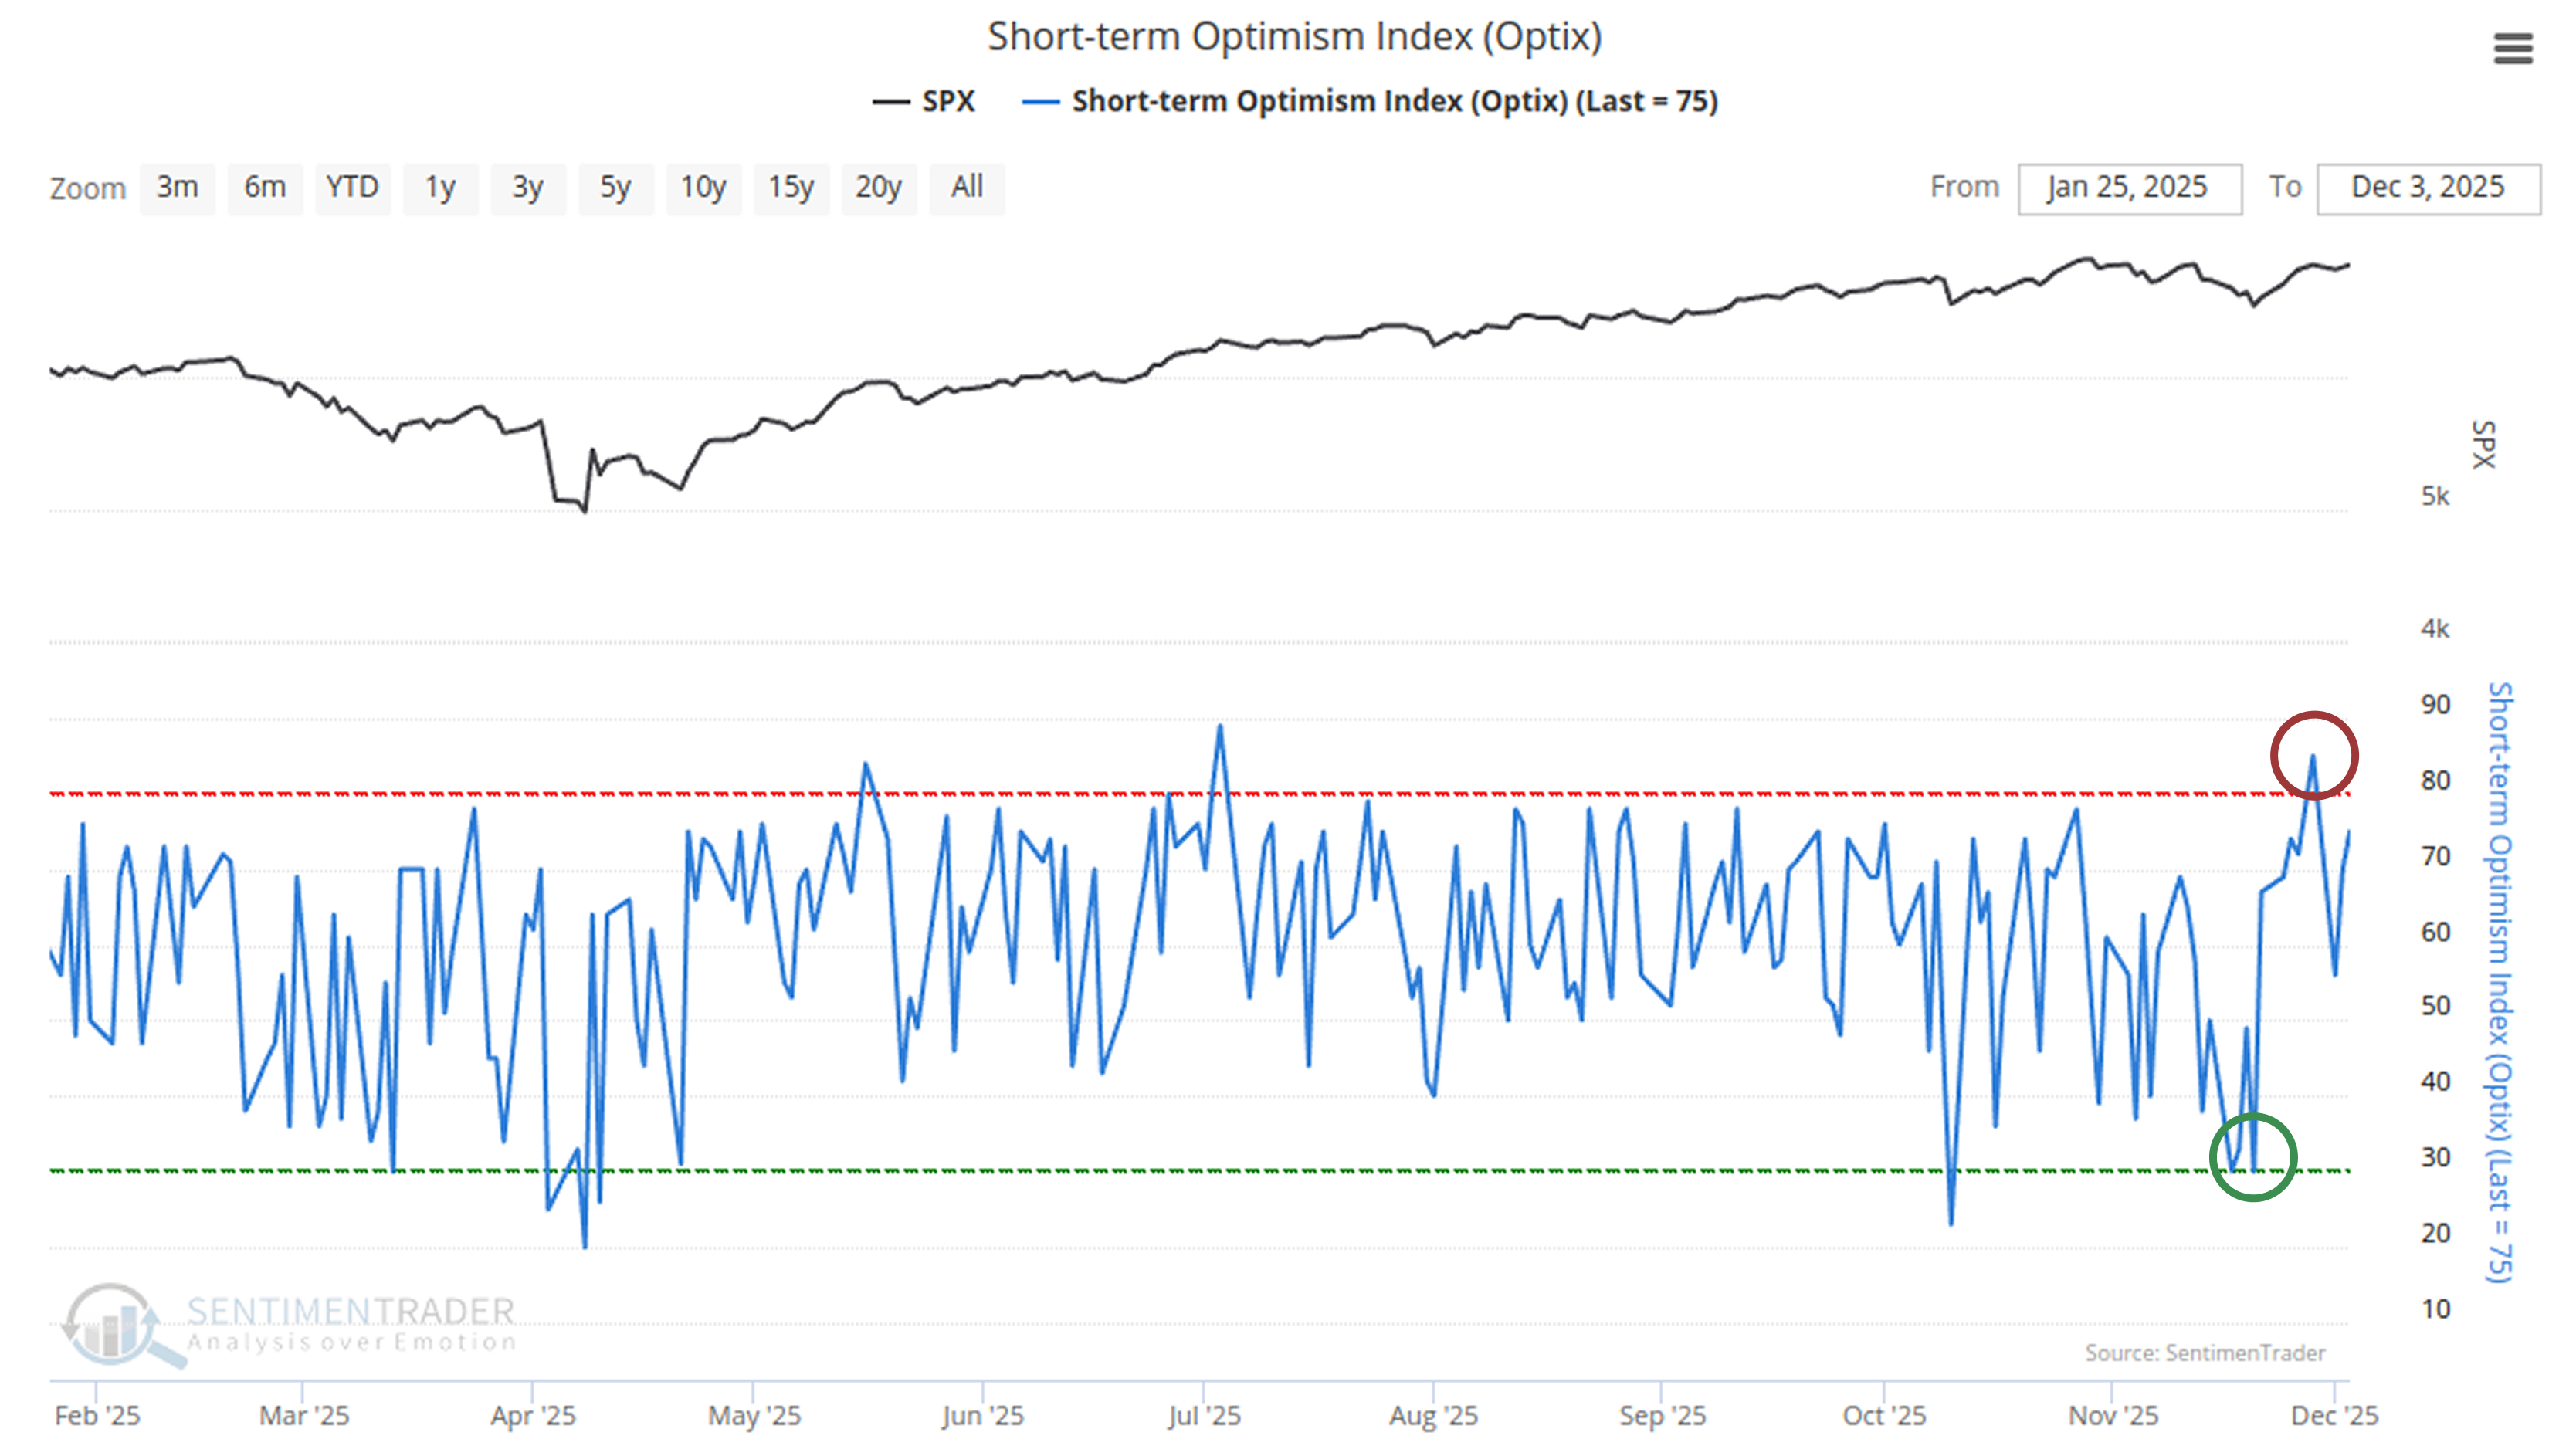
The Short-term Optimism Index (Optix) experienced a sharp whipsaw, reversing from extreme pessimism (<30.1) to extreme optimism (>80) in just 10 days.
About TradingEdge Weekly...
The goal of TradingEdge Weekly is to summarize some of the research published to SentimenTrader over the past week. Sometimes there is a lot to digest, and this summary highlights the highest conviction or most compelling ideas we discussed. This is NOT the published research; rather, it pulls out some of the most relevant parts. It includes links to the published research for convenience, and if you don't subscribe to those products, it will present the options for access.