
TradingEdge Weekly for Dec 26 - Bond volatility impact on stocks, Gold Miners rally, NAAIM Index trends, TCTM Thrust Model insights

Wishing you a season of unlimited upside and a prosperous New Year. Merry Christmas.
Key points:
- Bond MOVE Index drop signals favorable conditions for stocks
- Gold Miners rally shows signs of overheating based on breadth metrics
- NAAIM Exposure Index signals bullish trend for stocks
- TCTM Composite Thrust Model identifies powerful market surges
House view:
- Stocks:
- Short-term: Bullish. Santa Claus Rally momentum persists, with S&P 500 hitting an all-time high of 6,932.05 on 12/24. Year-end window dressing by institutions drives buying interest in winning sectors (AI, semiconductors) amid extremely low trading volume. Rate-sensitive small caps and cyclical sectors are poised to outperform. This time frame covers 1 - 4 weeks.
- Intermediate-term: Bearish. January Effect reversal risk is prominent after 2025's record gains. Elevated valuations and stretched positioning make the market vulnerable to profit-taking. Global policy divergence (Fed easing vs. BoJ tightening) add volatility risks. Historical data indicates that a strong December typically precedes a weak January, especially during extreme market conditions. However, attention should still be paid to the market's performance in the final days of this month. This time frame covers 1-5 months.
- Long-term: Bullish. The AI infrastructure cycle remains in mid-stage, validated by robust semiconductor demand (Micron's upbeat guidance). Small caps and cyclical sectors offer better value than crowded mega-caps, with room for valuation mean reversion. This time frame covers 6-12 months.
- Cyclical momentum favors semiconductors, industrials, and small-caps leveraged to rate cuts and AI hardware demand.
- Defensive sectors (utilities, consumer staples) provide stability amid January volatility, with reasonable valuations and resilience to economic slowdowns.
- Very long-term (one year+) favors undervalued small-cap growth stocks and AI supply chain segments, which are likely to outperform overcrowded tech mega-caps.
- Bonds: Long-term cycles remain bearish. Safe-haven flows and disinflationary pressures provide near-term support, but fiscal deficit concerns and global policy divergence limit sustained rallies, with no clear signs of trend reversal.
- Commodities: Extreme divergent trends dominate the market. Gold prices hit a record high, surging over 70% for the year, driven primarily by de-dollarization (central banks' gold buying spree), safe-haven demand, and expectations of accommodative Federal Reserve policy. WTI crude oil prices remained depressed due to structural oversupply and excessive geopolitical risk premiums. Commodity trend model is currently bullish for precious metals.
- Precious metals: Central bank purchases and de-dollarization provide structural support, with limited downside while the Fed maintains an accommodative stance. Short-term profit-taking may occur near resistance, but dips offer buying opportunities.
- Crude oil: Range-bound amid supply-demand tug-of-war - supply glut weighs on prices, while geopolitical supply disruptions offer intermittent support; meaningful rally requires sustained global demand recovery.
- Crypto: We follow several simple systems for bitcoin, which we consider the equivalent of the S&P 500 for crypto. Due to bitcoin's explosive growth over long periods, it's dangerous to equate neutral conditions with being bearish for some of these. However, if a system is "out," we consider it bearish for this summary.
- Triple 40: Bearish
- RSI Momentum: Bearish
- Trend and Relative Trend: Bearish
- PMI: Bearish
- M2 ROC: Bullish
- Notable Moves in Global Markets:
- Japan: Nikkei 225 firmly standing above the 50,000-point psychological level. The rally was driven by semiconductor-related stocks, mirroring the strength of U.S. tech stocks. Market sentiment was supported by expectations for the approval of a record JPY 122 trillion 2026 fiscal budget.
- Greater China: The Hang Seng Index closed at 25,818.93 points on December 24, edging up 0.17%, buoyed by the U.S. government's decision to extend the deadline for imposing tariffs on Chinese semiconductors to June 2027. SMIC rose amid market expectations of accelerated domestic supply chain substitution, yet the Hang Seng Tech Index edged up only 0.19%, reflecting lingering foreign investor concerns over prolonged geopolitical friction.
Where we're at
Most investors have the most riding on equities. We feel that the most significant determinants of success for investors are whether to adjust their allocation to that asset class based on factors that have historically had a good record of preceding above- or below-random returns in the months ahead.
Those factors include the probability of a looming recession, sentiment, price action, volatility, breadth, and the bond market. The chart below summarizes the main indicators and composite models we watch for those factors, and they're mostly in bullish regimes. Valuations are not part of these factors since the relationship has been too inconsistent on time frames under one year.
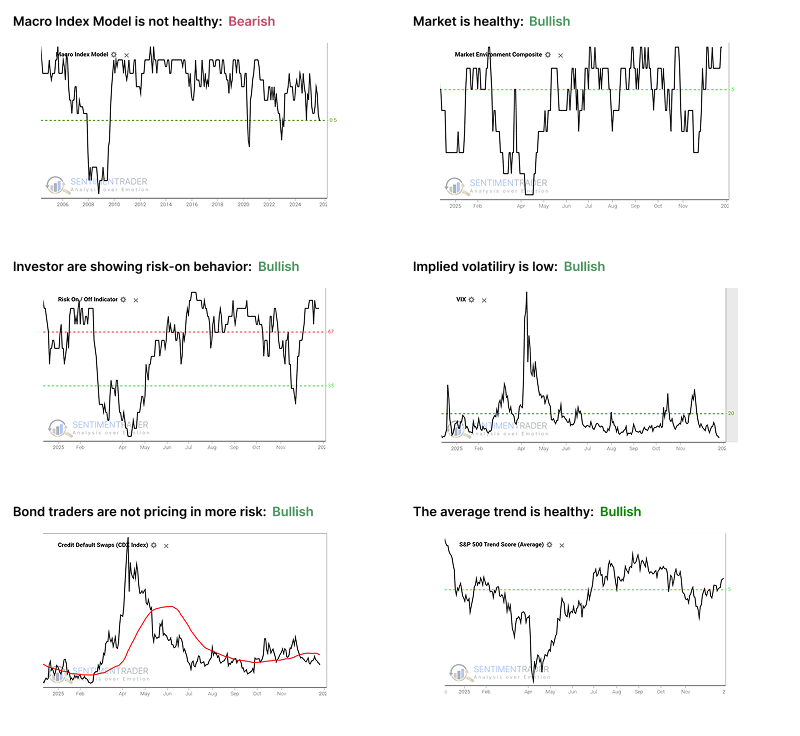
- The Macro Index Model is at or below the 50% threshold, which has proven to be a critical warning level as outlined here.
- The Market Environment has been skittish since April, but is currently healthy. Future returns, especially for higher-beta indices, has been markedly better, with less risk, when the environment is healthy as outlined here.
- The Risk On / Off Indicator shows that investors are still in risk-on mode. This has been a good sign for future returns as outlined here.
- Implied volatility remains below 20, showing a calm environment. The S&P 500 has perfomed well when this is the case as outlined here.
- Credit default swap spreads are below their 50-day moving average, which drastically improves stock returns as outlined here.
- A composite of trend measures in SPY and the average S&P 500 stock remain above 5, which show healthy trend conditions.
The Bond MOVE Index has fallen to a significant level
Merrill Lynch developed the MOVE index to measure the implied volatility of options on US Treasury markets, intended to reflect collective expectations for future volatility in the fixed-income market. It is a yield-curve weighted average of the normalized implied volatility of 30-day options on 2-year, 5-year, 10-year, and 30-year Treasuries. It is similar to the VIX for stocks that most people are familiar with, in that during periods of high uncertainty, options traders will price in wider moves, and the MOVE index will rise, suggesting some fear in the bond market. During periods of relative quiet and calm conditions, the MOVE index will decline. It's not as consistent a contrary indicator as the VIX, but it is still typically considered one.
The interesting aspect of the MOVE Index is that it has proven to be a valuable stock market indicator in certain situations. The stock market often takes its cue from the credit markets. Essentially, when turmoil arises in the bond market (i.e., a rising MOVE Index), it frequently signals potential trouble for stocks. Conversely, when there is relative calm in the bond market (i.e., a falling MOVE Index), it portends a favorable environment for stocks.
Historically, the MOVE Index has ranged from a low of 36.6 to a high of 264.6. The chart below highlights all dates when the MOVE Index was below 60.1, compared to the S&P 500 Index. The most recent signals occurred on December 18th and 19th.
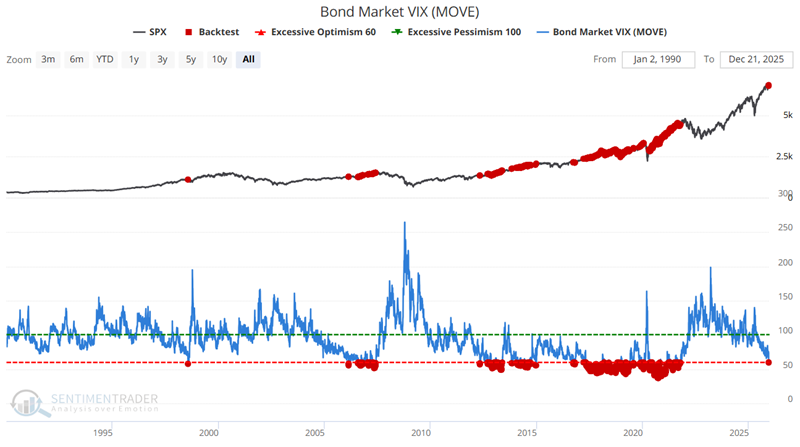
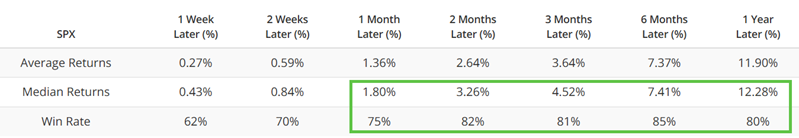
What we notice in the chart above is the tendency for these signals to occur in conjunction with a rising stock market. The table below summarizes results for all signal dates, including the many overlapping signals.
Most miners are out of correction territory
Unlike the broad stock market's consistent heat, the commodities complex presents a mixed, deflationary picture. As noted in last week's report, crude oil has plunged to multi-year lows, a trend that looks set to continue. Gold and Silver, however, are diverging from oil, benefiting from uncertainty in the global monetary system and expectations of lower real rates.
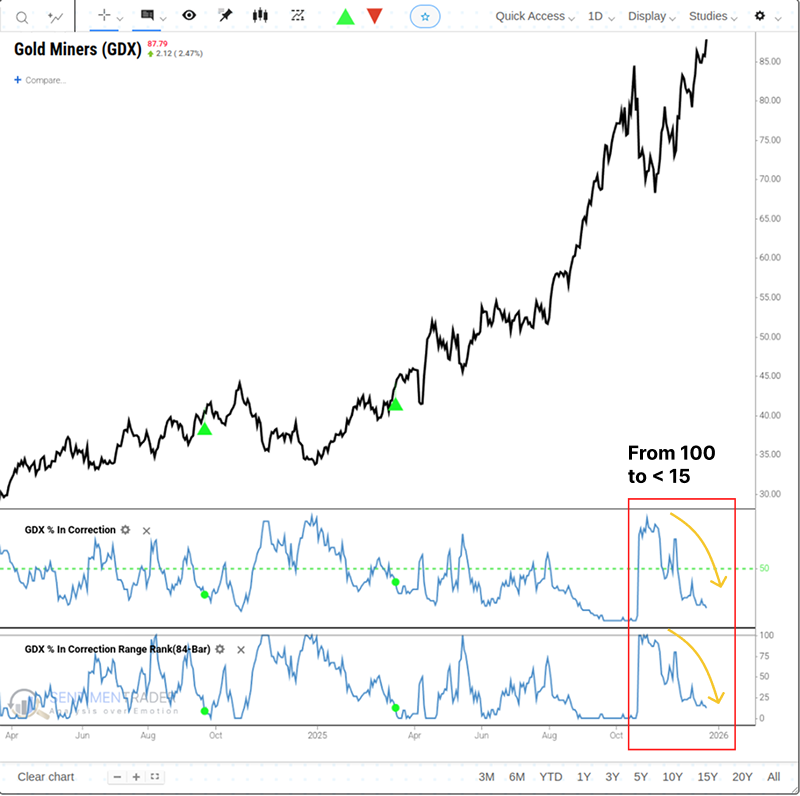
Gold Miners (GDX): The Gold Miners ETF (GDX) performed strongly, surging 2.47% last Friday to close at $87.79.
Data shows that GDX recently recorded a net inflow of approximately $420 million, increasing outstanding shares by 1.7%. This suggests that \"smart money\" is betting on an earnings breakout for miners-higher gold prices boost revenue, while falling oil prices (a key input) lower extraction costs, potentially leading to significant margin expansion.
However, for years, we have repeatedly seen that momentum in gold mining stocks tends to be extremely fleeting. Outside of rare breakaway moments, rallies are often met with heavy selling pressure.
We can see this just by looking at the last few years. Whenever fewer than 15% of mining companies are in a correction-meaning at least 85% of miners are within 10% of their 52-week highs-the GDX fund has often peaked shortly thereafter.
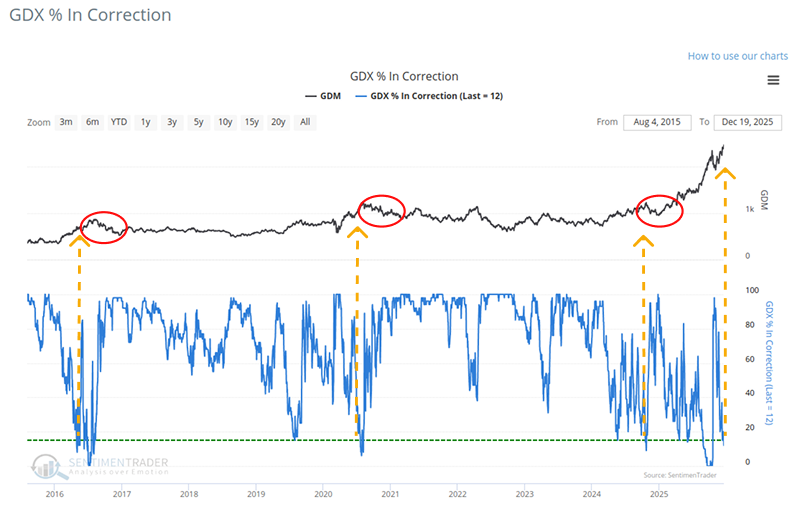
Since the raw count of times fewer than 15% of miners are in a correction is somewhat rare, we applied an 84-day range rank to the data. The GDX % In Correction 84-day range rank has recently reversed lower after hitting the top of its range. For the related backtest, click here.
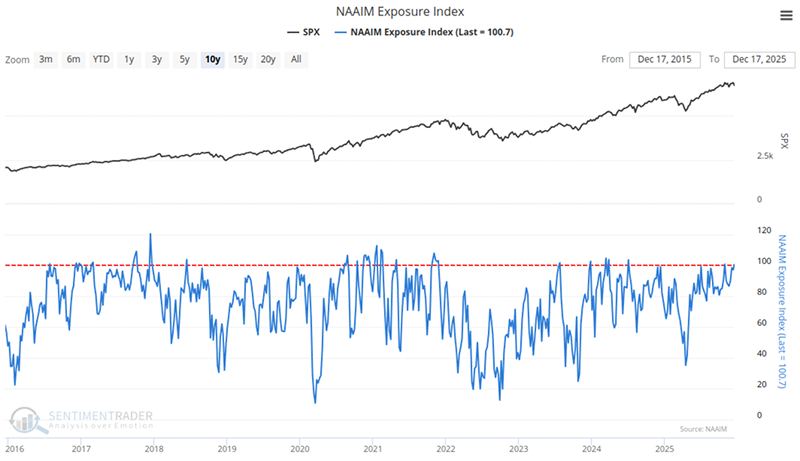
NAAIM Exposure Index at Elevated Levels
NAAIM stands for the National Association of Active Investment Managers. As the name suggests, this is a group composed of professional investors. The chart below shows the weekly readings of the NAAIM Exposure Index.
Excerpt from the National Association of Active Investment Managers website:
NAAIM member firms (all active money managers) are asked each week to provide a number representing their overall equity exposure at the close of business on a specific day (currently Wednesday). As shown below, responses from firms can vary widely. All responses are aggregated and averaged to derive the average long (or short) position of all NAAIM fund managers.
Response Range:
- 200% leveraged short
- 100% fully short
- 0% cash or hedged to market neutral
- 100% fully invested
- 200% leveraged long
Investor surveys often act as contrarian indicators because investors tend to grow more optimistic as markets rise and more pessimistic as markets fall. As we will see, the NAAIM Exposure Index typically runs counter to this trend. While even professional money managers are susceptible to the temptations of fear and greed, the investors tracked by the NAAIM Exposure Index are better at overcoming these emotions. This is reflected in the fact that, although the sample size is too small to draw any definitive conclusions, these investors often make the right calls in extreme situations.
TCTM Composite Thrust Model Components
Identifying the primary market trend is one of the most critical tasks for any trader or investor. The Tactical Composite Trend Model (TCTM) is the culmination of decades of professional trading and financial market research, designed to aid in this process. The TCTM utilizes a weight-of-the-evidence approach, combining seven key time-tested components to identify major market turning points. This report will focus on one of those key components: Sentimentrader's New TCTM (S-TCTM) Composite Thrust Model.
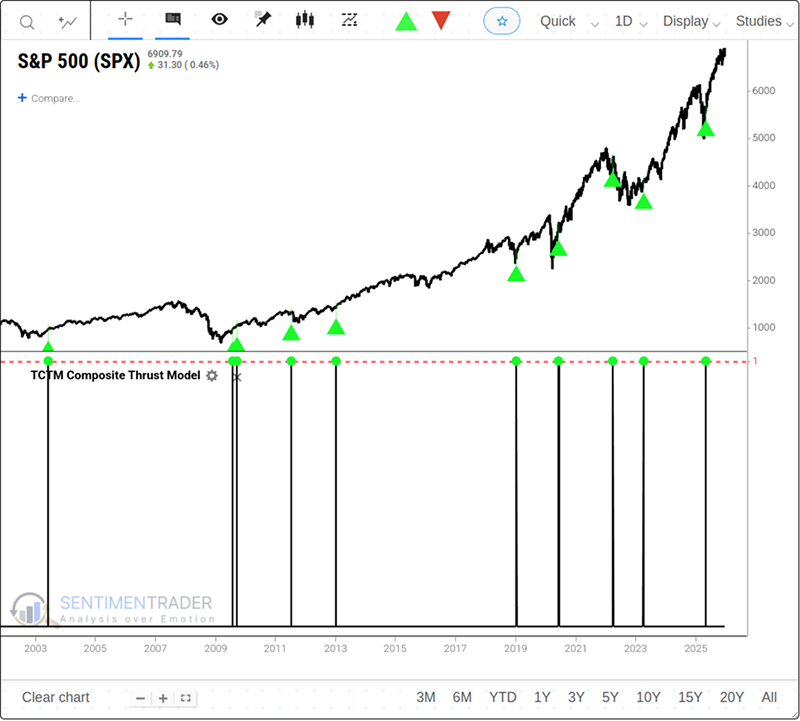
The following analysis utilizes a Composite Thrust Model that includes ten measures for identifying extreme momentum through internal and external participation.
Component Descriptions
- Rate of Change Thrust
- Breadth Thrust S&P 500
- Breadth Thrust NYSE
- Percentage of issues above the 10-day bearish to bullish reversal
- Percentage of issues above the 50-day moving average surge
- Percentage of issues at a 21-Day high surge
- Percentage of issues overbought surge
- 2/3 Vol Ratio Thrust
- 2 Day Vol Ratio Thrust
- Volume Thrust
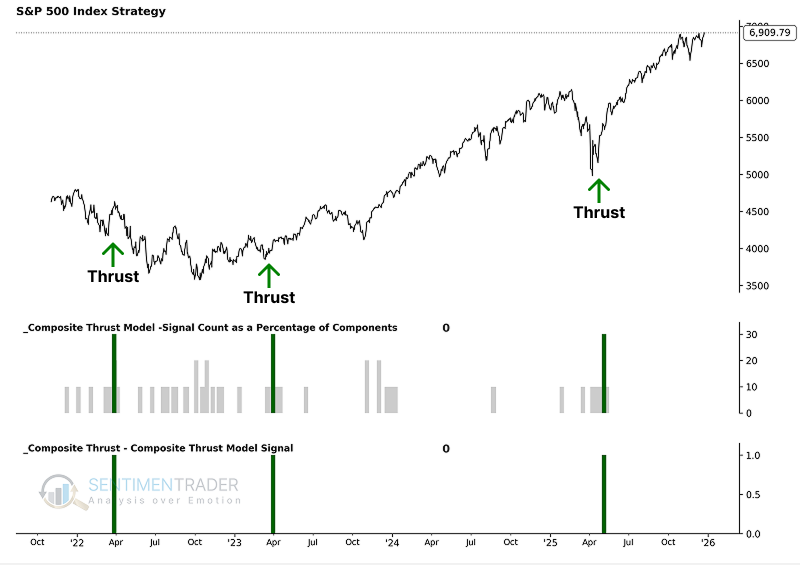
Composite Thrust Model Signal Criteria
- Condition = Composite Signal Count >= 30%.
As the chart below illustrates, these individual components are combined into a single composite indicator-the Composite Thrust Model-which uses a 0 or 1 value to issue alerts. Currently, the model shows a reading of 0, indicating no thrust signal is active.
About TradingEdge Weekly...
The goal of TradingEdge Weekly is to summarize some of the research published to SentimenTrader over the past week. Sometimes there is a lot to digest, and this summary highlights the highest conviction or most compelling ideas we discussed. This is NOT the published research; rather, it pulls out some of the most relevant parts. It includes links to the published research for convenience, and if you don't subscribe to those products, it will present the options for access.