
TradingEdge Weekly for Dec 19- Real estate bounce, bull market continuation, crude oil plunge, silver surge

Key points:
- Real estate shows seasonal strength as year-end approaches
- Bull market signals remain strong with favorable Benner cycle
- Crude oil hits multi-year lows with bearish technicals
- Silver prices surge to extreme overbought levels
House view:
- Stocks:
- Short-term: Bullish. Inflation fell more than expected, solidifying expectations of Fed "normalization cuts" in early 2026. Tech stocks rebounded sharply led by semiconductor sector. Rate-sensitive segments (small-caps, real estate) outperformed as Treasury yields declined. The rally reversed prior concerns over AI "bubble burst," with broad market breadth and risk appetite recovery driving upside. This time frame covers 1 - 4 weeks.
- Intermediate-term: No view. Soft landing narrative dominates, supported by structural disinflation and sustained AI infrastructure demand. However, global central bank policy divergence (ECB hawkish pause, BoE rate cut, BoJ hiking) creates uncertainty. Risks include potential disorderly unwinding of yen carry trades and delayed impact of government shutdown on economic data. This tug-of-war between favorable U.S. fundamentals and global policy risks offers no clear directional edge. This time frame covers 1-5 months.
- Long-term: Bullish. Structural growth drivers remain robust: U.S. economic resilience, AI infrastructure cycle, and Fed's upcoming easing cycle. Long-term breadth continues to improve across sectors, with small-caps poised to narrow valuation discount. This time frame covers 6-12 months.
- Cyclical momentum favors AI hardware, semiconductors, and small-caps - leveraged to rate cuts and digital transformation demand.
- Defensive sectors (consumer staples, healthcare) provide stability amid global policy uncertainty, with moderate upside potential.
- Very long-term (one year+) favors mean reversion to undervalued small-cap growth and AI supply chain segments, outpacing crowded mega-caps.
- Bonds: Long-term cycles remain bearish. Treasury yields experienced bull flattening post-CPI data: short-end yields declined on Fed cut expectations, while long-end yields fell to key support levels. Safe-haven flows and disinflationary pressures provide near-term support, but fiscal deficit concerns and global policy divergence limit sustained rallies, with no clear signs of trend reversal.
- Commodities: Signs point to divergent trends across sectors following Fed policy shifts and geopolitical tensions . An effective commodity trend model is currently bullish for precious metals. Gold trades near all-time highs, supported by falling Treasury yields, geopolitical risk hedging, and de-dollarization-driven central bank purchases. Oil faces headwinds from global supply glut and weak industrial demand, though geopolitical tensions have revived risk premiums, limiting downside.
- Precious metals: Maintain long-term uptrend, with lower opportunity cost (Fed easing) and structural central bank demand providing a price floor, despite short-term profit-taking at record levels.
- Crude oil: Range-bound amid supply-demand tug-of-war - supply glut weighs on prices, while geopolitical supply disruptions offer intermittent support; meaningful rally requires sustained global demand recovery.
- Crypto: We follow several simple systems for bitcoin, which we consider the equivalent of the S&P 500 for crypto. Due to bitcoin's explosive growth over long periods, it's dangerous to equate neutral conditions with being bearish for some of these. However, if a system is "out," we consider it bearish for this summary.
- Triple 40: Bearish
- RSI Momentum: Bearish
- Trend and Relative Trend: Bearish
- PMI: Bearish
- M2 ROC: Bullish
- Notable Moves in Global Markets:
- Europe (STOXX 600, DAX, FTSE 100): Broadly higher - ECB maintained rates (hawkish pause) and?? growth/inflation forecasts, easing recession fears; BoE cut rates by 25bps to support weak growth, boosting FTSE 100 via sterling depreciation. Industrial and tech stocks benefited from U.S. market sentiment spillover.
- Japan (Nikkei 225): The Bank of Japan (BoJ) raised its policy interest rate by 25 basis points as expected at its December 19 meeting, increasing the rate from 0.5% to 0.75%-the highest level since 1995. Markets reacted with a classic "buy the rumor, sell the fact" scenario.
- Greater China (Hang Seng, Shanghai Composite): Modestly higher, supported by expectations of accommodative monetary/fiscal policies. Hong Kong tech stocks showed resilience amid global volatility, while mainland markets benefited from domestic stimulus prospects. Valuation discount continues to attract defensive capital.
Where we're at
Most investors have the most riding on equities. We feel that the most significant determinants of success for investors are whether to adjust their allocation to that asset class based on factors that have historically had a good record of preceding above- or below-random returns in the months ahead.
Those factors include the probability of a looming recession, sentiment, price action, volatility, breadth, and the bond market. The chart below summarizes the main indicators and composite models we watch for those factors, and they're mostly in bullish regimes. Valuations are not part of these factors since the relationship has been too inconsistent on time frames under one year.
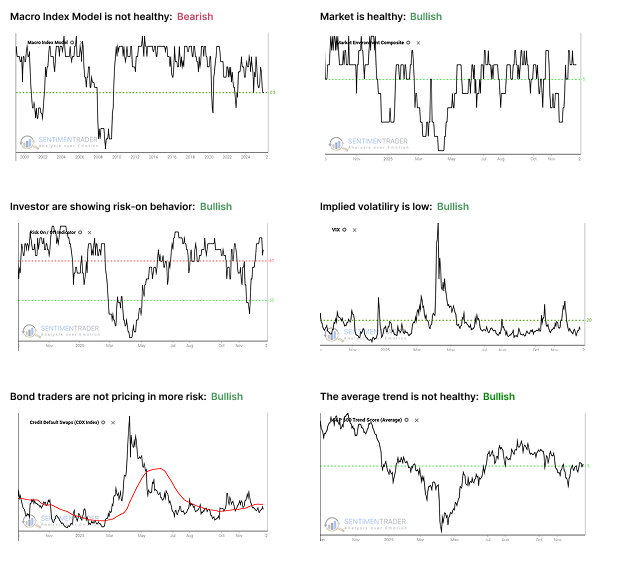
- The Macro Index Model is at or below the 50% threshold, which has proven to be a critical warning level as outlined here.
- The Market Environment has been skittish since April, but is currently healthy. Future returns, especially for higher-beta indices, has been markedly better, with less risk, when the environment is healthy as outlined here.
- The Risk On / Off Indicator shows that investors are still in risk-on mode. This has been a good sign for future returns as outlined here.
- Implied volatility remains below 20, showing a calm environment. The S&P 500 has perfomed well when this is the case as outlined here.
- Credit default swap spreads are below their 50-day moving average, which drastically improves stock returns as outlined here.
- A composite of trend measures in SPY and the average S&P 500 stock remain above 5, which show healthy trend conditions.
Since April, the most compelling studies have had a strongly bullish bias on longer time frames. You can follow these through the Active Studies page. From time to time, when the analysts' studies provide an overwhelming message, it will override the charts above, but there has been no consensus in the studies to suggest overriding the bullish environment.
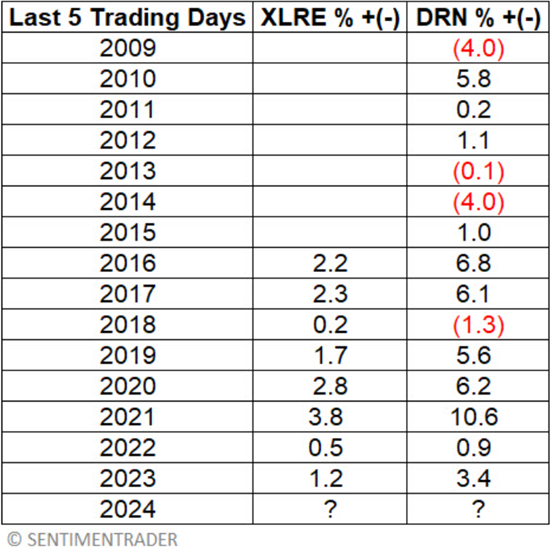
Real Estate Shows Seasonal Strength
Of the 11 S&P 500 sectors, the real estate sector has been the top performer during the last five trading days of the year. Consistency and downside risk are vital considerations that we will examine.
For our test, we will use index data going back to 1927. Before 1990, we used the Fama-French real estate sector data series. Starting in 1990, we used the S&P 500 Real Estate sector data series.
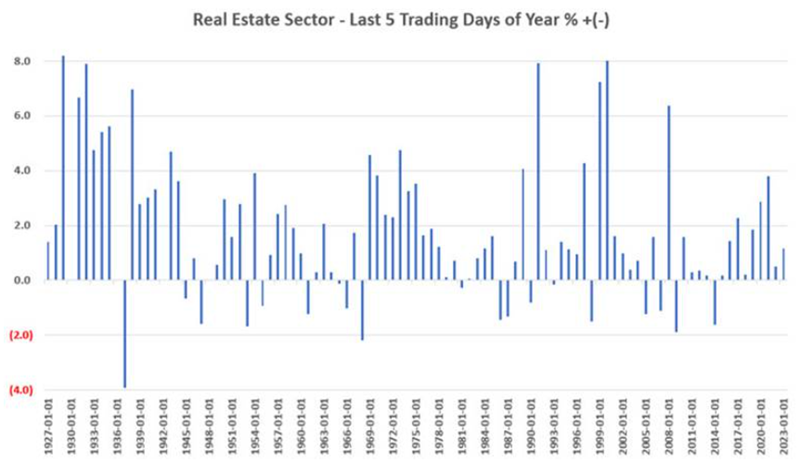
The most straightforward way to capitalize on this trend is to purchase shares of an ETF. The Real Estate Select Sector SPDR Fund (XLRE) tracks the S&P 500 Real Estate Sector Index.
Bull Market Signals Remain Strong
The Benner Cycle, created by Samuel Benner in 1875, consists of major cycles and minor cycles. The chart below was purportedly created by Samuel Benner in 1875.
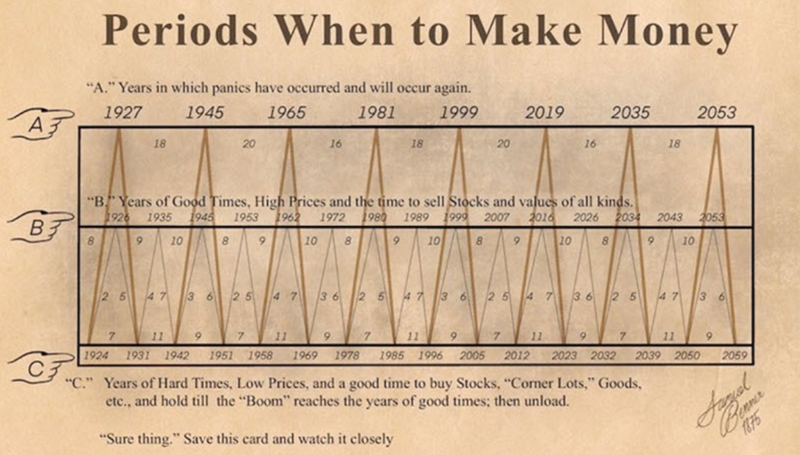
The next minor cycle favorable period begins on December 31, 2023, and extends through December 31, 2026.
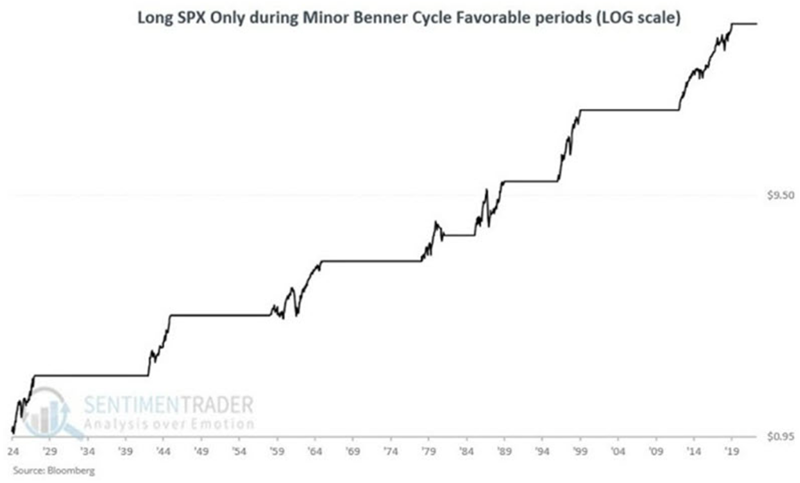
UPDATE NOTE: As this is written, since 2023-12-31:
- The S&P 500 has gained 44%, so another substantial gain would be required in 2026 to get the overall result up to the Average of 68.1% in the previous cycle
- The maximum % drawdown from the entry price on 2023-12-31 is -1.7%
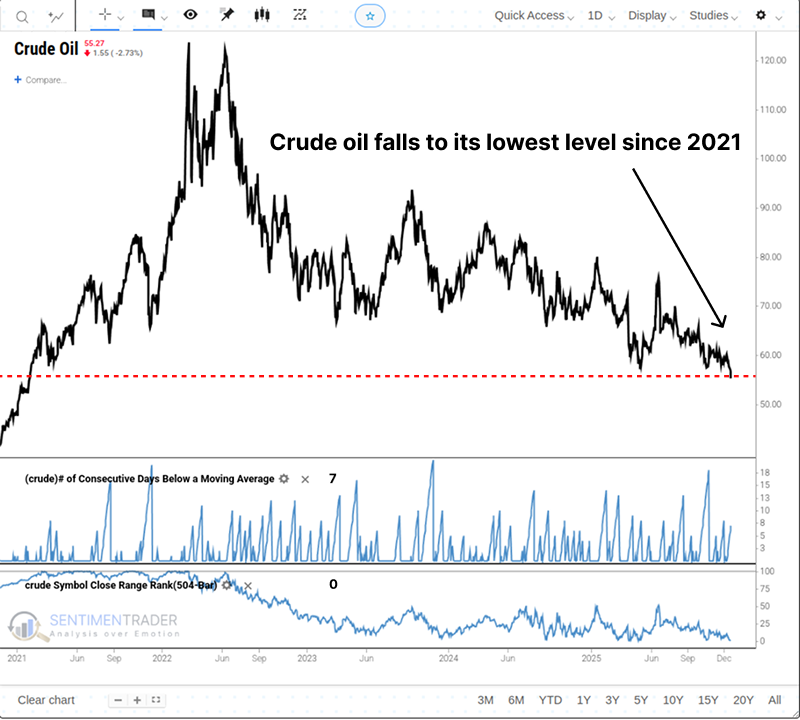
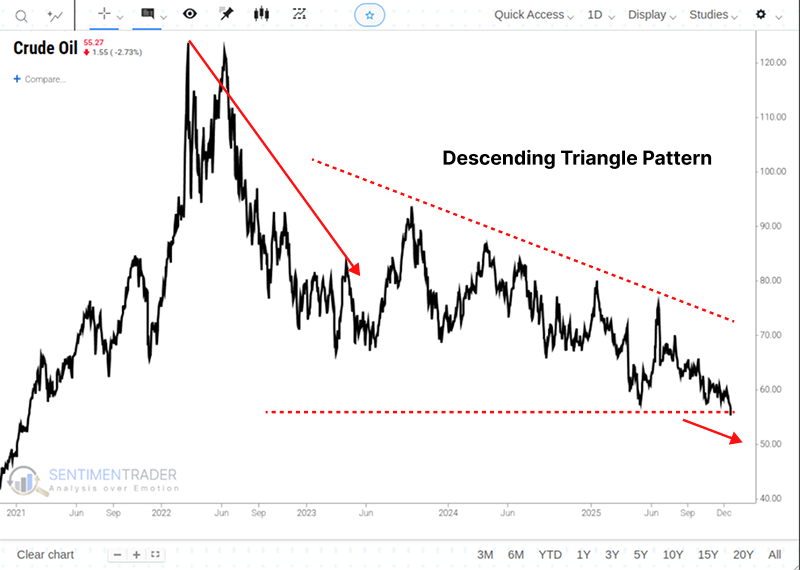
Crude Oil Hits Multi-Year Lows
Crude oil, a key commodity influencing the global economic trajectory, fell to its lowest point since 2021. Previously, crude prices attempted a rally, but that momentum stalled.
From a technical analysis perspective, the price pattern in crude oil resembles a descending triangle, a continuation formation that often resolves in the direction of the previous trend-which has been downward since oil's peak in 2022.
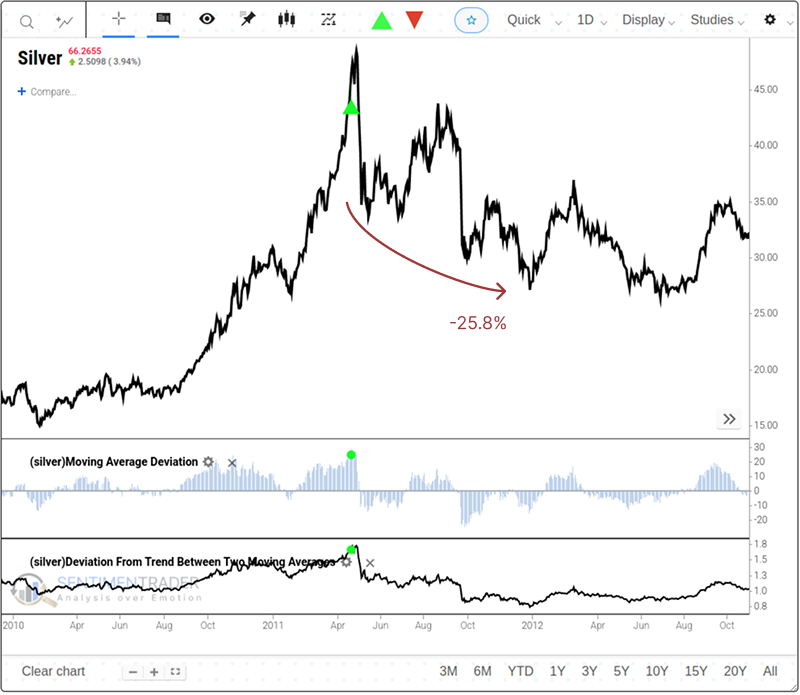
Silver Prices Surge to Extreme Levels
Silver prices have broken through their moving averages extremely sharply while hitting multi-year highs.
Silver prices have set new highs - a rarity over the past few decades - and currently traded more than 24% above the 50-day moving average and over 60% above the 200-day moving average. This level of deviation is historic.
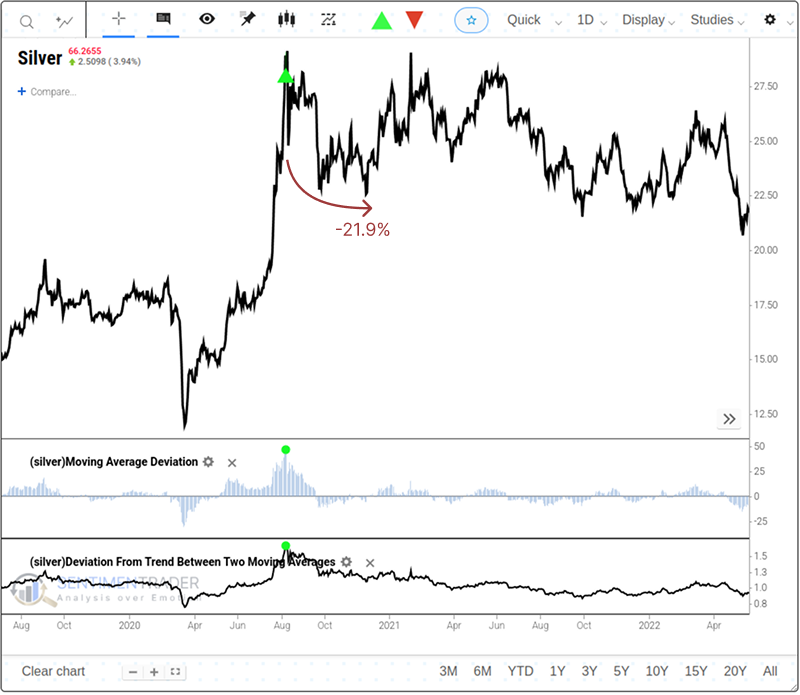
The last time such extreme conditions occurred was in April 2011, after which prices plummeted by a maximum of -25.8% in the following months and remained deeply in the red a year later (-29.6%).
About TradingEdge Weekly...
The goal of TradingEdge Weekly is to summarize some of the research published to SentimenTrader over the past week. Sometimes there is a lot to digest, and this summary highlights the highest conviction or most compelling ideas we discussed. This is NOT the published research; rather, it pulls out some of the most relevant parts. It includes links to the published research for convenience, and if you don't subscribe to those products, it will present the options for access.