
TradingEdge Weekly for Dec 12 - Gold Miners Santa Claus Rally, Risk On/Off indicator, Sentimentrader's TCTM, Capitulation in Utilities

Key points:
The Santa Claus Gold Miner Rally period is approaching, historically showing consistent gains for gold-related stocks.
The Risk On/Off Indicator has shifted to a 'risk-on' status, suggesting improved market internal health.
The Sentimentrader's TCTM Composite Recession Model currently shows no recession warning signal.
Utilities sector breadth has collapsed, but historical data suggests this is not a bad omen for the broader market.
House view:
- Stocks:
- Short-term: Modestly bullish. Fed's 25bps rate cut and Reserve Management Program (RMP) boosted market liquidity, driving capital rotation from crowded AI hardware stocks to value, financials and small-caps (Russell 2000 outperformed notably). Oracle's earnings-triggered tech selloff created short-term volatility, but broad market breadth and rate-cut optimism underpinned modest upside for the broader index. This time frame covers 1 - 4 weeks.
- Intermediate-term: No view. Fed's hawkish Dot Plot (implying only one 2026 rate cut) clashed with market pricing for deeper easing, amid "data fog" from delayed economic reports due to government shutdown. AI infrastructure Capex ROI concerns offset rate-cut benefits, creating a tug-of-war between soft landing optimism and stagflation risks with no clear directional edge for the market. This time frame covers 1-5 months.
- Long-term: Bullish. Structural growth drivers remain intact: US economic resilience (labor market stability, consumer spending durability), AI's shift from hardware buildout to application monetization, and valuation mean reversion for small-caps support sustained long-term gains across most equity indices. This time frame covers 6-12 months.
- Cyclical momentum favors financials, industrials and small-caps - leveraged to rate cuts and economic normalization
- Defensive sectors (consumer staples, healthcare) offer resilience amid data uncertainty and inflation stickiness
- Very long-term (one year+) favors value over growth, with focus on AI application-focused tech and undervalued small-caps
- Bonds: Long-term cycles remain bearish. Treasury curve saw bull steepening post-Fed meeting: short-end yields fell on rate cut and RMP announcements. Despite near-term relief from safe-haven flows and liquidity support, sticky core inflation and fiscal deficit concerns limit sustained rallies, with no clear trend reversal signals emerging.
- Commodities: Signs point to divergent trends across sectors following Fed policy shifts and geopolitical tensions. An effective commodity trend model is currently bullish for precious metals. Gold remains resilient at record highs, supported by rate cut expectations and central bank buying, despite short-term profit-taking. Oil faces headwinds from weak global demand that outweigh geopolitical risk premiums, with speculators' extreme short bets creating potential for tactical rallies.
- Precious metals: Maintain long-term uptrend, supported by lower opportunity cost (Fed rate cuts) and central bank reserve diversification demand, with physical demand in key consumer markets providing a price floor.
- Crude oil: Trades in a narrow range amid weak global demand, with OPEC+ production policy adjustments offering limited support; downside risks persist unless global manufacturing activity rebounds.
- Crypto: We follow several simple systems for bitcoin, which we consider the equivalent of the S&P 500 for crypto. Due to bitcoin's explosive growth over long periods, it's dangerous to equate neutral conditions with being bearish for some of these. However, if a system is "out," we consider it bearish for this summary.
- Triple 40: Bearish
- RSI Momentum: Bearish
- Trend and Relative Trend: Bearish
- PMI: Bearish
- M2 ROC: Bullish
- Notable Moves in Global Markets:
- Europe (STOXX 600): Rallied on Fed rate-cut spillover, with industrial stocks (Siemens, BASF) leading gains; the region's valuation discount to US equities attracted global capital inflows.
- Japan (Nikkei 225): Declined amid market anxiety over BoJ's imminent rate hike (90% probability of a Dec 19 hike to 0.75%), with yen appreciation pressuring export-oriented stocks and SoftBank falling on global tech valuation pullback.
- Greater China (Hang Seng & Mainland A-shares): Mixed performance - HKMA's 25bps rate cut boosted Hong Kong's property and utility stocks, while mainland markets faced headwinds from weak domestic demand despite iron ore's policy-driven rebound.
Where we're at
Most investors have the most riding on equities. We feel that the most significant determinants of success for investors are whether to adjust their allocation to that asset class based on factors that have historically had a good record of preceding above- or below-random returns in the months ahead.
Those factors include the probability of a looming recession, sentiment, price action, volatility, breadth, and the bond market. The chart below summarizes the main indicators and composite models we watch for those factors, and they're mostly in bullish regimes. Valuations are not part of these factors since the relationship has been too inconsistent on time frames under one year.
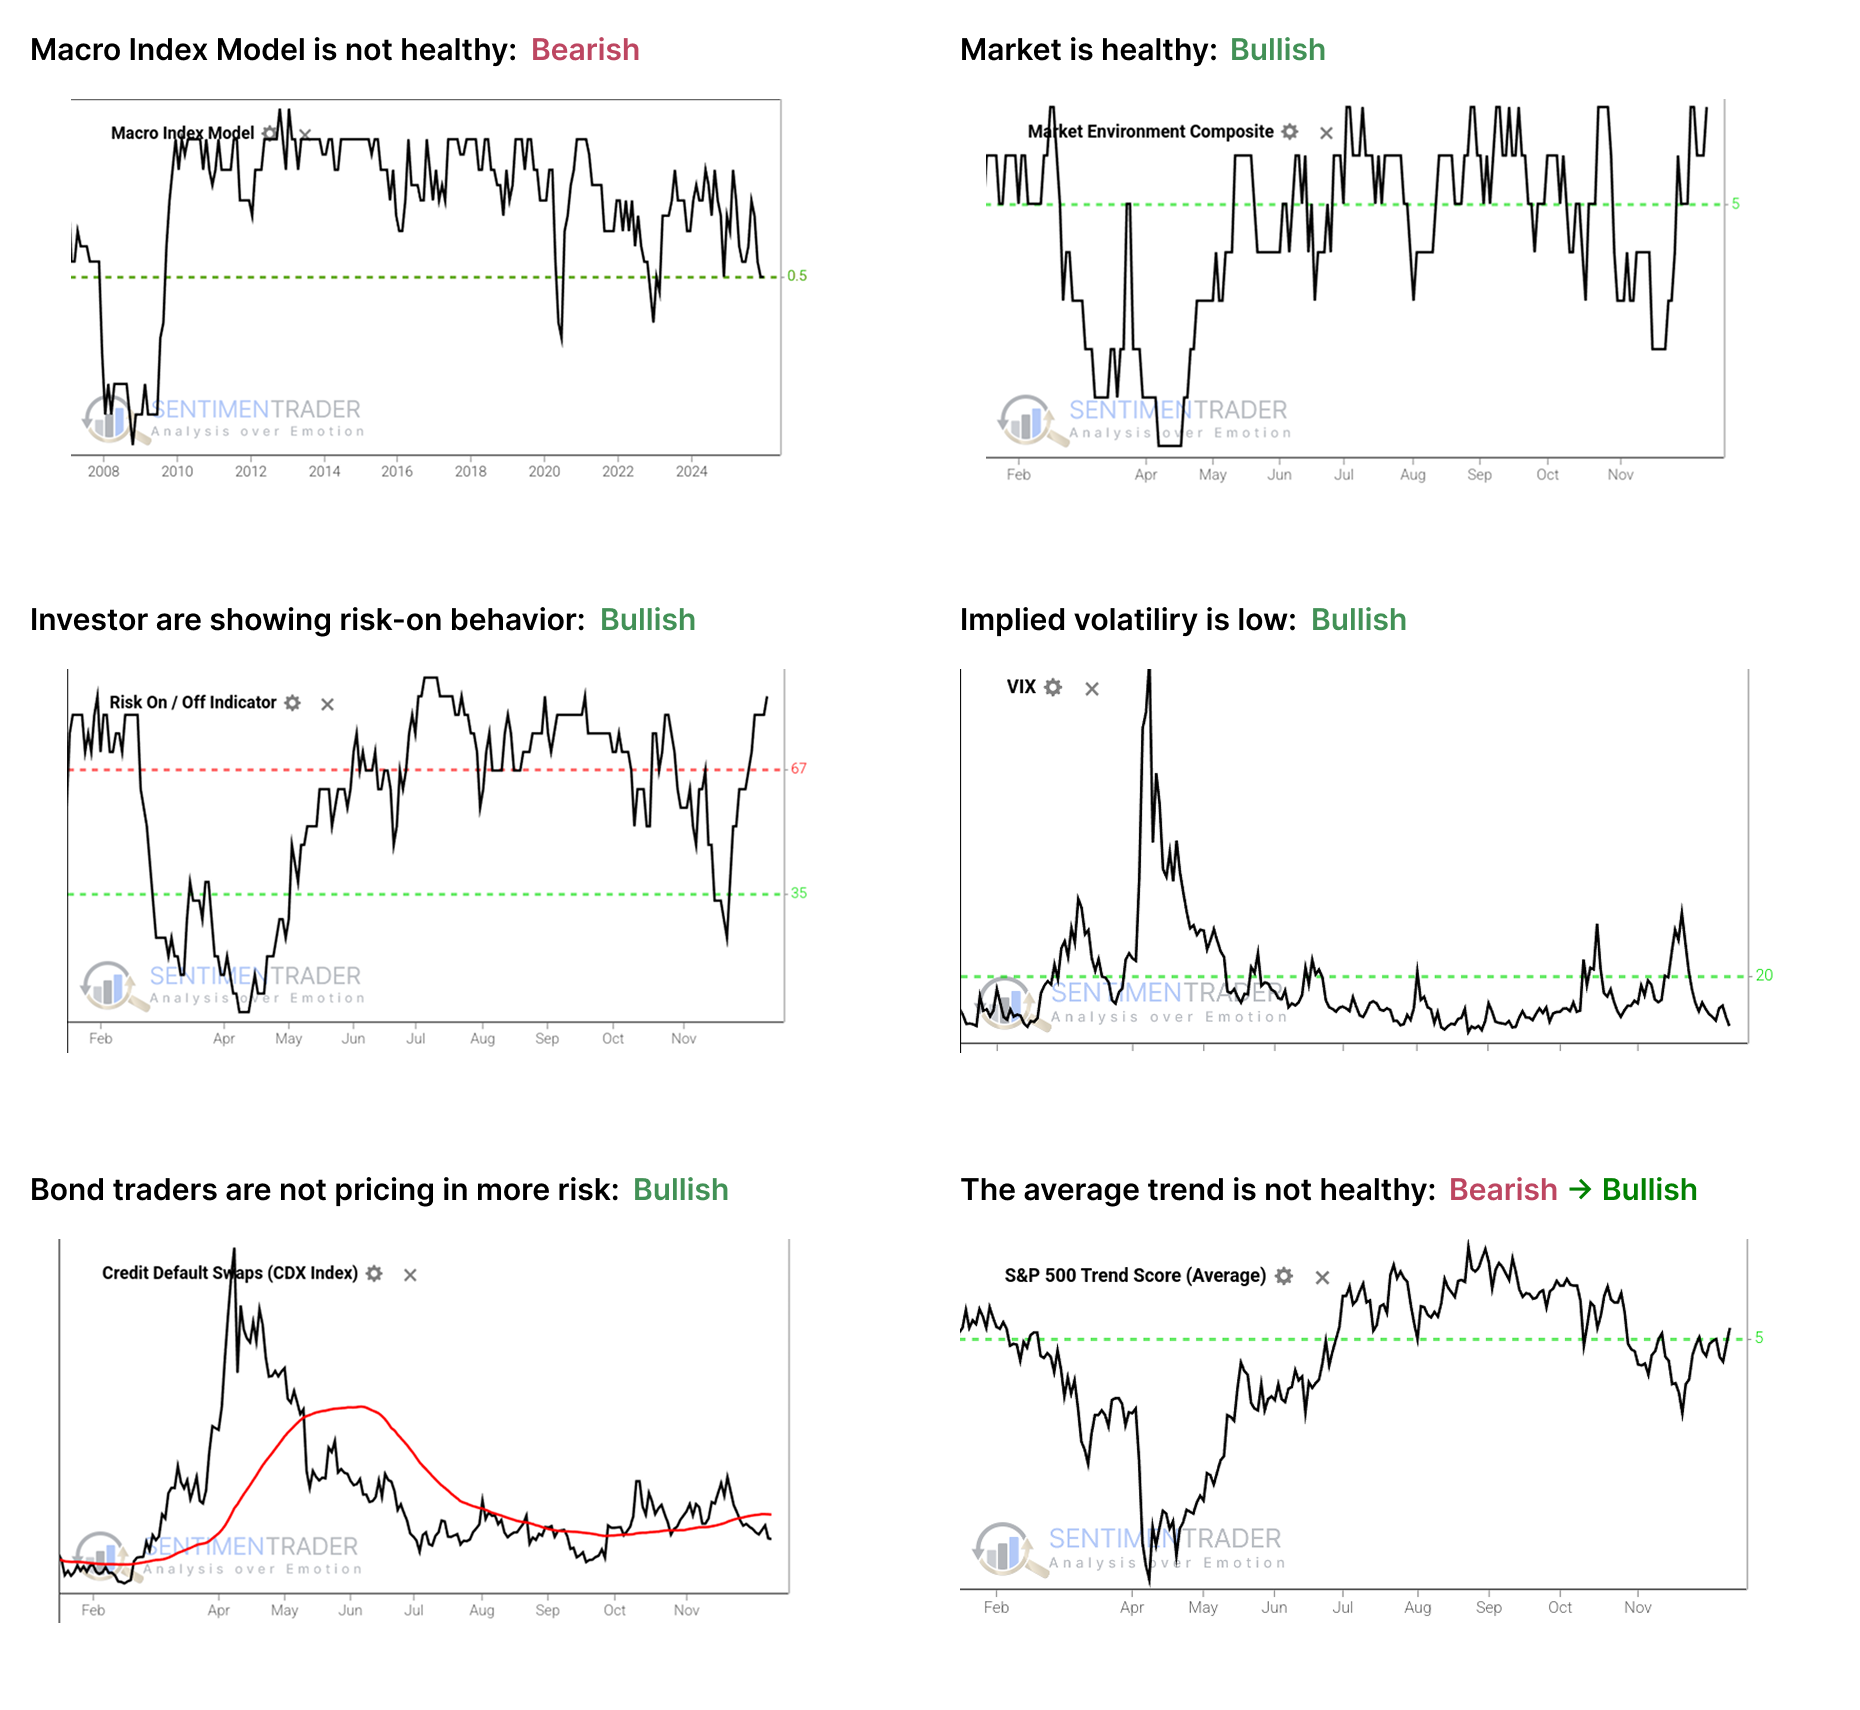
- The Macro Index Model is at or below the 50% threshold, which has proven to be a critical warning level as outlined here.
- The Market Environment has been skittish since April, but is currently healthy. Future returns, especially for higher-beta indices, has been markedly better, with less risk, when the environment is healthy as outlined here.
- The Risk On / Off Indicator shows that investors are still in risk-on mode. This has been a good sign for future returns as outlined here.
- Implied volatility remains below 20, showing a calm environment. The S&P 500 has perfomed well when this is the case as outlined here.
- Credit default swap spreads are below their 50-day moving average, which drastically improves stock returns as outlined here.
- A composite of trend measures in SPY and the average S&P 500 stock remain above 5, which show healthy trend conditions.
Since April, the most compelling studies have had a strongly bullish bias on longer time frames. You can follow these through the Active Studies page. From time to time, when the analysts' studies provide an overwhelming message, it will override the charts above, but there has been no consensus in the studies to suggest overriding the bullish environment.
Other major markets have been mostly rangebound for four months, and there is little among what we follow to suggest a compelling edge either way.
The Santa Claus Gold Miner Rally
Gold-related stocks have enjoyed consistent gains during a specific late-year seasonal window. As I define it, the Santa Claus Gold Miner Rally period:
- Begins on the close of the 11th trading day of December and;
- Extends through the close on the first trading day of January in the New Year
For 2025, this period extends from the close on December 15th through the close on January 2, 2026.
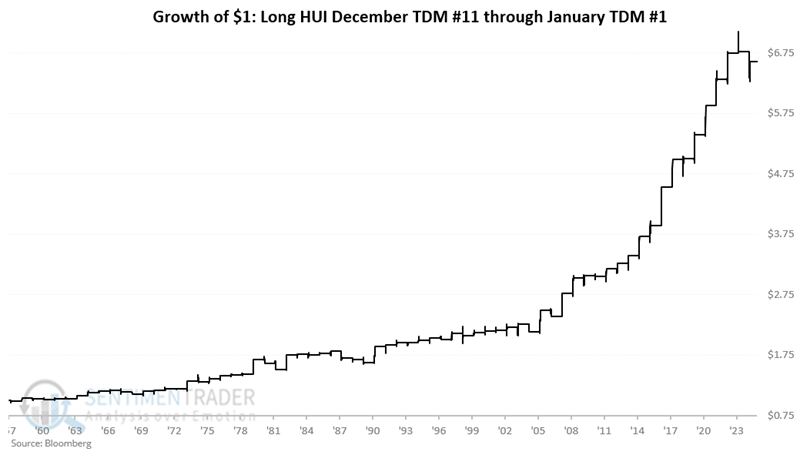
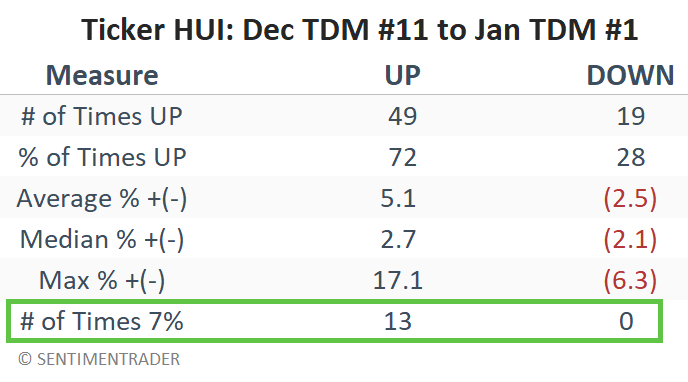
The table below summarizes HUI's performance during this late-year seasonal window. Note that big moves of 7% or more have all skewed to the positive side.
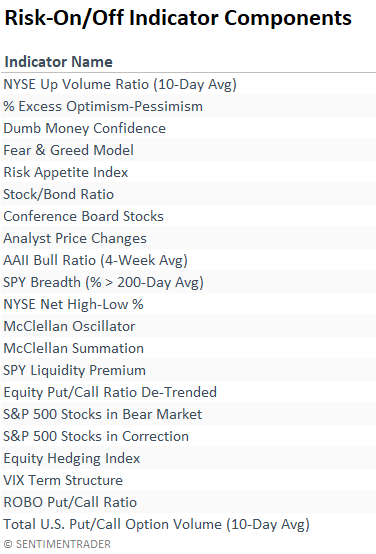
The Risk On/Off indicator shifts upward, signaling improvement
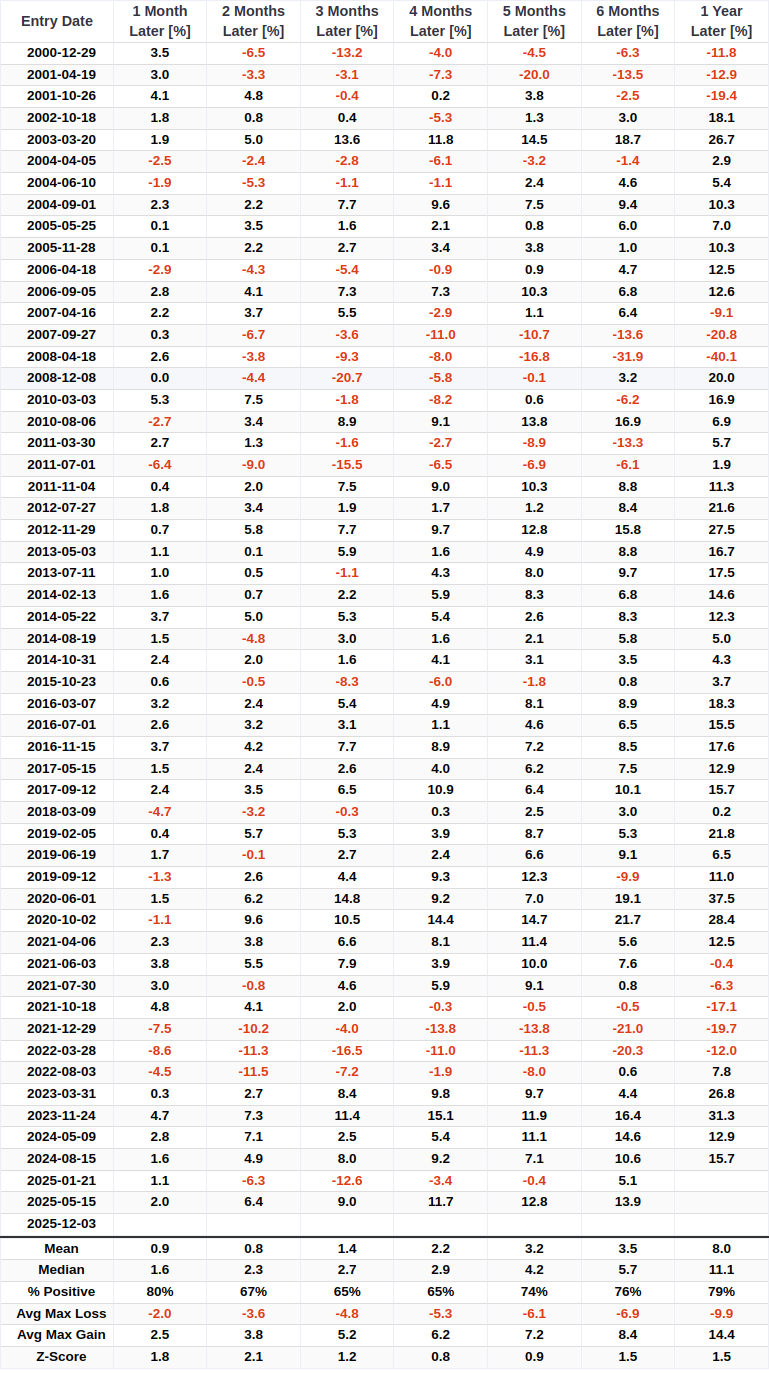
A trading system that uses the Sentimentrader Risk On/Off Indicator to identify a shift in the composite from the bottom of its recent range toward the upper end triggered a new risk-on signal for stocks. The previous signal in June 2025 led to an 8.1% gain in the S&P 500 over the subsequent three months.
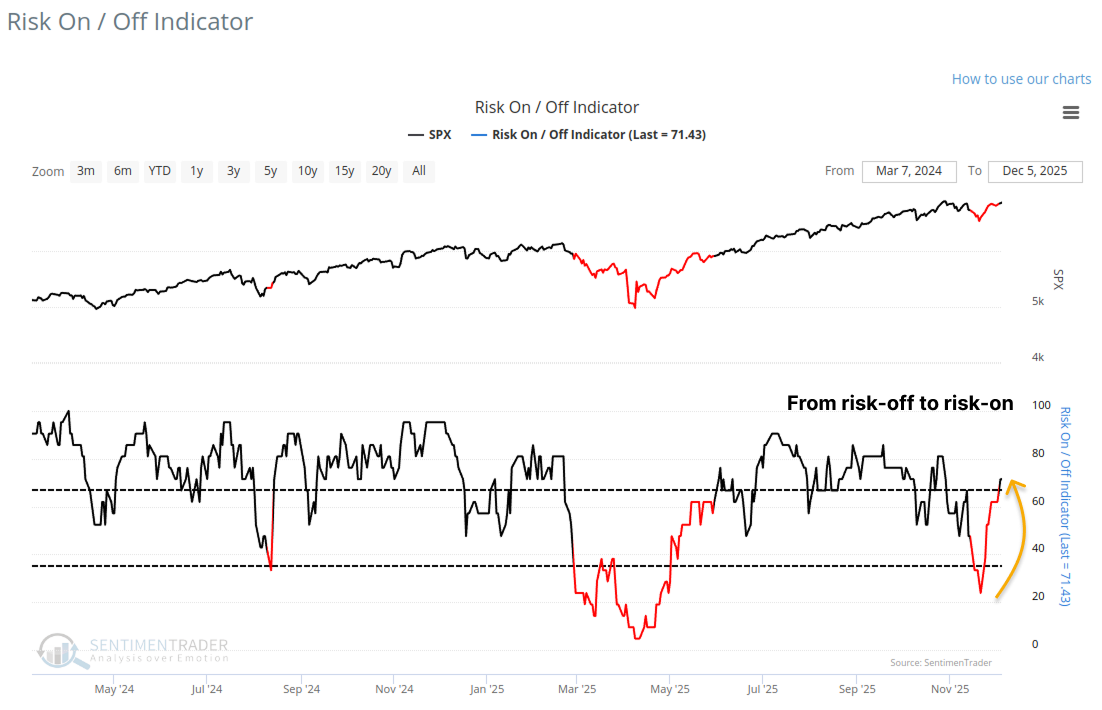
The Risk-On/Off Indicator is built from a broad array of inputs to capture the true state of market psychology.
The table below lists the entry date for each signal and the returns over various timeframes.
Sentimentrader's New TCTM Composite Recession Model
The Composite Recession Model plays a vital role within the broader S-TCTM framework. It is designed to issue an alert when a diverse array of inputs-including heavy truck sales, corporate bond yields, economic sentiment, and housing data-concurrently point toward a potential economic contraction.
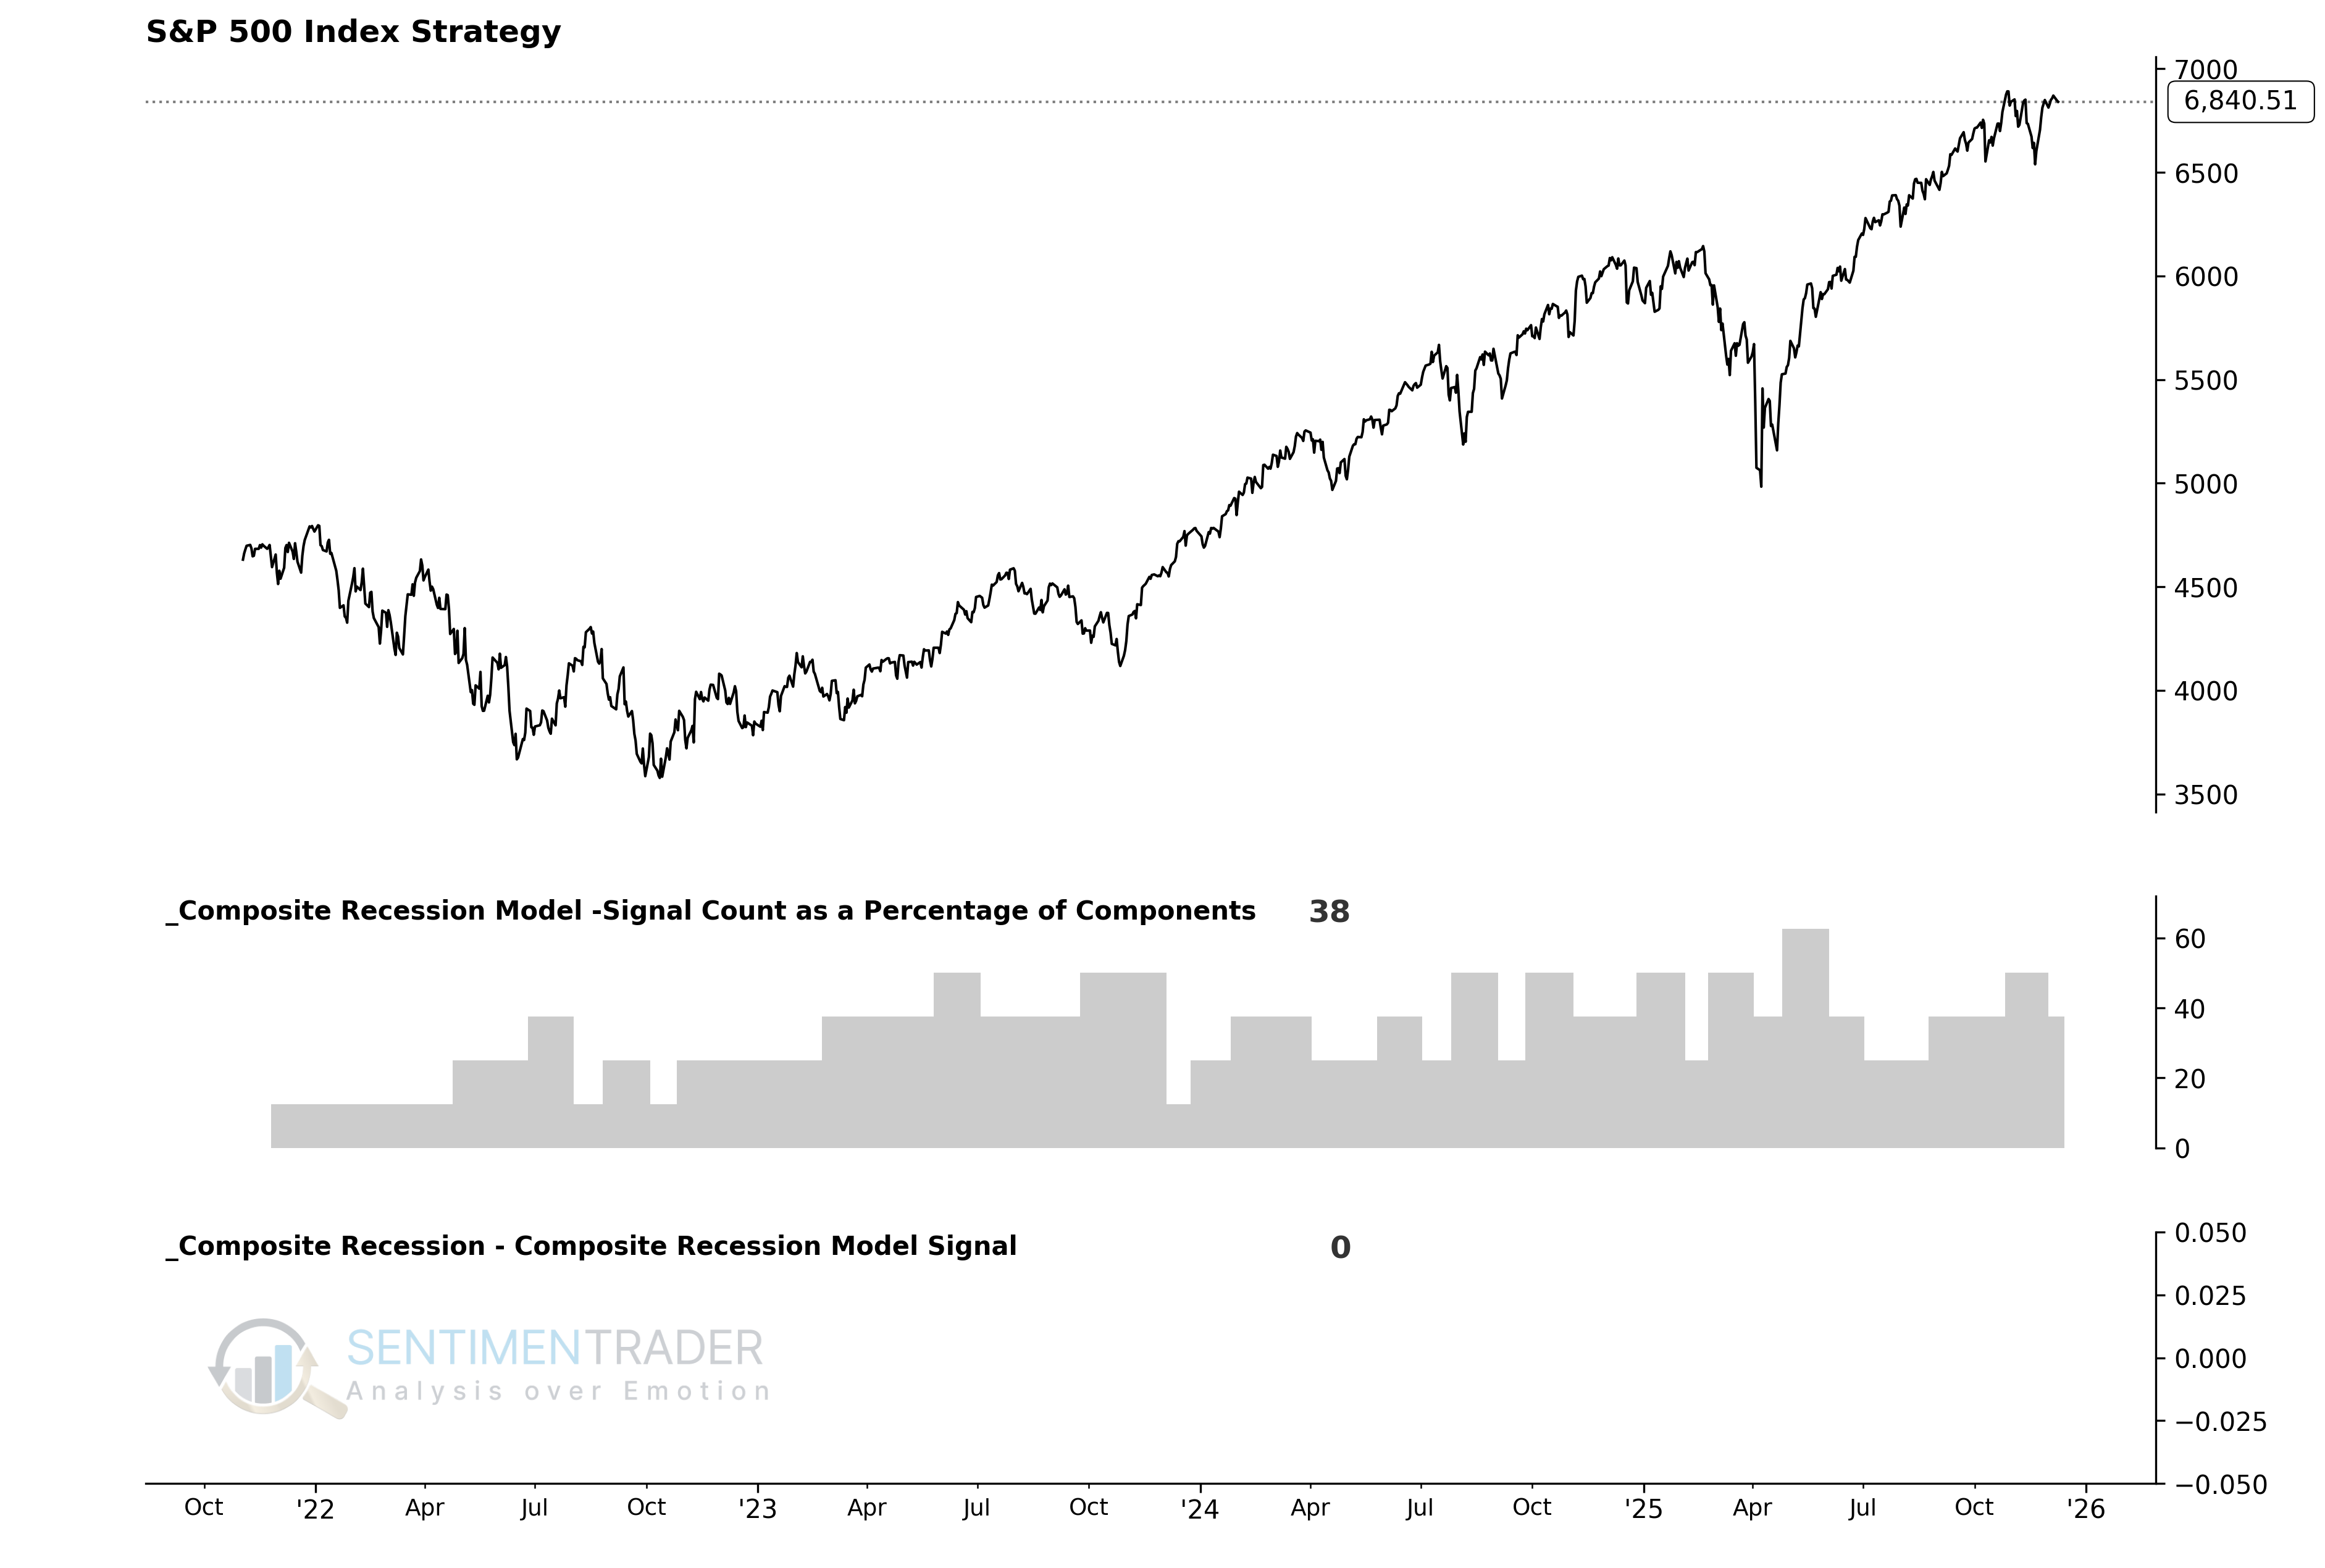
Currently, the model shows a reading of 0, indicating no recession warning signal is active.
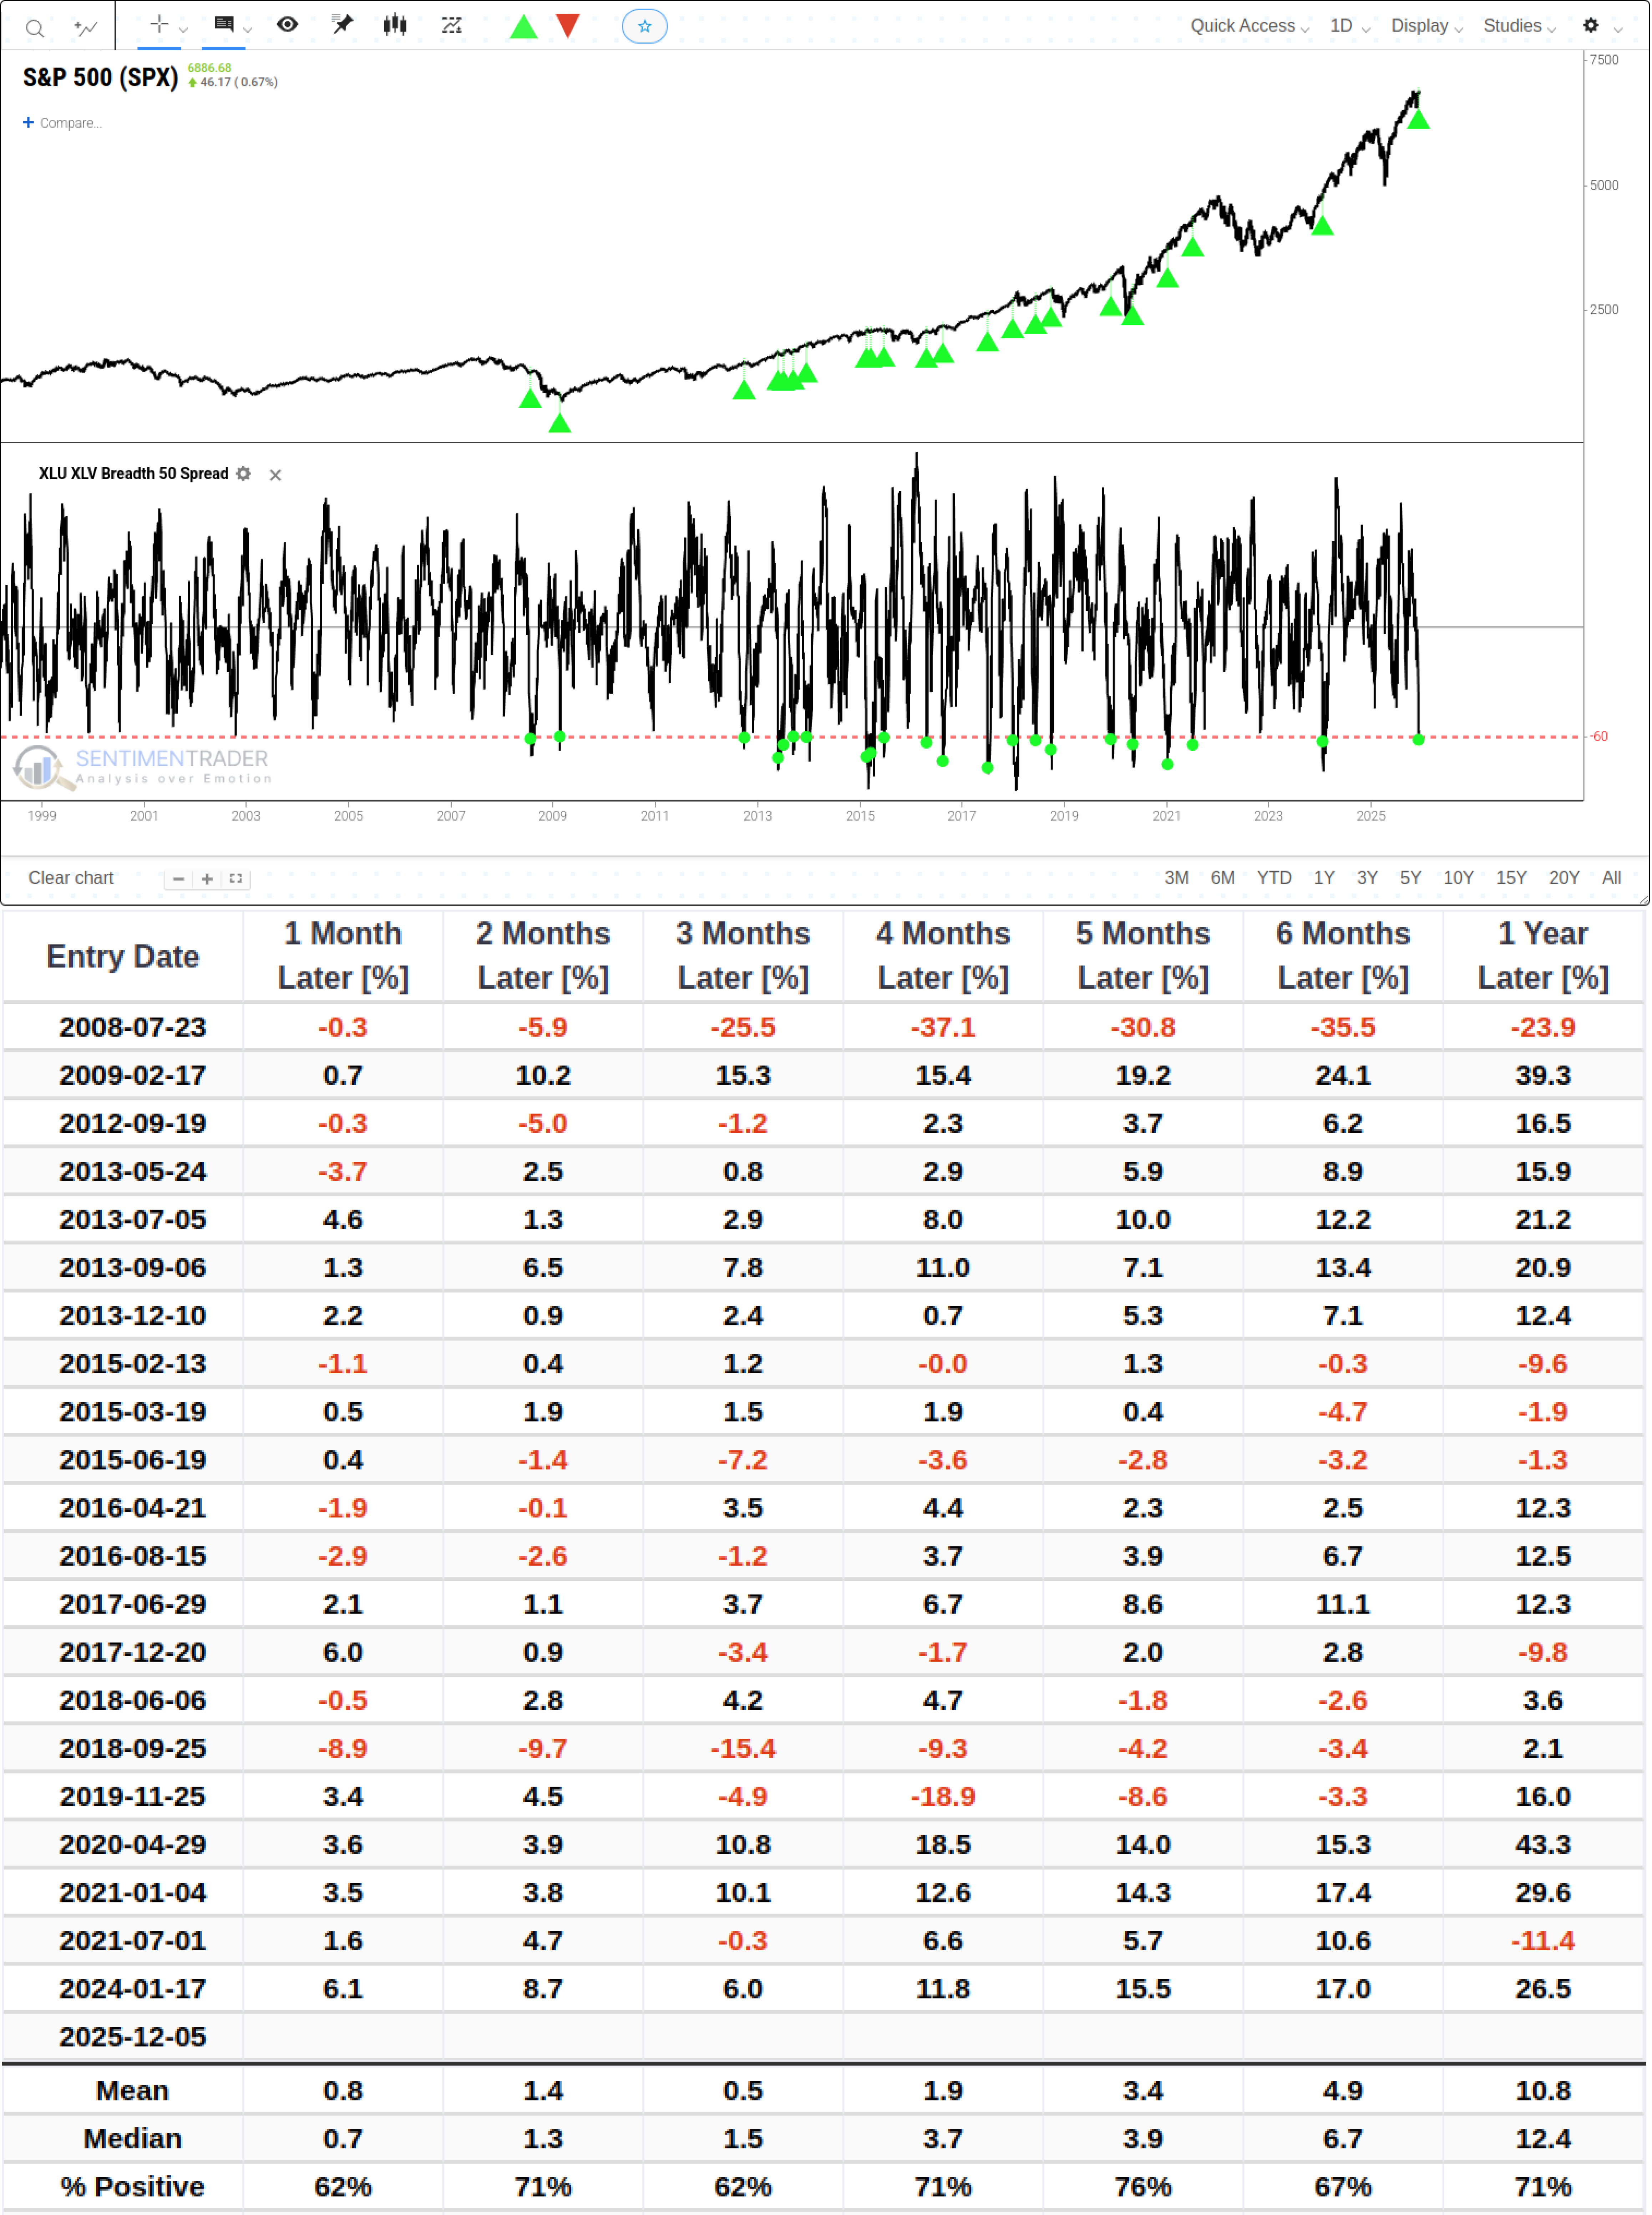
The Capitulation in Utilities
Defensive stocks earn their name because they often act as a hedge during economic distress. However, the recent performance of Utilities and Health Care sectors has diverged sharply.
Most Health Care stocks remain in relatively healthy trends.
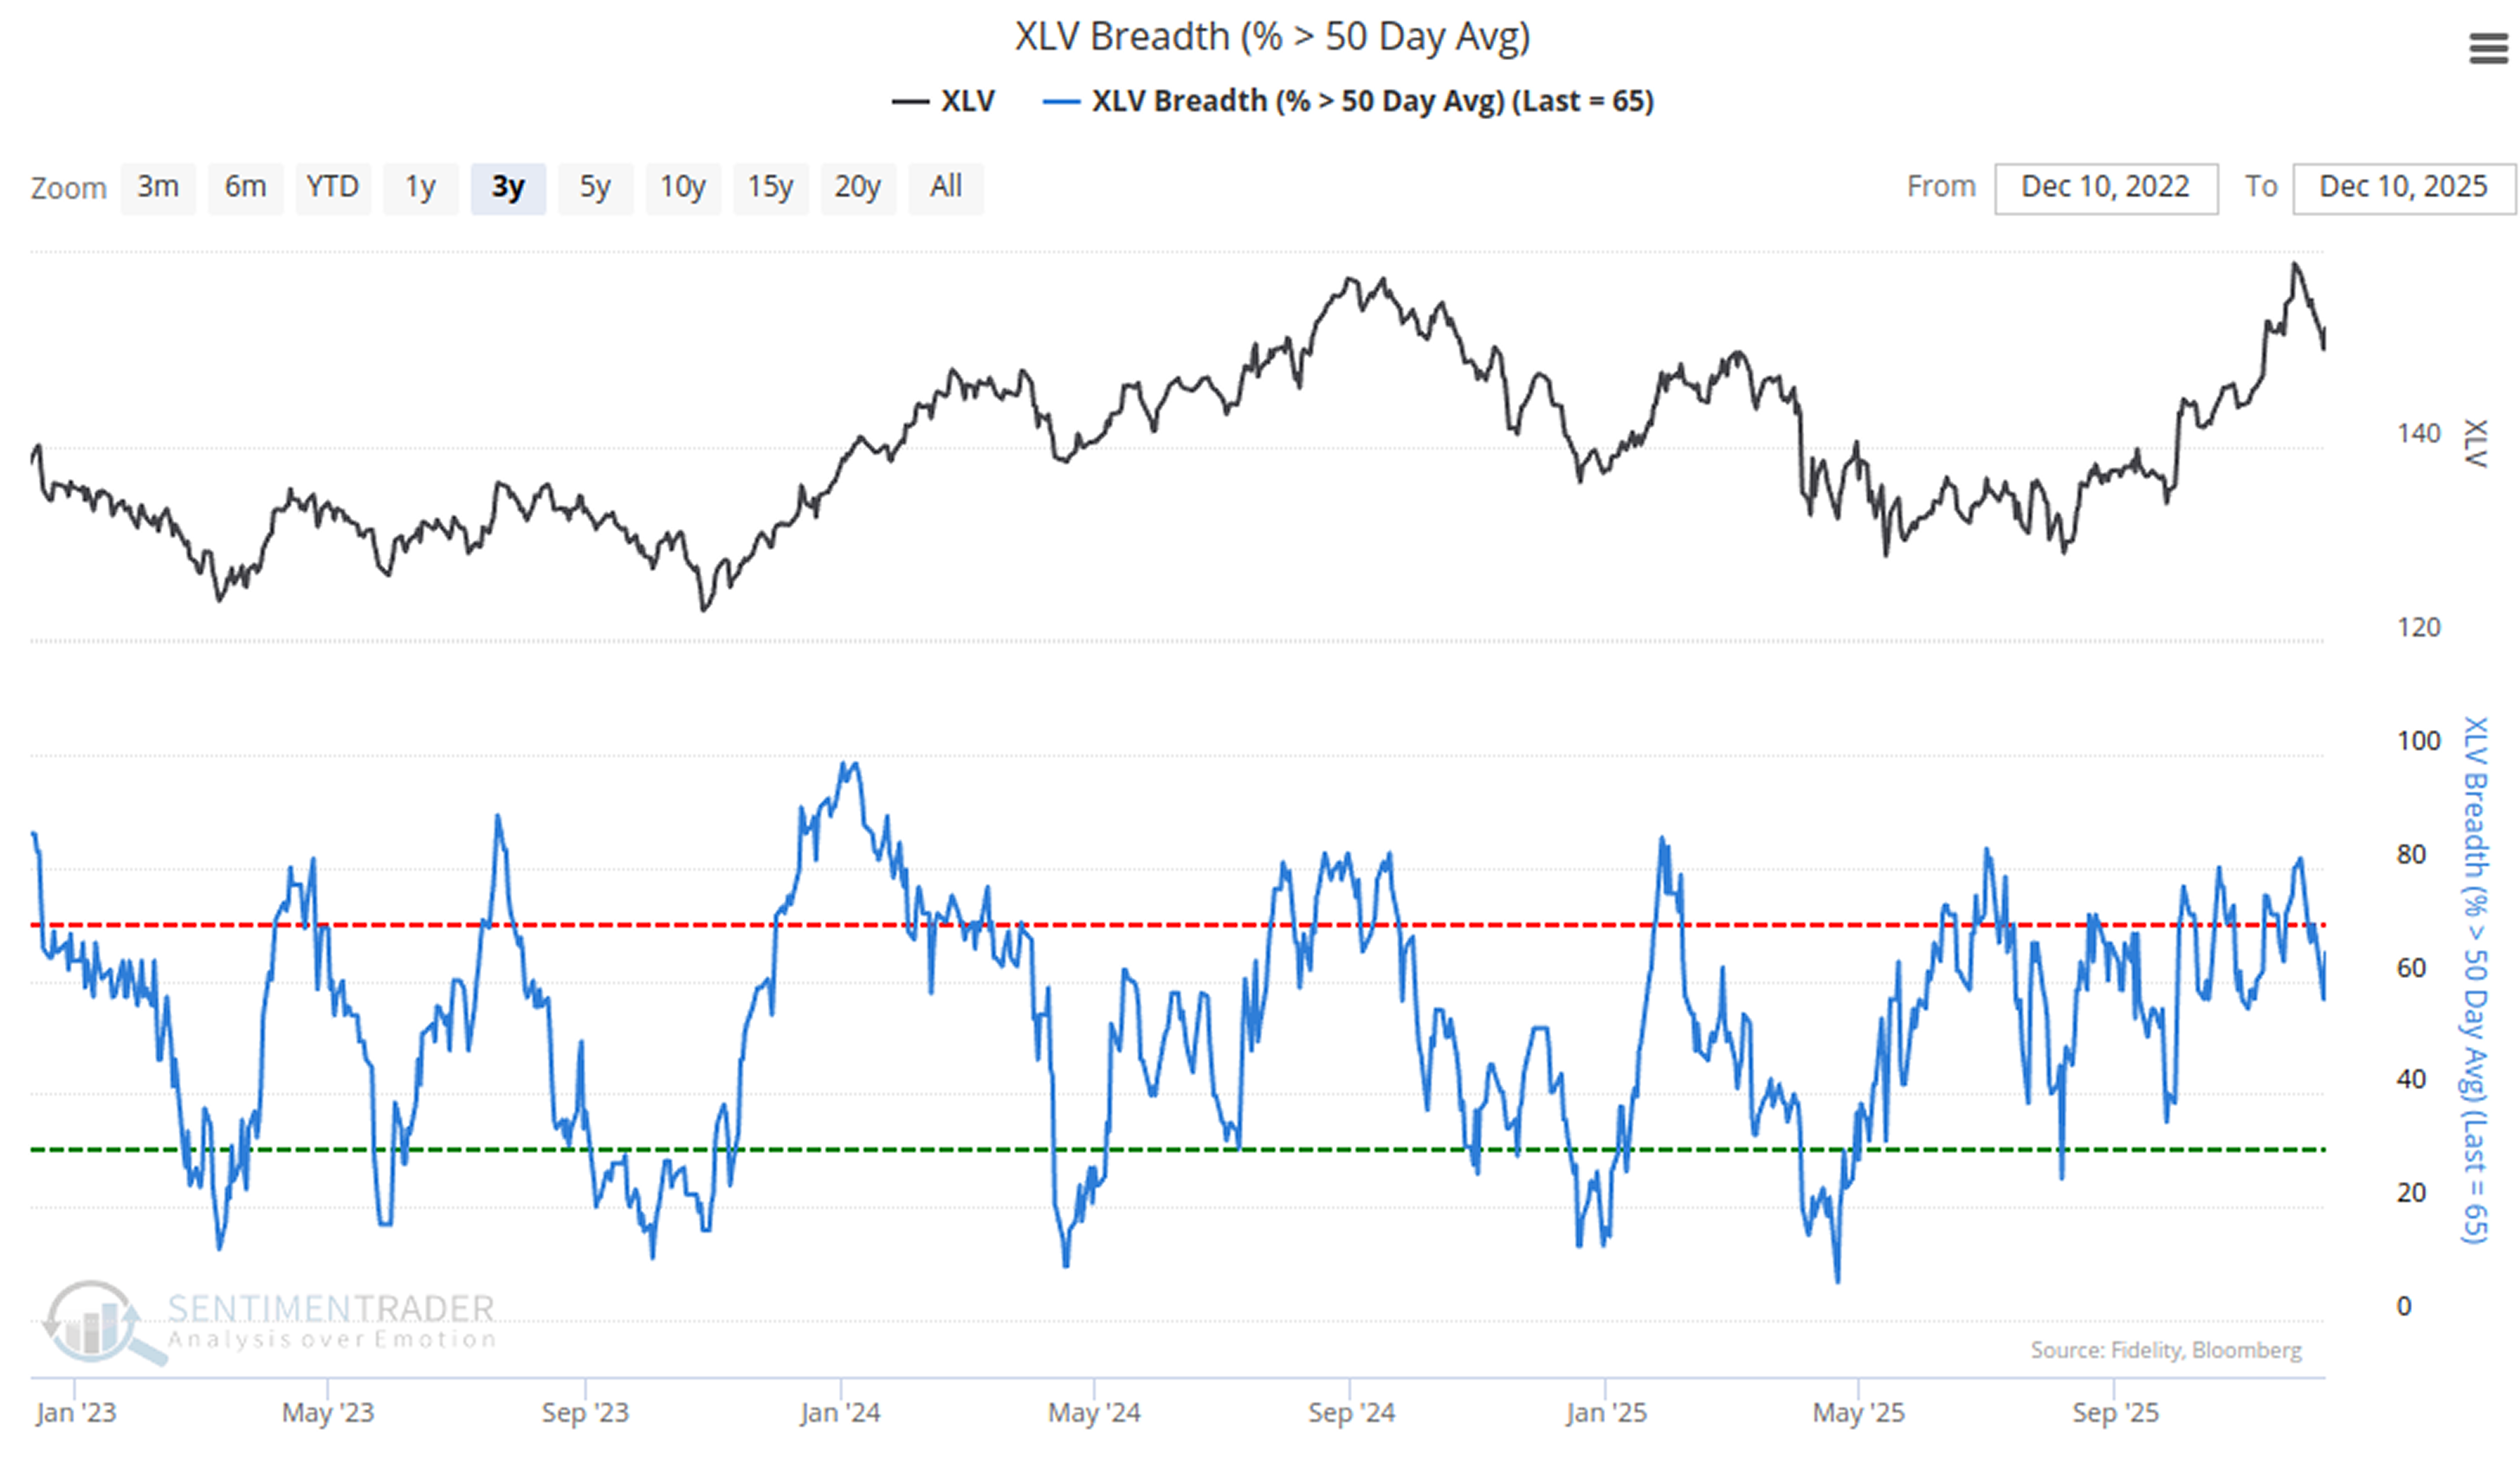
But Utilities stocks have underperformed significantly-by this week, 0% of Utilities stocks are trading above their 50-day MA.
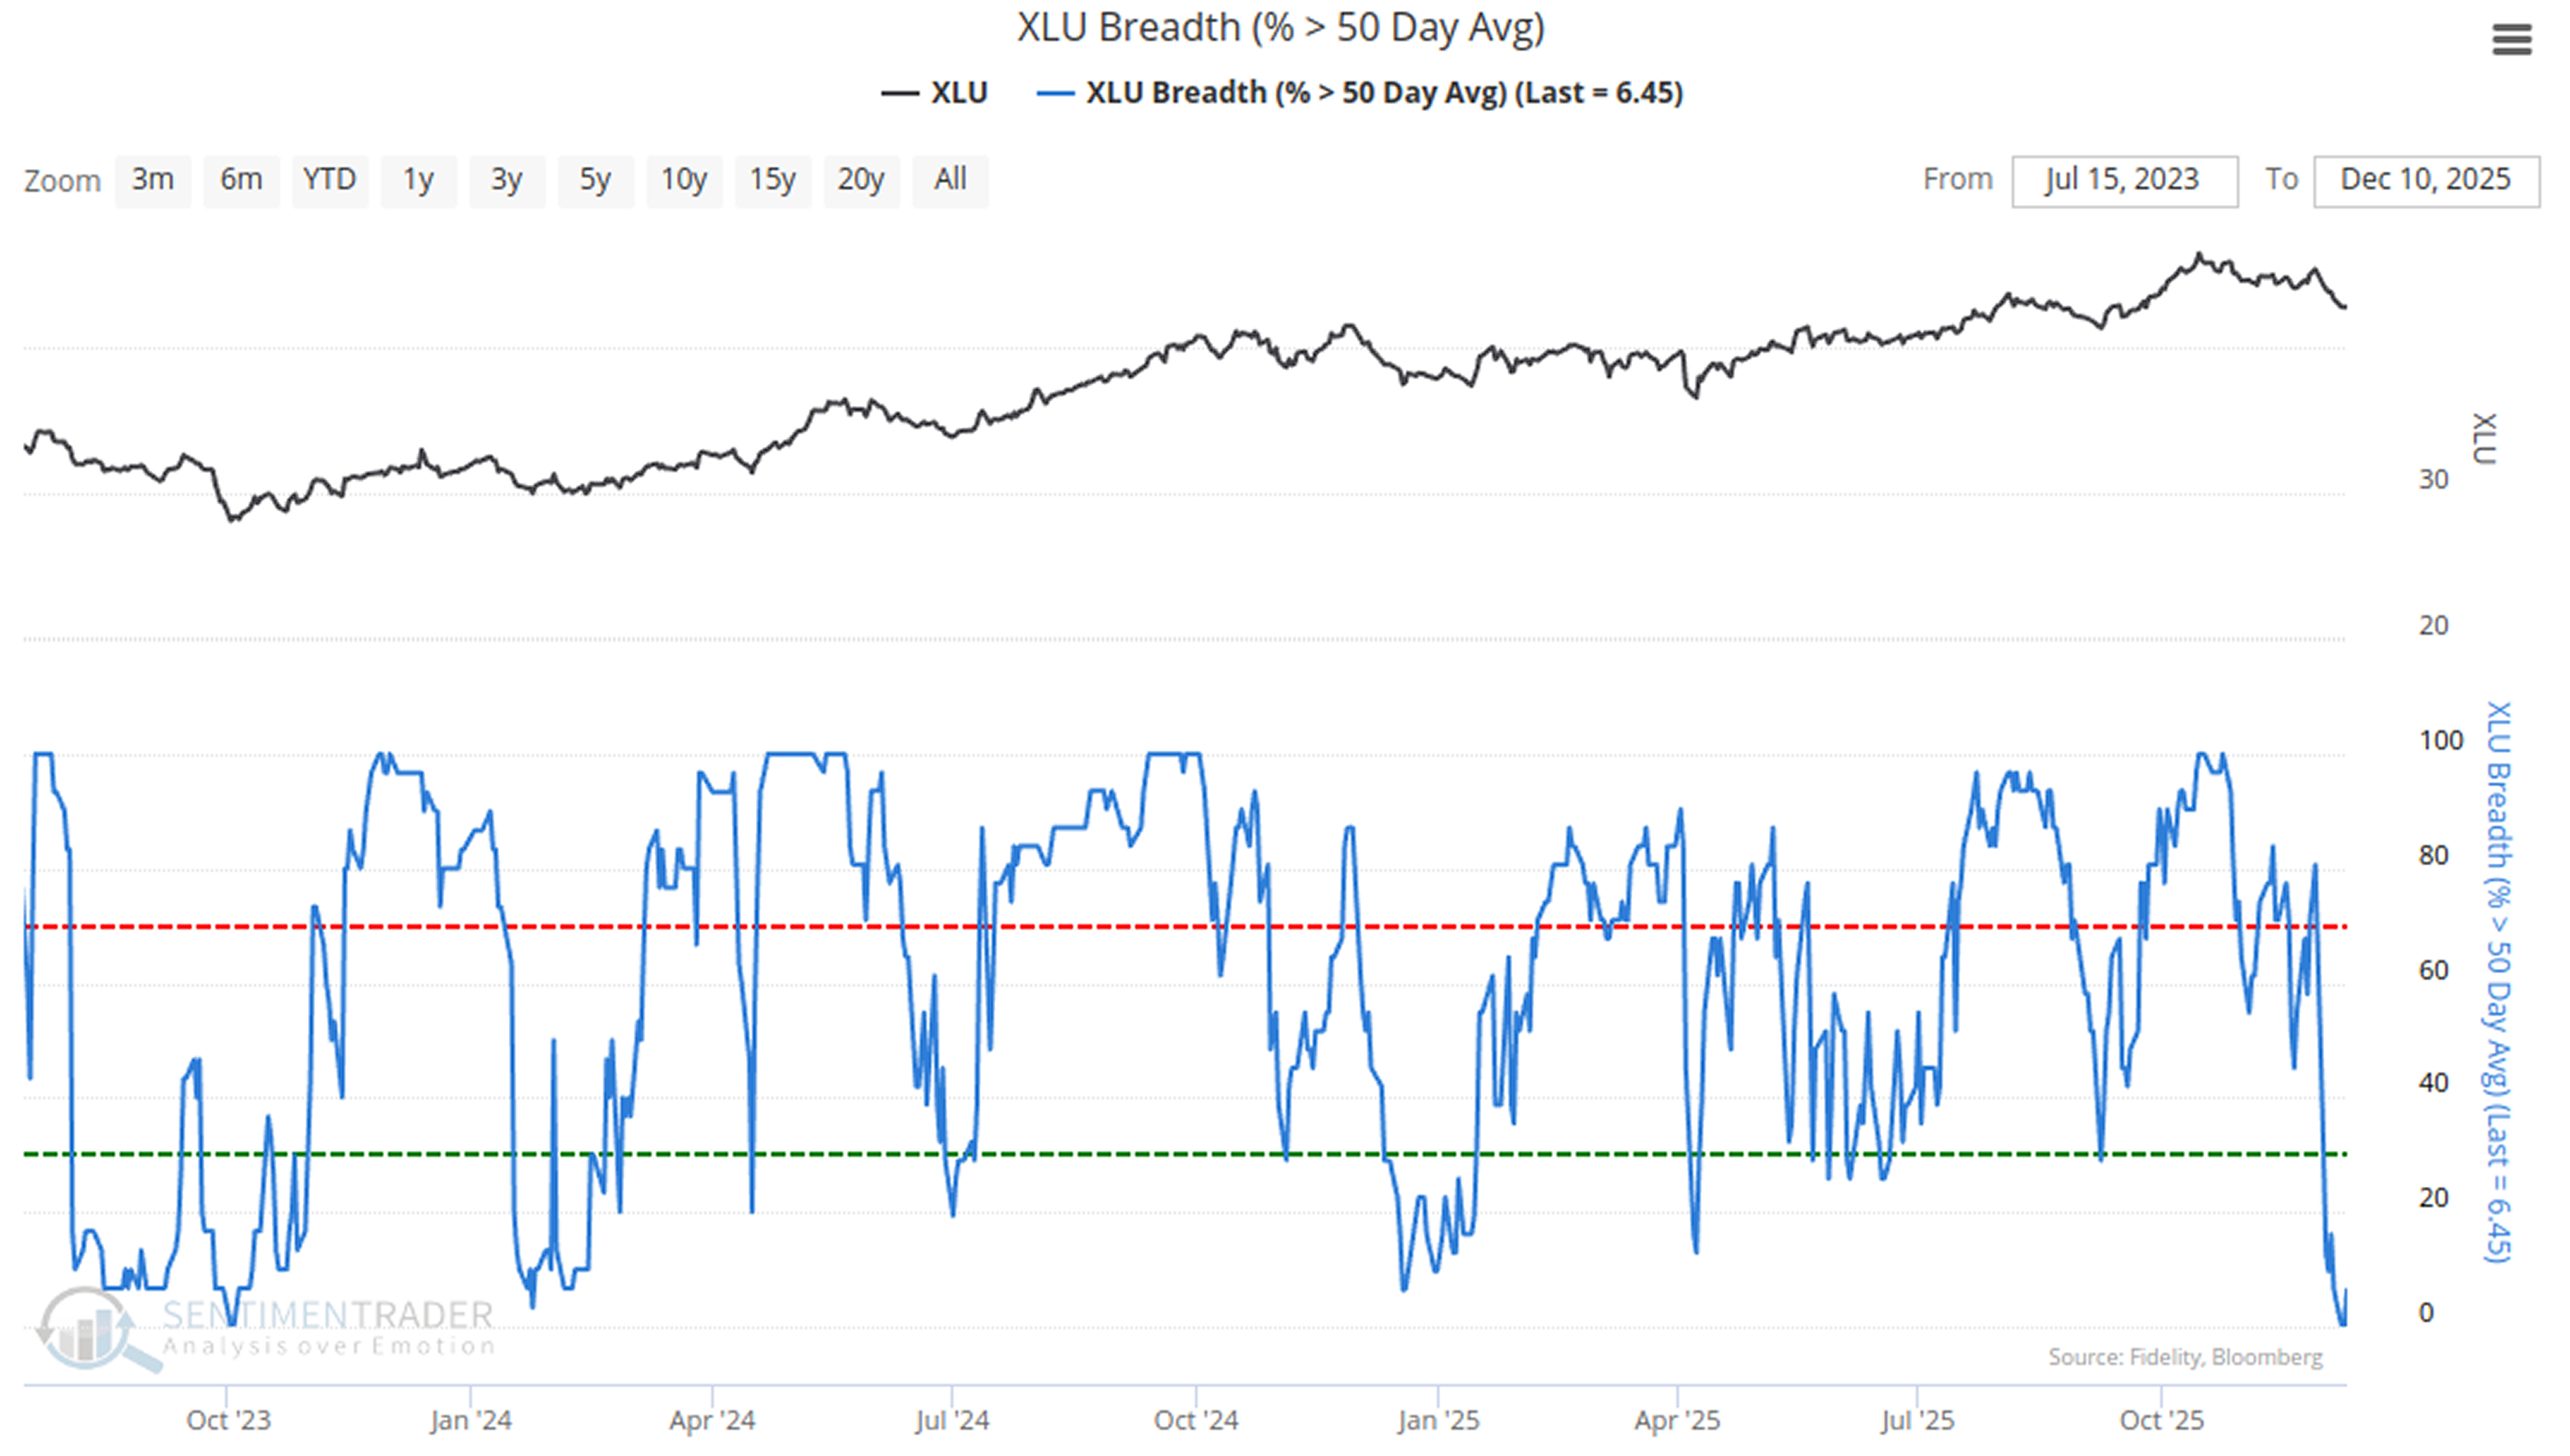
Historically, when we calculate the spread between the percentage of Utilities stocks above their 50-day MA minus the percentage of Health Care stocks above their 50-day MA, a drop below -60 is relatively rare.
The table below shows that this is not a worrying signal for the S&P 500, but rather a sign of health.
About TradingEdge Weekly...
The goal of TradingEdge Weekly is to summarize some of the research published to SentimenTrader over the past week. Sometimes there is a lot to digest, and this summary highlights the highest conviction or most compelling ideas we discussed. This is NOT the published research; rather, it pulls out some of the most relevant parts. It includes links to the published research for convenience, and if you don't subscribe to those products, it will present the options for access.