
TradingEdge Weekly for Apr 24 - Market breadth momentum, RSI reversal signals, and sector rotation

Key points:
- SPX weekly RSI 40/60 reversal triggers a strong historical momentum signal
- NYSE and Nasdaq Zweig Breadth Thrust crosses suggest favorable market continuation
- Nasdaq 100 Buying Climaxes indicator confirms strong medium-term upside probability
- Tech, Industrials, and Real Estate breadth dominance confirms broad participation
- Real Estate sector momentum thrust confirms structural cyclical uptrend
- Industrial sector faces tactical headwinds from extreme outflows and insider selling
- High-yield bond breadth divergence warns of near-term credit market exhaustion
House view:
- Stocks:
- Short-term: Bullish. The VIX and CDX remain in healthy territory. U.S. equities extend their historic rally, and enter a consolidation phase after hitting record highs. Market dynamics shifted from geopolitical relief to hawkish Fed repricing and AI capex anxiety. The Nasdaq could experience a short-term pullback due to profit-taking and earnings season supply, but the broader market's momentum continues to be resilient. This recent dip represents a healthy retracement, keeping the longer-term bull trend intact. Furthermore, seasonality is a positive factor, with April historically ranking as a strong month for the S&P 500. This time frame covers 1-4 weeks.
- Intermediate-term: Bullish. Market momentum (61.9) has improved significantly, but the market has not yet returned to a risk-on mode. All major indices are trading well above their 50-day and 200-day moving averages, with broad-based market breadth confirming the strength of the rally. However, the market remains in a mixed phase-geopolitical concerns persist. Downside risks stem from prolonged higher-for-longer interest rates, compressed equity valuations, and renewed Middle East conflict risks that could lift energy costs and inflation.This time frame covers 1-5 months.
- Long-term: Bullish. The long-term bull market structure remains firmly intact, with the breakout to new all-time highs confirming the underlying strength of the uptrend. The S&P 500 Average Trend score is currently testing a critical inflection point. A decisive breakout above the 5.0 threshold would trigger a risk-on signal, confirming a broader bullish regime. This time frame covers 6-12 months.
- Overweight: Financials with strong earnings beats, AI core assets with proven monetization capabilities, and cyclical sectors benefiting from economic resilience
- Underweight: High-growth tech facing capex pressure, rate-sensitive small-cap assets, and cyclicals vulnerable to cost inflation
- Monitor Japanese equities for alpha opportunities amid yen depreciation and geopolitical relief (Nikkei 225 at all-time highs)
- Bonds: Long-term cycles remain bearish. The Treasury yield curve steepens, with the 10-year yield holding steady at 4.32%. Historically, April has typically been one of the months in which TLT has underperformed. Inflation fears driven by renewed oil price upside continue to cap bond upside.
- Commodities: The complex remains in a state of high volatility, driven by ongoing geopolitical negotiations and central bank demand dynamics.
- Crude Oil: High volatility. Prices are balanced between expectations for an extended ceasefire and lingering risks of renewed conflict in the Middle East. Escalating U.S.-Iran military tensions reignited supply disruption fears, creating violent whipsaws.
- Gold & Silver: Range-bound. Gold trades at $4,694.14, while silver is at $75.44. Precious metals have stabilized at higher levels despite strong equity performance, supported by persistent central bank gold purchases and de-dollarization trends. However, reduced safe-haven demand limits near-term upside potential.
- Crypto: We follow several simple systems for U.S.-traded bitcoin, which we consider the equivalent of the S&P 500 for crypto. Amid the market's paradigm shift to real assets and fiat credit doubts, crypto assets face valuation revaluation pressure from tech stock sell-off contagion, but long-term fundamental support from tokenization remains. Market volatility rises with the overall financial market, and short-term price performance is dominated by risk appetite shifts, with structural opportunities tied to institutional adoption and underlying technology innovation.
- Triple 40: Bullish
- RSI Momentum: Bullish
- Trend and Relative Trend: Bearish
- PMI: Bullish
- M2 ROC: Bullish
- Notable Moves in Global Markets:
- Europe: European stock markets fell across the board, with the weakness stemming from their high exposure to the energy crisis in the Middle East.
- Japan: The Nikkei 225 index briefly surpassed the 60,000-point mark during intraday trading, setting a new record high. However, investors should be wary of a potential pullback triggered by soaring global oil prices (to which Japan, as a net energy importer, is extremely sensitive).
Where we're at
Most investors have the most riding on equities. We feel that the most significant determinants of success for investors are whether to adjust their allocation to that asset class based on factors that have historically had a good record of preceding above- or below-random returns in the months ahead.
Those factors include the probability of a looming recession, sentiment, price action, volatility, breadth, and the bond market. The chart below summarizes the main indicators and composite models we watch for those factors, and they're mostly in bullish regimes. Valuations are not part of these factors since the relationship has been too inconsistent on time frames under one year.
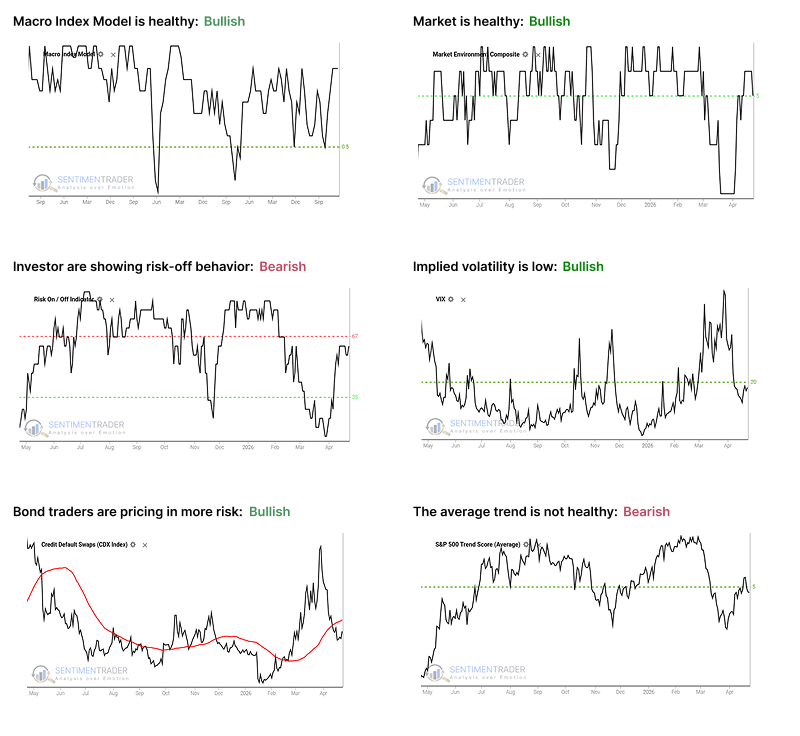
- The Macro Index Model is above the 50% threshold, which has been a vital level as outlined here.
- The Market Environment has been skittish, but is currently healthy. Future returns, especially for higher-beta indices, has been markedly better, with less risk, when the environment is healthy as outlined here.
- The Risk On / Off Indicator shows that investors are now in risk-off mode. This has historically been a warning sign for weak future returns as outlined here.
- Implied volatility remains below 20, showing a calm environment. The S&P 500 has perfomed well when this is the case as outlined here.
- Credit default swap spreads are below their 50-day moving average, which drastically improves stock returns as outlined here.
- A composite of trend measures in the average S&P 500 stock have dropped below 5, which shows weak trend conditions.
SPX Weekly RSI Triggers a High-Probability Momentum Signal
One useful study looks for an oversold signal to occur, and then monitors for a powerful reversal as a sign of potentially better days ahead. What we will test for specifically is the following pattern using the 14-week Relative Strength Index (RSI) for the S&P 500 index: The 14-week S&P 500 RSI closes a week below 40; Subsequently, the same 14-week RSI closed a week back above 60; Once this pattern completes, we will deem the market environment as favorable for stocks for at least 189 trading days.
Most recently, the 14-week S&P 500 RSI closed below 40 during the week of March 27th. Just three weeks later, the RSI closed above 60 on April 17th. Note the tendency for the S&P 500 to continue to rise following the end of each red box.
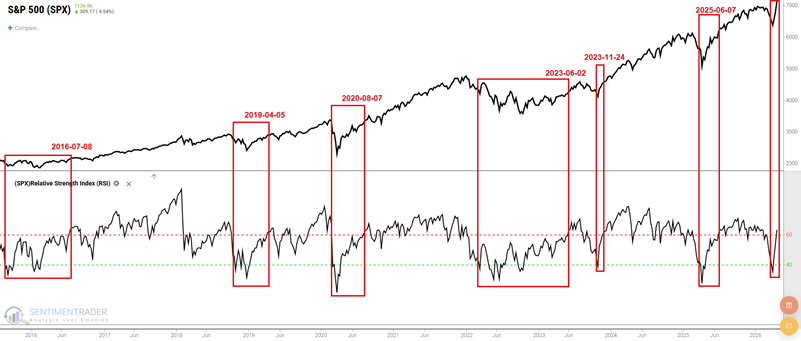
The S&P 500 RSI 40/60 approach represents one way to objectively identify when the overall stock market has bounced off an oversold condition in a manner sufficient to sustain a broad-based advance. The signal generated on April 17th lends weight to the favorable side of the weight of the evidence ledger into mid-January of 2027.
Breadth Thrust Dynamics: Assessing Continuation Signals for SPX and NDX
The "Classic" Zweig Breadth Thrust (ZBT) involves the 10-day EMA of NYSE Advances divided by NYSE Advances plus NYSE Declines. This indicator triggers a favorable signal when it moves below 0.40 and then surges above 0.615 within 10 trading days. The recent ZBT dropped below 0.40 but failed to rise above 0.615. We tested how the market reacted after all NYSE ZBT crosses above 0.60, ignoring the 0.40 condition.
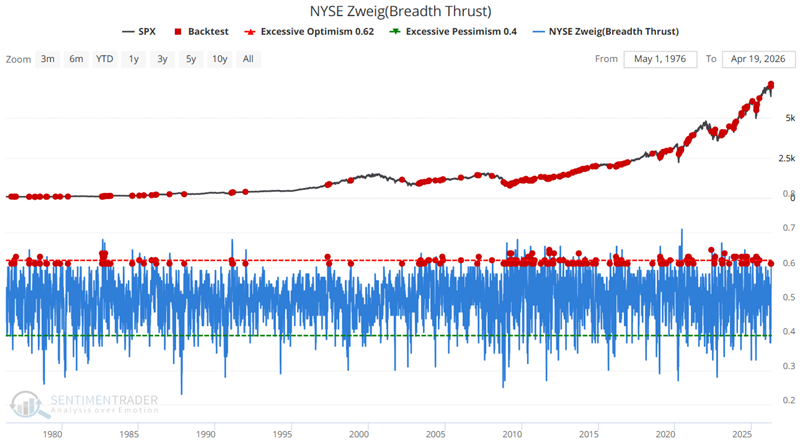
It has historically served as a useful, though imperfect, "continuation (of an ongoing bull market) signal." The bottom line is that a NYSE ZBT reading above 0.60 has typically been followed by higher stock prices a high percentage of the time (92% over the following 12 months). Applying this signal to the Nasdaq 100 yields even better overall results.

Any cross above 0.60 for either the NYSE or NASDAQ versions of ZBT typically lends significant weight to the favorable side. Investors should continue to give the bullish case the benefit of the doubt unless price action argues otherwise.
Nasdaq 100 Buying Climaxes Indicator Points to Sustained Upside
The 150-day moving average of the Nasdaq 100 Buying Climaxes indicator crossed above 0.24, with recent signals occurring in early 2025 and April 2026. This is the type of indicator that speaks only infrequently, but when it does, it often says something useful.
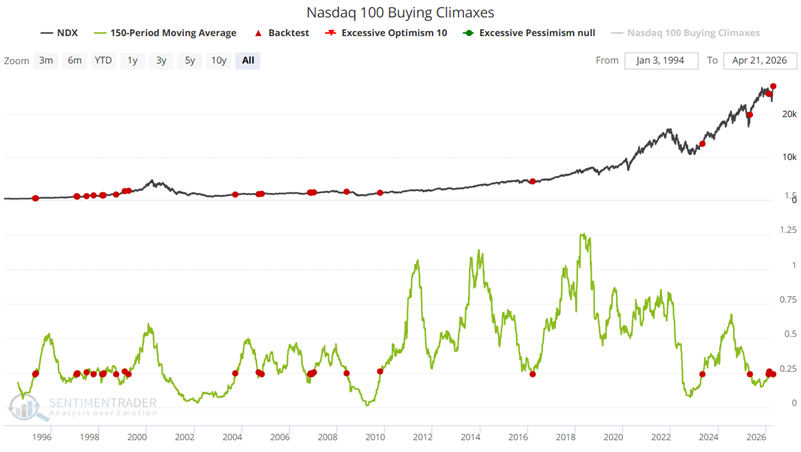
A systematic test buying the NDX on this cross with a 15% stop-loss and a 1-year hold shows a 91.7% Win Rate while being in the market only 27% of the time. The strategy shows a compelling Win Rate from 3 months to 1 Year. Based on the overall results, this indicator suggests a strong possibility of higher stock prices over the next 12 months.
Confluence of Sector Breadth and Trend Strength at Record Highs
The proportion of stocks reaching 52-week highs simultaneously exceeded 12% in Technology (XLK), Industrials (XLI), and Real Estate (XLRE). The S&P 500 Trend Score hit a 9, confirming this bullish internal setup. When broad participation and elevated trend strength align near record highs, the forward outlook for the S&P 500 is overwhelmingly bullish, boasting an 86% win rate over the subsequent two-week and one-month windows.
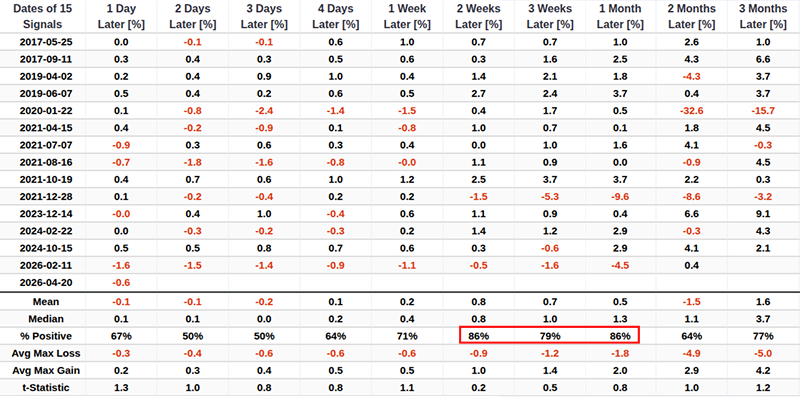
The Stock/Bond Ratio broke out to 2.53, reflecting massive risk-on capital flows. Historically, when the ratio surges to the 2.5 level, it marks a climactic shift of capital into equities. Looking out a year later, the S&P 500 trades higher 81% of the time.
Real Estate Sector Surges to 100% Short-Term Breadth Momentum
All 31 constituents of the Real Estate Select Sector SPDR Fund (XLRE) were trading above their 10-day moving averages. In less than a month, the indicator rocketed to a staggering 100%. While this extreme short-term momentum flags a high probability (69%) of a minor pullback over the immediate 1-week window, the magnitude of such a drawdown is historically shallow.
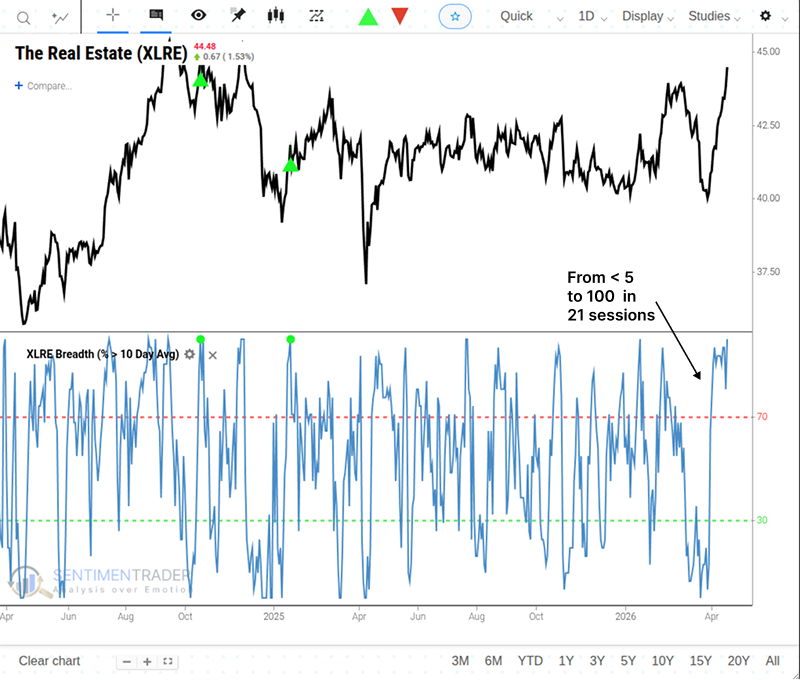
Shifting focus to the XLRE 50-day breadth, similar momentum thrusts have historically generated robust medium-term forward returns with a 73% win rate. A structural uptrend is confirmed when the 50-day moving average for XLRE rises for 10 consecutive sessions. The emergence of a new uptrend for this highly cyclical industry bodes well for cyclical equities.
Industrial Sector Faces Tactical Headwinds from Liquidity Drains
While the XLI remains in a structural uptrend, it saw a net outflow of roughly $590 million in a single day, ranking among the largest in recent history. Following similar extreme outflow signals, the index was lower one week later 73% of the time. One month out, the weakness typically persists.
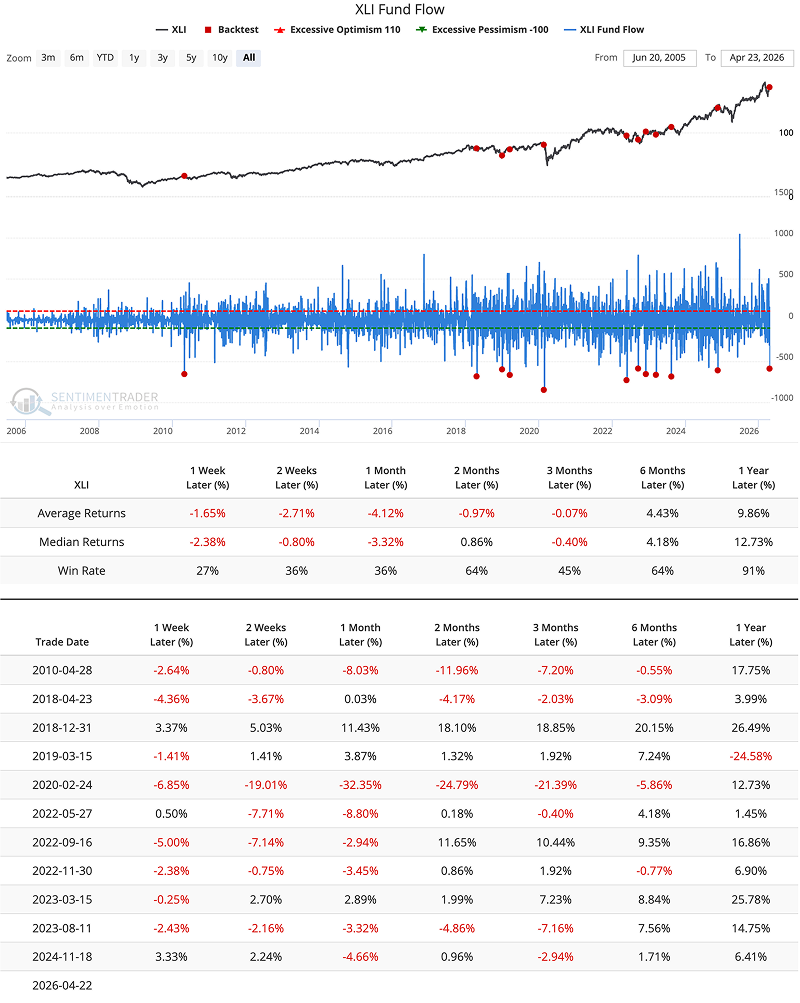
Corporate insider selling in the sector has climbed to a 49-week high. Combined with historically "bumpy" seasonality heading into May and June, the risk-reward for new long positions is poor. The data favors a tactical pullback toward the 168-170 range if the 50-day moving average holds as a pivot.
High-Yield Bond Breadth Shows Early Warning Signs of Exhaustion
When high-yield bond new highs significantly outpace new lows-especially when breaching the 350-point threshold-it looks like a structural green light. The reality in the credit market is quite different: this extreme breadth reading is an exhaustion event. Two months after the signal, HYG has only rallied 25% of the time.
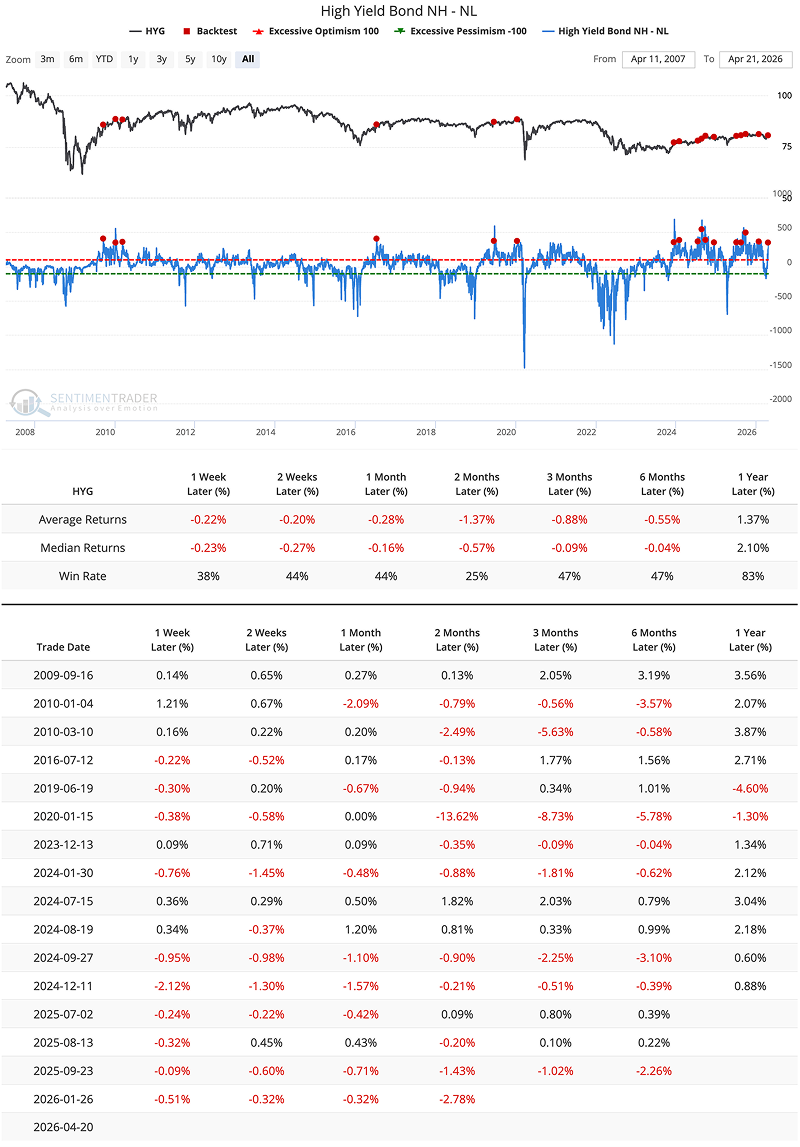
The lackluster participation kept the long-term McClellan Summation Index in negative territory even as equities made new highs. In eight such divergence events, HYG experienced steady drawdowns with a low probability of gains. The S&P 500 absorbs these credit breadth divergences well in the short term, though its probability of positive returns decays by six months.
About TradingEdge Weekly...
The goal of TradingEdge Weekly is to summarize some of the research published to SentimenTrader over the past week. Sometimes there is a lot to digest, and this summary highlights the highest conviction or most compelling ideas we discussed. This is NOT the published research; rather, it pulls out some of the most relevant parts. It includes links to the published research for convenience, and if you don't subscribe to those products, it will present the options for access.