
A significant downward shift in the Risk On/Off Indicator

Key points
- The proprietary SentimenTrader Risk On/Off Indicator has dropped below the critical 35% threshold, officially shifting the market environment to a "Risk-Off" regime.
- This shift was sudden and sharp, with the indicator contracting by more than 33% over just three trading sessions.
- Historically, such rapid contractions into risk-off territory signal short-term challenges for the S&P 500, particularly over the subsequent 3 to 14 days.
A weight-of-the-evidence indicator shifts to an unfavorable condition for stocks
Following a sideways, choppy start to the year, the stock market has continued a more orderly decline. As noted in a report last week, the triggering of the S-TCTM Risk Warning Model foretold that the stock market was likely entering a consolidation or corrective phase.
The SentimenTrader team emphasizes two indispensable market analysis concepts in our research reports, among many others: the strategic use of composite models and the identification of reversal signals.
The significance of a composite indicator lies in its ability to minimize the risk of failure, a common drawback when relying on a single metric. Furthermore, the application of reversal signals enhances the risk-reward ratio of trading signals, avoiding the peril of trying to "catch a falling knife."
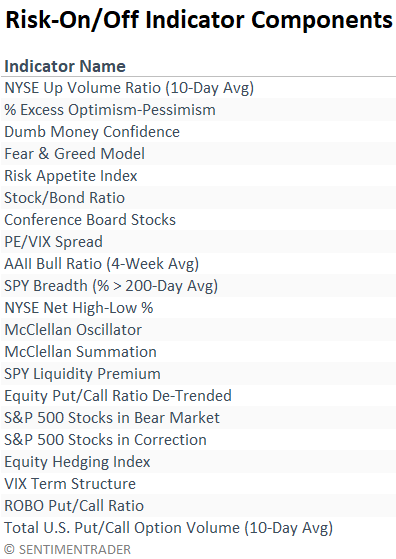
Previously, a swing trading system that uses the proprietary SentimenTrader Risk On/Off Indicator-a composite encompassing 21 diverse sentiment and breadth-based measures-triggered a new sell signal when it fell below 35.
As the sentiment indicators suggest, last Friday the composite index broke below the crucial 35% threshold, marking the market's entry into a risk-off regime. Historical experience demonstrates that this type of market environment is generally unfavorable for equity returns.
The last time this warning was issued was in November 2025; over the subsequent three days, the S&P 500 Index declined by 2%.
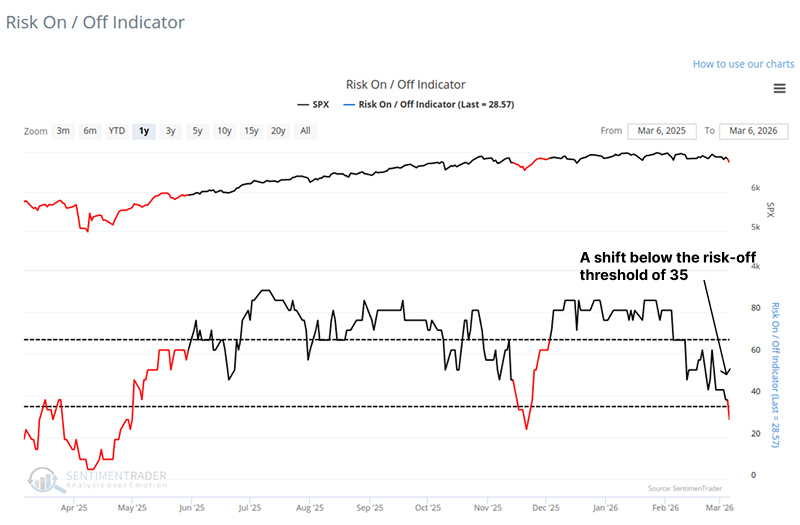
As shown in the table below, the Risk On/Off Indicator blends a broad spectrum of sentiment and breadth metrics, designed to capture market behavior across various indices, exchanges, and investor perspectives.
Returns are significantly stronger in a Risk-On environment
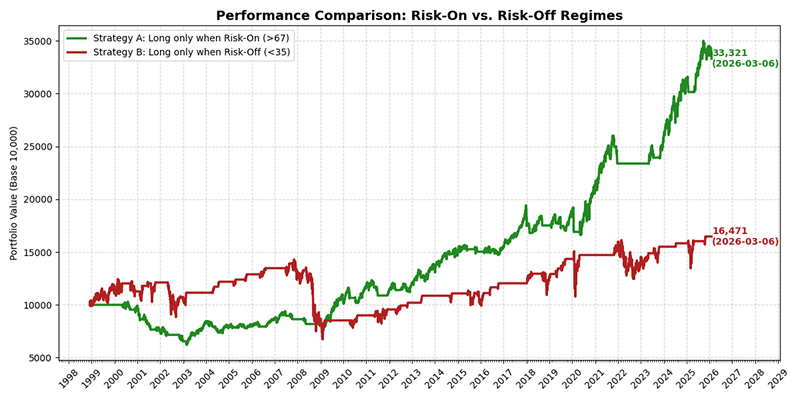
When examining binary overlay models (such as the Risk On/Off Indicator), one way to gauge the strategy's effectiveness is to evaluate the performance of an initial capital investment under the two distinct market regimes (Risk-On vs. Risk-Off).
If one invested $10,000 in the S&P 500 only when the Risk On/Off Indicator rose above 67% and remained above 35%, that investment would have grown to $33,321. Conversely, if one invested only when the indicator dropped below 35% and remained below 67%, the investment would have grown to merely $16,471.
Sharp and sudden shifts in indicators provide useful insights
With stocks retreating, the SentimenTrader Risk On/Off Indicator contracted meaningfully over the last three trading sessions. Last Friday, the 3-day rate of change (ROC3) for the indicator plunged by more than 33%.
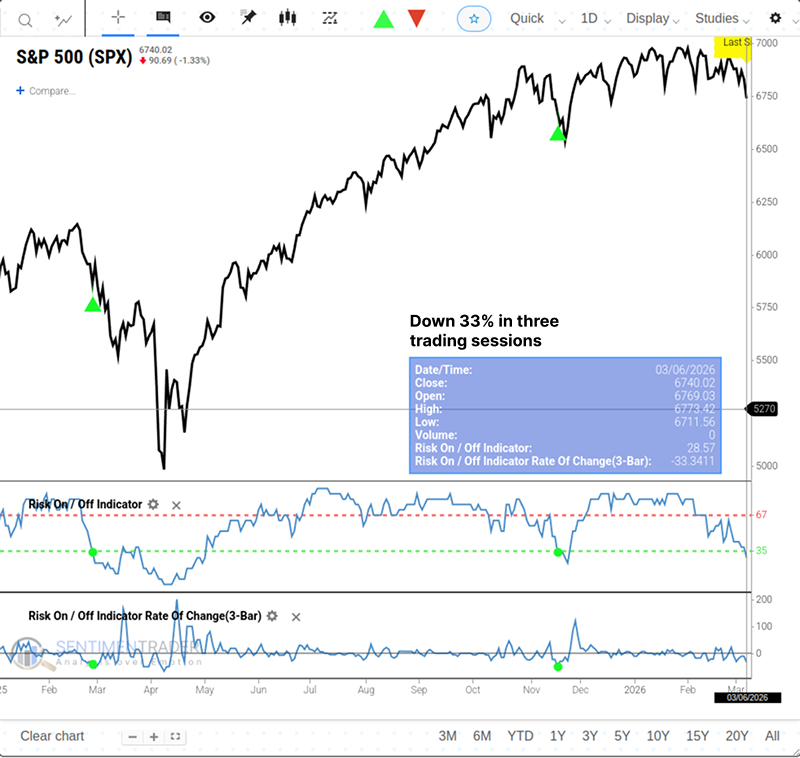
To ensure clarity in our analysis, we established a rule: a new alert can only trigger if the indicator had previously exceeded an 85% threshold. Furthermore, we stipulate that the composite indicator must be below 35% to ensure the historical setups match the current signal's conditions. For related backtest, click here.
Similar rapid contractions in risk appetite suggest the stock market will struggle
Whenever the Risk On/Off Indicator drops by 33% over three consecutive trading sessions and falls below 35, the S&P 500 usually faces short-term challenges, with weak win rates and returns across near-term timeframes. This weakness is particularly acute looking three days out, where the world's most representative index has a 63% probability of declining, highlighting the short-term nature of this specific alert.
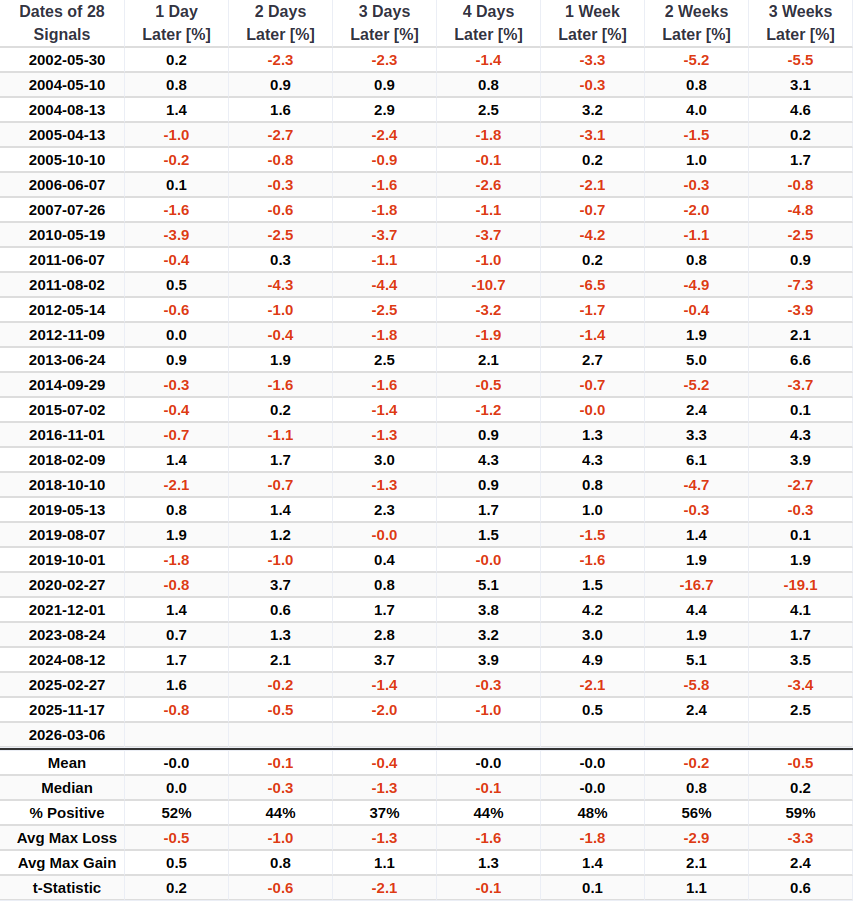
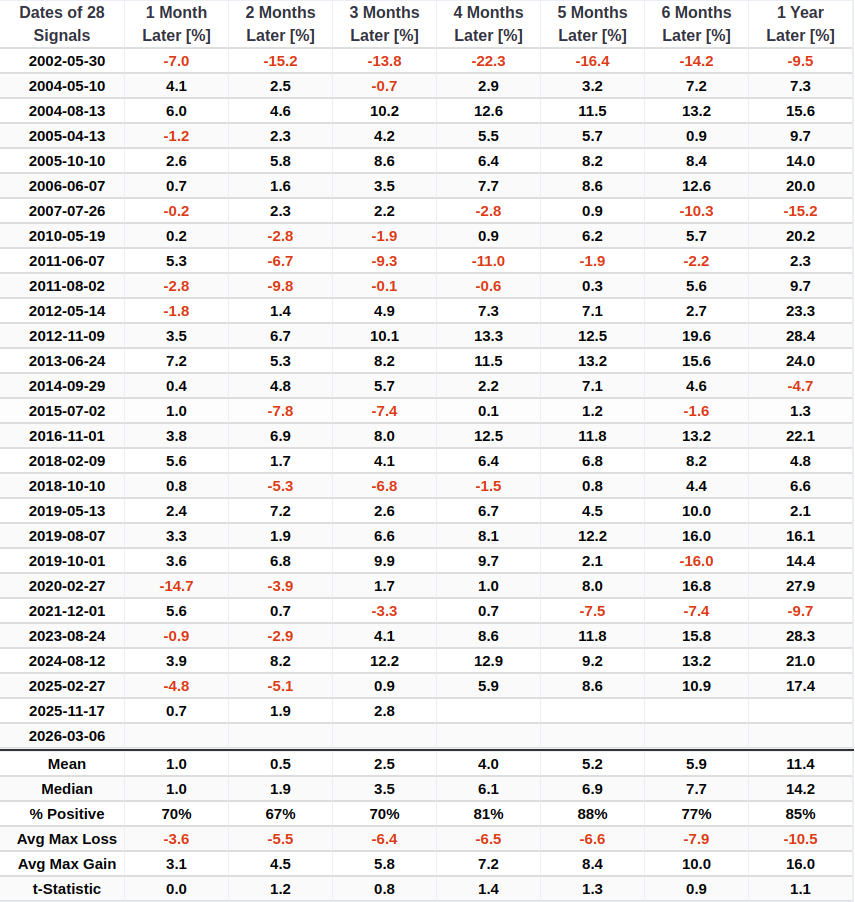
However, looking out four to twelve months later, the S&P 500 boasts robust win rates and returns.
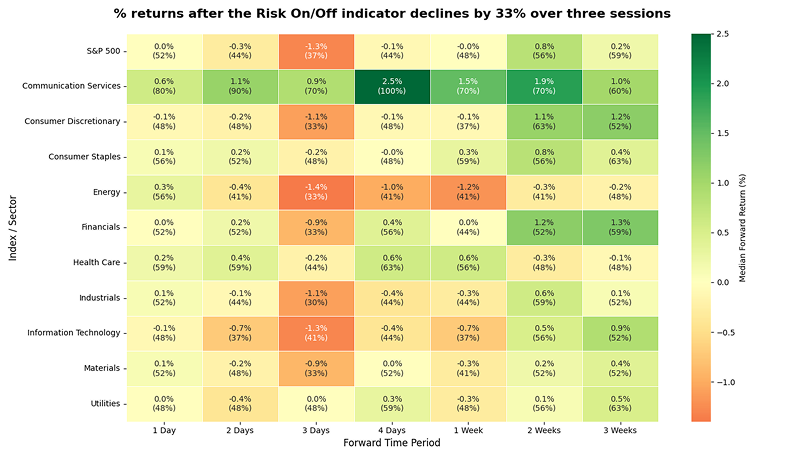
Unsurprisingly, in the days following this signal, defensive sectors such as Consumer Staples and Utilities tend to outperform other sectors, which aligns with their historical behavior during market drawdowns.
What the research tells us...
Multiple components within the risk appetite index have deteriorated, causing the index to plummet over 33% in just three trading days. Such downward trends typically lead to weak returns for the S&P 500 in the near term, with the worst often unfolding days later. During this fragile period, investors should anticipate heightened market volatility and favor defensive strategies.