
TradingEdge Weekly for Apr 17 - Election cycle seasonality, VIX regime shifts, liquidity signals, NASDAQ breadth thrust, volatility metrics

Key points:
- Calmer market regime and VIX reversal signal
- Volume-based liquidity premium triggers risk-on
- NASDAQ breadth thrust signals momentum shift
- Historical favorability of election cycle months
- New tools for measuring market turbulence
House view:
- Stocks:
- Short-term: Bullish. U.S. equities continue to extend their historic run, supported by a decisive shift toward a risk-on regime as reflected in both VIX and CDX compression. Drawing a historical analog to this time last year, a similar drawdown in volatility acted as a catalyst for a sustained six-month grind higher in the S&P 500. Broader technicals remain highly constructive. Barring a severe macro degradation, equities are well-positioned for further upside. This time frame covers 1-4 weeks.
- Intermediate-term: Modestly Bullish. Market momentum (61.9) has improved significantly, but the market has not yet returned to a risk-on mode. All major indices are trading well above their 50-day and 200-day moving averages, with broad-based market breadth confirming the strength of the rally. The S&P 500 Liquidity Premium indicator has officially triggered a risk-on alert, indicating a shift from market uncertainty back to confident participation. However, the market remains in a mixed phase-geopolitical concerns persist. This time frame covers 1-5 months.
- Long-term: Bullish. The long-term bull market structure remains firmly intact, with the breakout to new all-time highs confirming the underlying strength of the uptrend. Sustained volume and sector rotation validate the breakout as a sustainable move. The S&P 500 Average Trend score is currently testing a critical inflection point. A decisive breakout above the 5.0 threshold would trigger a risk-on signal, confirming a broader bullish regime. This time frame covers 6-12 months.
- Overweight: Financials with strong earnings beats, AI core assets with proven monetization, and cyclical sectors benefiting from economic resilience
- Underweight: Overvalued luxury consumer names and companies with weak earnings guidance
- Monitor Japanese equities for alpha opportunities amid yen weakness and geopolitical relief
- Bonds: Long-term cycles remain bearish. The Treasury yield curve steepens, with the 10-year yield holding steady at 4.31% and the 10Y-2Y spread widening to +54 bps. Historically, April has typically been one of the months in which TLT has underperformed.
- Commodities: The complex remains in a state of high volatility, driven by ongoing geopolitical negotiations and central bank demand.
- Crude Oil: High volatility. The crude closes flat at $94. Prices are balanced between expectations for an extended ceasefire and lingering risks of renewed conflict in the Middle East.
- Gold & Silver: Range-bound. Even as equities print fresh all-time highs and broader haven demand recedes, the precious metals complex has shown remarkable resilience, consolidating near cycle highs without yielding to any material retracement.
- Crypto: We follow several simple systems for U.S.-traded bitcoin, which we consider the equivalent of the S&P 500 for crypto. Amid the market's paradigm shift to real assets and fiat credit doubts, crypto assets face valuation revaluation pressure from tech stock sell-off contagion, but long-term fundamental support from tokenization remains. Market volatility rises with the overall financial market, and short-term price performance is dominated by risk appetite shifts, with structural opportunities tied to institutional adoption and underlying technology innovation.
- Triple 40: Bearish
- RSI Momentum: Bearish
- Trend and Relative Trend: Bearish
- PMI: Bullish
- M2 ROC: Bullish
- Notable Moves in Global Markets:
- Japan: The Nikkei 225 hitting a new all-time high. Gains are driven by relief over extended Middle East ceasefire prospects (a major positive for energy-import-dependent Japan) and strength in technology stocks following U.S. AI momentum.
- Hong Kong: The Hang Seng Index edges up, supported by stronger-than-expected Chinese Q1 GDP growth of 5.0% YoY, which provided a fundamental floor for Chinese blue chips despite global volatility.
Where we're at
Most investors have the most riding on equities. We feel that the most significant determinants of success for investors are whether to adjust their allocation to that asset class based on factors that have historically had a good record of preceding above- or below-random returns in the months ahead.
Those factors include the probability of a looming recession, sentiment, price action, volatility, breadth, and the bond market. The chart below summarizes the main indicators and composite models we watch for those factors, and they're mostly in bullish regimes. Valuations are not part of these factors since the relationship has been too inconsistent on time frames under one year.
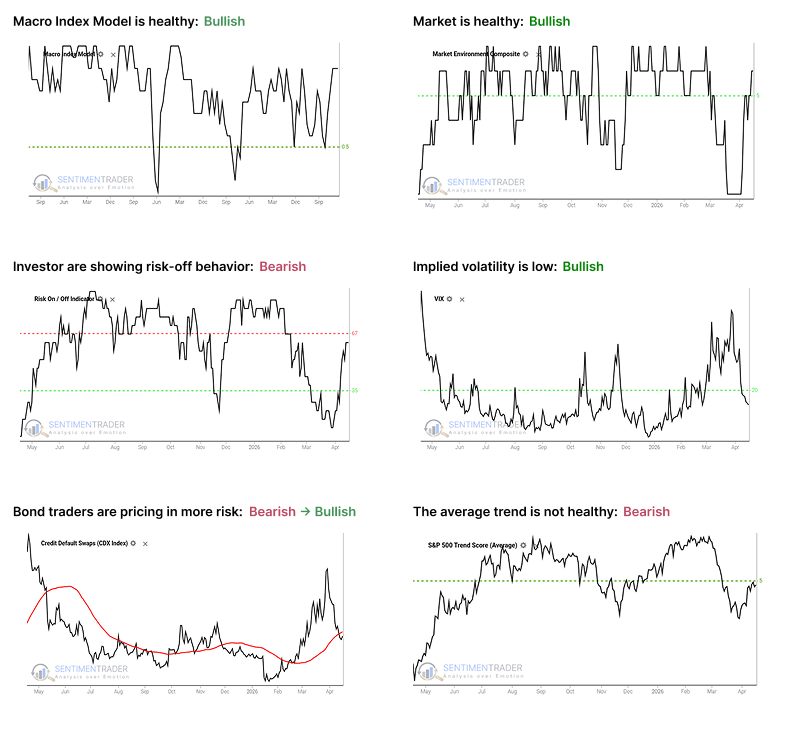
- The Macro Index Model is above the 50% threshold, which has been a vital level as outlined here.
- The Market Environment has been skittish, but is currently healthy. Future returns, especially for higher-beta indices, has been markedly better, with less risk, when the environment is healthy as outlined here.
- The Risk On / Off Indicator shows that investors are now in risk-off mode. This has historically been a warning sign for weak future returns as outlined here.
- Implied volatility remains below 20, showing a calm environment. The S&P 500 has perfomed well when this is the case as outlined here.
- Credit default swap spreads are below their 50-day moving average, which drastically improves stock returns as outlined here.
- A composite of trend measures in the average S&P 500 stock have dropped below 5, which shows weak trend conditions.
Return of calm conditions & VIX signal
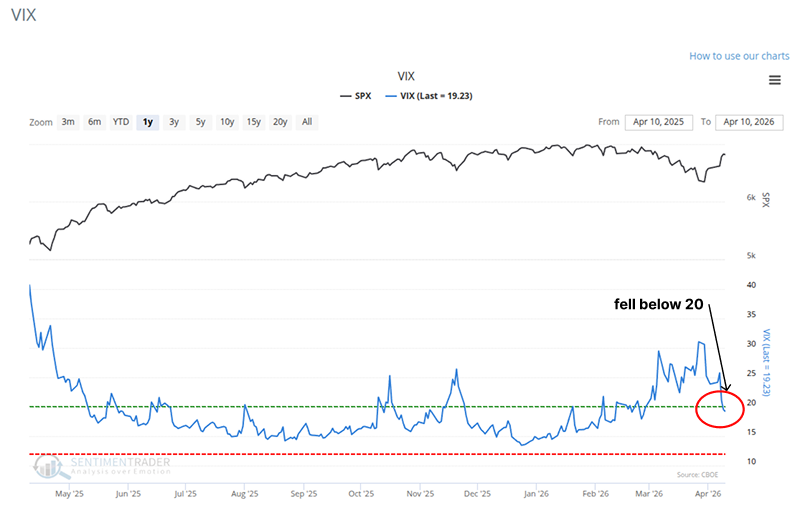
Investors don't like uncertainty. Uncertainty breeds volatility, and elevated volatility increases the probability of seeing deep drawdowns. Conversely, when market conditions are calm, institutions and retail traders alike are far more likely to deploy capital. Implied volatility fell below 20 last week, confirming a transition back into a calm environment.
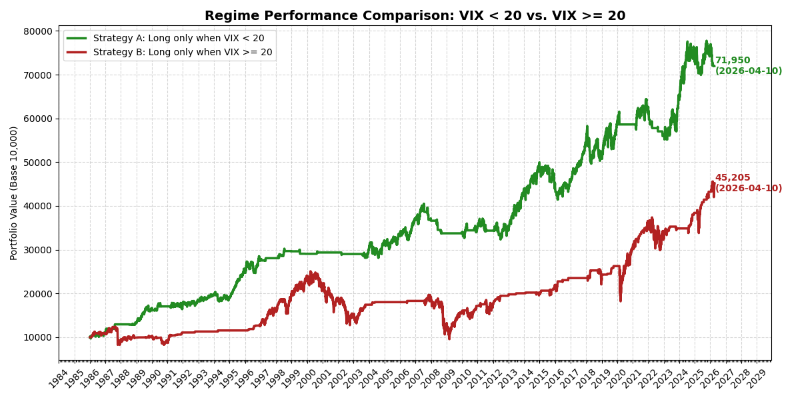
The chart below provides clear evidence of this dynamic. When the VIX 'fear gauge' is sitting below 20, the S&P 500 has historically fared much better on a next-day return basis compared to when the VIX is elevated. In fact, during these periods of low volatility, total returns are more than 1.5 times higher than usual.
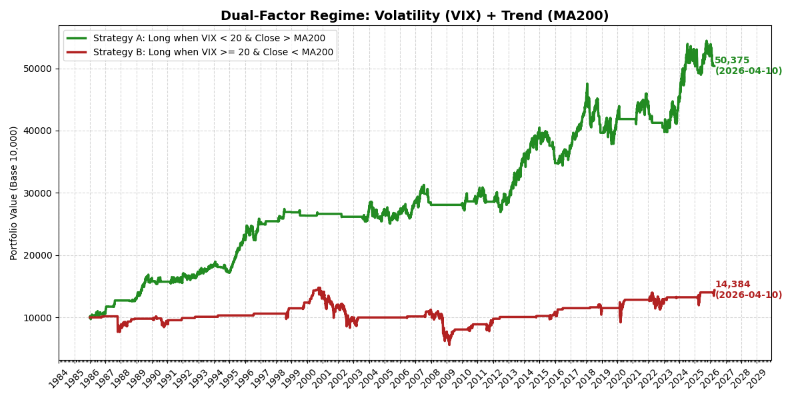
This should provide significant relief to investors, as the VIX has finally closed below 20. Not only that, but the S&P 500 has simultaneously climbed back above its 200-day moving average. While waiting for both conditions reduced overall returns, if neither condition was in force, it proved a disastrous time to be an investor.
When a streak of VIX prints above 20 finally ends, and the S&P 500 is concurrently trading at least 2% above its long-term average, forward returns improve dramatically. Running this test reveals the forward performance of other key equity benchmarks. Among the majors, the Dow Jones Industrial Average matched or slightly outperformed the S&P 500.
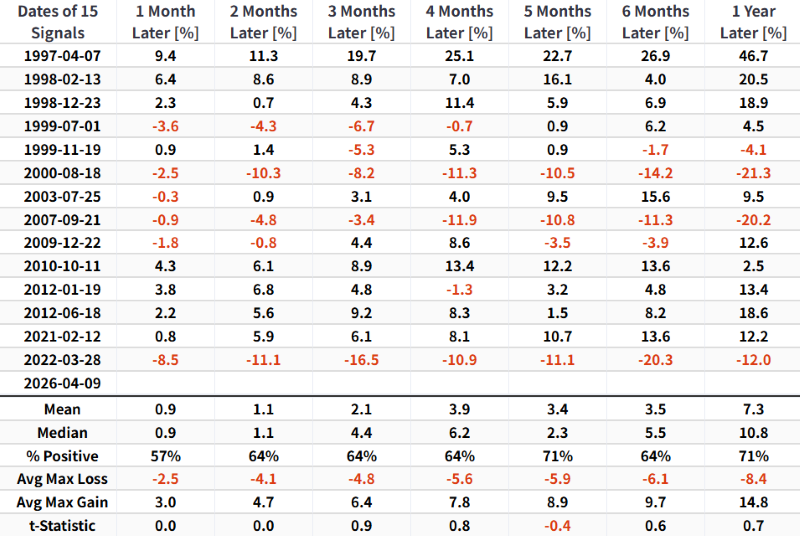
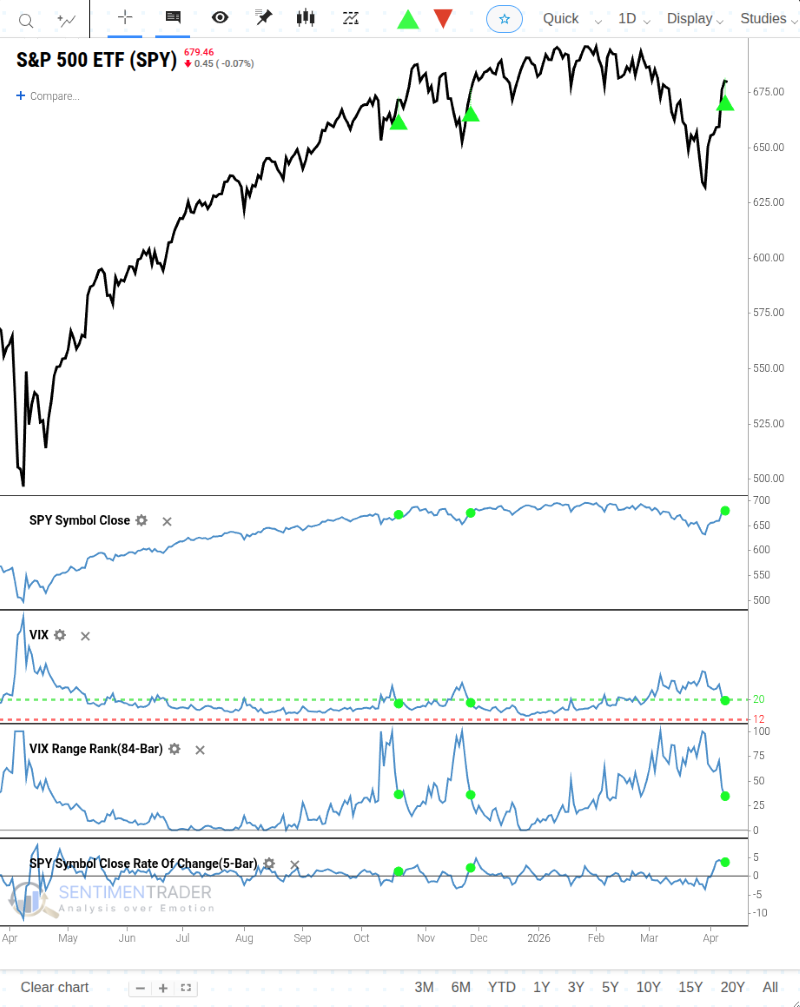
The VIX Range Rank signal seeks to identify historical instances where the 4-month range rank for the VIX violently reverses from a period of high volatility to low volatility. The quantitative model triggers a buy when the range rank crosses above 99.9, then below 40, and the SPY 5-day ROC is > 0% within 10 days. The performance results look incredibly solid. Because the current V-shaped bounce has been even more aggressive than prior instances, the market has likely already pulled forward a significant portion of the near-term upside.
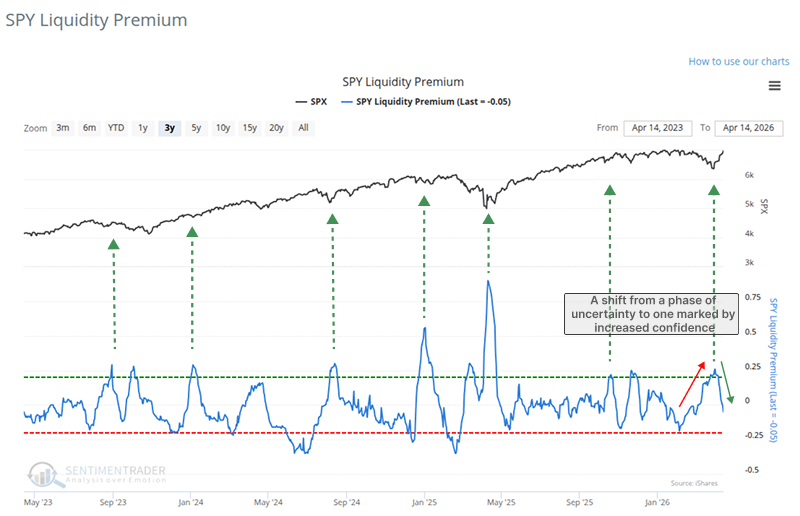
Volume-Based Liquidity Premium Triggers Risk-On
The S&P 500 Liquidity Premium indicator compares the volume of the S&P 500 ETF (SPY) to the volume of the underlying stocks. When volume in the ETF increases relative to stocks, the indicator rises, indicating uncertainty. Eventually, confidence returns and volume increases in individual stocks, causing the indicator to shift lower.
By applying a range rank and optimizing the lookback period, the model identifies when trader sentiment eases. The buy signal occurs when the range rank cycles from above 99% down to less than 42%.
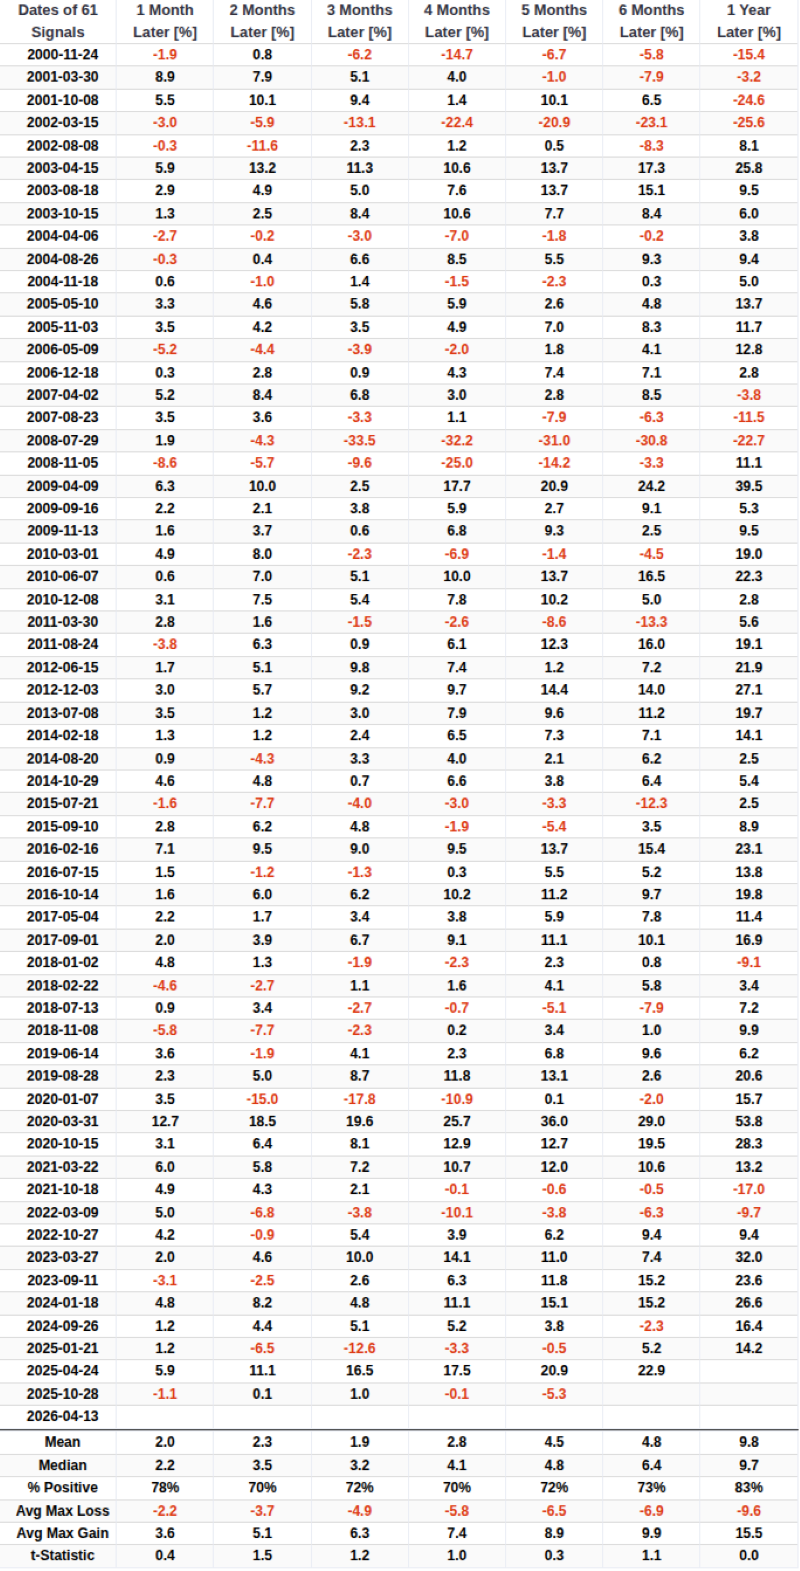
Suppose we require the SPY ETF to trade above its 200-day average when a reversal signal triggers. Uptrend precedents show slightly better win rates. Conversely, the inverse setup serves as a risk-off signal, historically preceding S&P 500 declines in 14 out of 16 cases over the next month.
NASDAQ Breadth Thrust Signals Momentum Shift
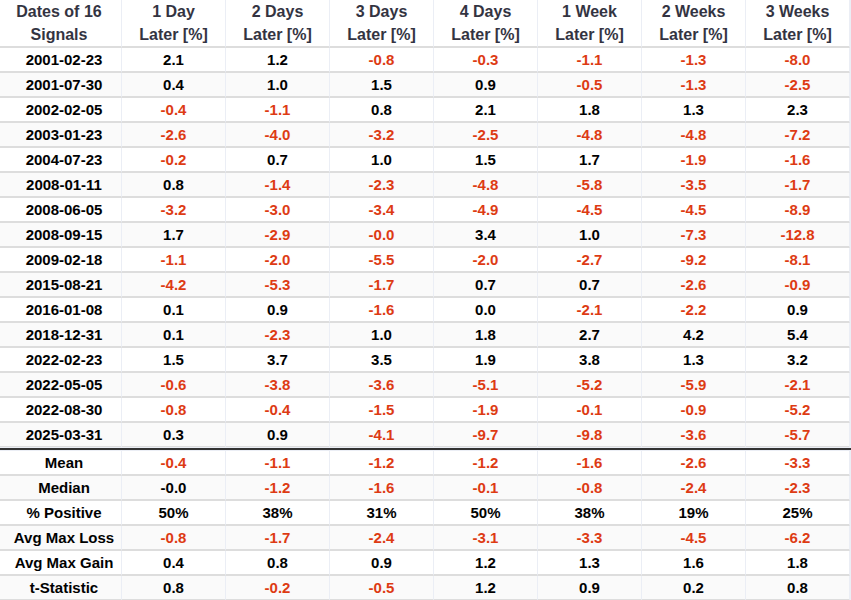
I define a NASDAQ Breadth Thrust (NBT) where E = ((10-day total of Advances / 10-day total of Advances & Declines) * 100). A new NBT occurs when Variable E closes at 62% or higher. A new NBT occurred on April 14th, 2026.
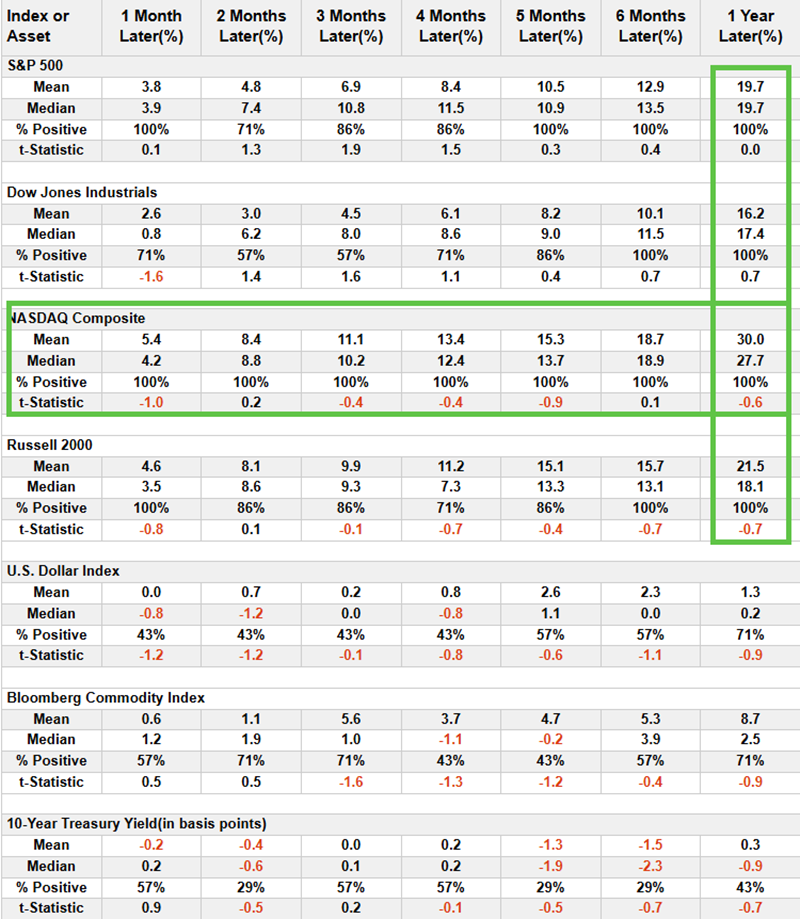
The table below summarizes the results of previous signals.
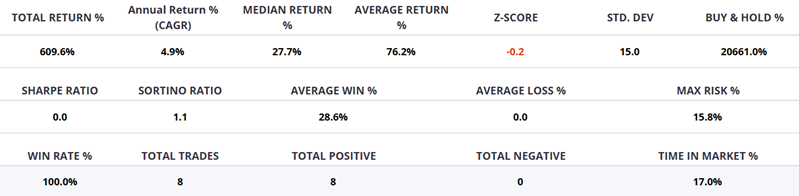
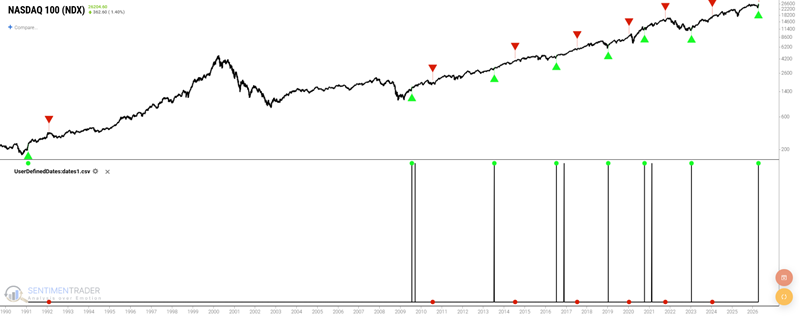
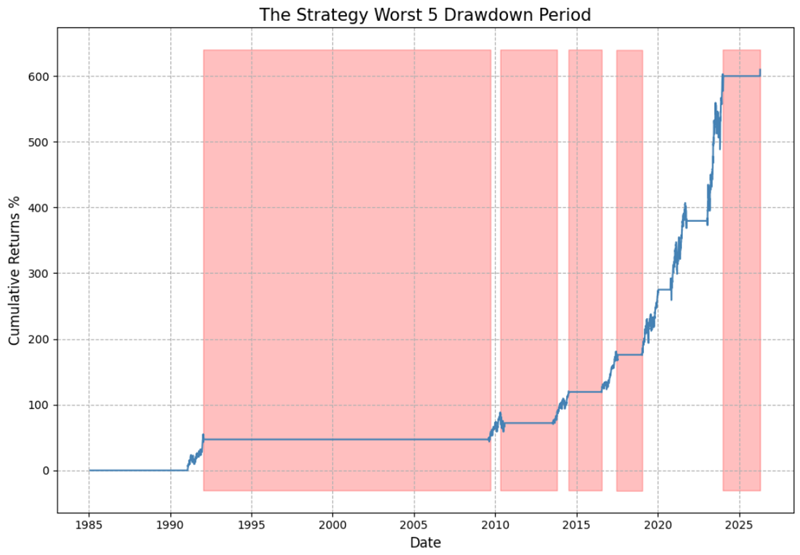
The chart below shows the hypothetical cumulative % gain achieved by holding the Nasdaq 100 Index for 252 trading days after every previous NBT signals.
Historically, the Nasdaq 100 index outperformed other major stock indexes, such as the S&P 500 and Russell 2000, following these signals. Corporate insiders among Nasdaq 100 companies have been buying heavily, aligning with this momentum shift.
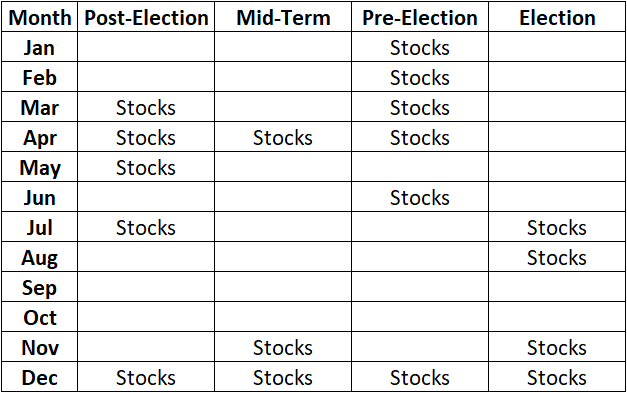
Historical Favorability of Election Cycle Months
The Election Cycle spans 12 months per year across four years. The theory is that the stock market performs better during certain months within this 48-month cycle. The 18 months labeled 'Stocks' are considered favorable.
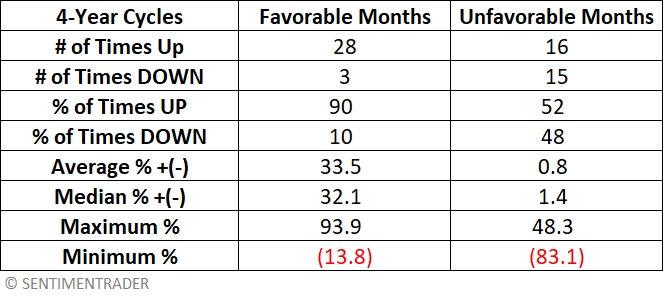
From 1899 through 2022, the strategy gained +617,034% during 'favorable' months and lost -75% during 'unfavorable' months. Favorable months showed a gain 66.5% of the time with an average monthly return of +1.71%. Over 4-year cycles, investing only during favorable months yielded a gain 90% of the time, averaging +33.5% per cycle.
New Tools for Measuring Market Turbulence
New Historical Volatility indicators measure true market turbulence using daily log returns to normalize price changes. We calculate the sample standard deviation σ over a specific time window (20-day and 60-day), then annualize it: HV = σ × √252 × 100.
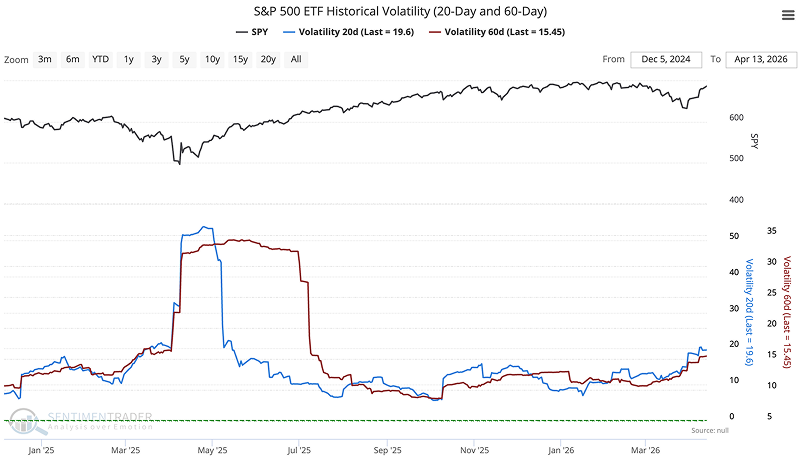
Here, we provide both short-term and medium-term historical volatility. Sorting in descending order instantly spotlights high-volatility assets. Traders can also create a 'volatility ratio' (Asset HV / SPX HV) to spot outliers; when the ratio exceeds 2.0, the stock moves 2x more erratically than the index.
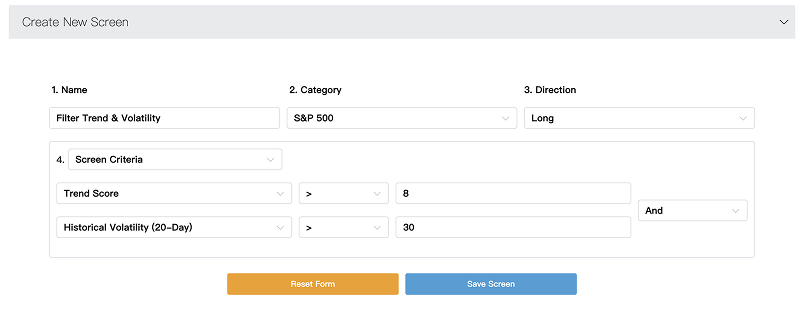
We've also added a Volatility filter to My Screen page, allowing granular sector screening. Using HV > 30 and Trend Score > 8 quickly isolates high-conviction, high-volatility candidates.
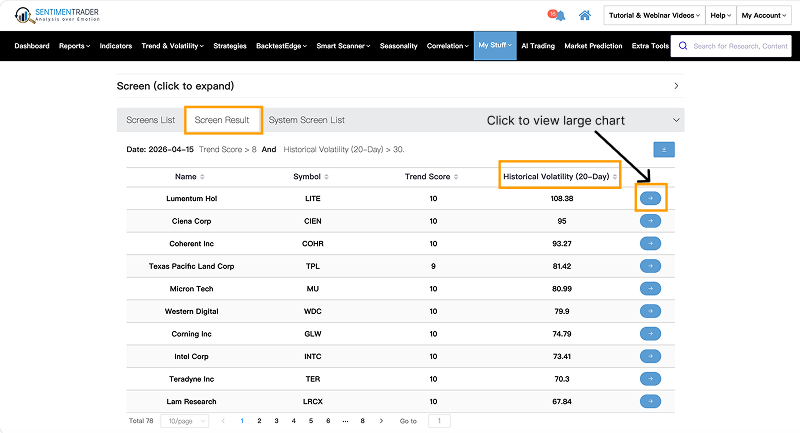
Here are the results:
About TradingEdge Weekly...
The goal of TradingEdge Weekly is to summarize some of the research published to SentimenTrader over the past week. Sometimes there is a lot to digest, and this summary highlights the highest conviction or most compelling ideas we discussed. This is NOT the published research; rather, it pulls out some of the most relevant parts. It includes links to the published research for convenience, and if you don't subscribe to those products, it will present the options for access.