
TradingEdge Weekly for Apr 10 - NFP beat impact, Nasdaq breadth recovery, aggregate signal breakdown, energy sector flush

Key points:
- Historical market impact of massive NFP beats and subsequent asset rotations
- Aggregate Signal Model breakdown clashes with bullish smart money positioning
- Nasdaq 100 rapid breadth recovery signals high-probability upside
- Energy sector and crude oil double flush highlight mean-reversion and defensive rotation
- Seasonal and price confirmation setups for Natural Gas and Soybeans
- Put/call extremes and contrarian sentiment indicators flash hopeful signs
- Industry bear market percentages and WTI/Gold ratio weigh evidence favorably
House view:
- Stocks:
- Short-term: Modestly Bullish. U.S. equities stage a historic "V-shaped" rebound, with two major indices (S&P 500, Nasdaq) posting seven consecutive days of gains. The S&P 500 rises 0.62% to 6,824.66, the Nasdaq gains 0.83% to 22,822.42, and the Dow Jones climbs 0.58% to 48,185.80. Core catalysts include a fragile two-week ceasefire between the U.S. and Iran (easing Strait of Hormuz blockade fears) and a blowout March nonfarm payroll report (+178k jobs vs. 65k expected) that shattered recession fears. Technicals confirm full bullish momentum, with the VIX falling below 20. However, we must remain vigilant against a renewed escalation of regional conflicts. This time frame covers 1-4 weeks.
- Intermediate-term: No view. Market momentum has improved significantly, but the market has not yet returned to a risk-on mode. All major indices have reclaimed both their 50-day and 200-day moving averages, with the S&P 500 breaking above 6,800 and the Nasdaq has also exited its correction territory. Earnings expectations are being revised higher for cyclical, financial, and consumer sectors as hard landing risks recede. This time frame covers 1-5 months.
- Long-term: Bullish. The long-term bull market structure has been revalidated by the rapid recovery of the 200-day moving average, which demonstrated extremely strong buying support. The AI productivity cycle remains intact, and the global economy is showing resilience despite earlier headwinds. Sustained volume confirms the breakout, with broad-based participation across sectors. This time frame covers 6-12 months.
- Overweight: AI core assets, industrial and materials sectors, consumer discretionary, and financials
- Underweight: Defensive sectors that outperformed during the risk-off period, and energy stocks sensitive to falling oil prices
- Maintain small long positions in crude oil or VIX calls to hedge against the risk of ceasefire breakdown in two weeks
- Bonds: Treasury yields stabilize at higher levels, with the 10-year yield trading in a 4.29%-4.34% range and the 10Y-2Y spread holding steady at +51 bps. The strong nonfarm payroll report has reduced expectations for aggressive near-term Fed rate cuts, but cooling geopolitical tensions have also capped upside in long-term inflation expectations. Yields have found a new equilibrium, with limited immediate downside or upside pressure until the next major inflation or policy catalyst.
- Commodities: Extreme volatility persists as markets digest the fragile U.S.-Iran ceasefire, with no clear directional trend across the complex. The crude rebounds 3.66% to $97.87, following a historic 16% single-day plunge on ceasefire news. Prices remain trapped in a news-driven range, with upside risks from continued Israeli military action in Lebanon and lingering shipping safety concerns in the Strait of Hormuz, and downside risks from a lasting peace agreement. Gold trades near $4,800, while silver ranges between $73-$75. Strong equity market performance has reduced safe-haven demand, leaving gold and silver without a clear near-term catalyst for a breakout.
- Crypto: We follow several simple systems for U.S.-traded bitcoin, which we consider the equivalent of the S&P 500 for crypto. Amid the market's paradigm shift to real assets and fiat credit doubts, crypto assets face valuation revaluation pressure from tech stock sell-off contagion, but long-term fundamental support from tokenization remains. Market volatility rises with the overall financial market, and short-term price performance is dominated by risk appetite shifts, with structural opportunities tied to institutional adoption and underlying technology innovation.
- Triple 40: Bearish
- RSI Momentum: Bearish
- Trend and Relative Trend: Bearish
- PMI: Bullish
- M2 ROC: Bullish
- Notable Moves in Global Markets (Data current as of April 08, 2026 ):
- Europe: Global outperformer on Wednesday, with the STOXX 600 surging 3.9%, Germany's DAX jumping 5.1% to 24,080.63, and France's CAC 40 rising 4.5% to 8,263.87. The region's extreme sensitivity to energy prices makes it the biggest beneficiary of falling oil costs, with airlines and travel stocks leading gains. Energy stocks underperform sharply amid the crude selloff.
- Japan: The Nikkei 225 skyrockets 5.4% to 56,308.42, recouping all recent losses. Gains are driven by a rebound in global risk sentiment, and better-than-expected Tankan survey data.
- Hong Kong & Mainland China: The Hang Seng Index rallies 3.1% to 25,893.02, supported by dual catalysts: a stronger-than-expected March manufacturing PMI (50.4, a 12-month high) and renewed foreign capital inflows.
Where we're at
Most investors have the most riding on equities. We feel that the most significant determinants of success for investors are whether to adjust their allocation to that asset class based on factors that have historically had a good record of preceding above- or below-random returns in the months ahead.
Those factors include the probability of a looming recession, sentiment, price action, volatility, breadth, and the bond market. The chart below summarizes the main indicators and composite models we watch for those factors, and they're mostly in bullish regimes. Valuations are not part of these factors since the relationship has been too inconsistent on time frames under one year.
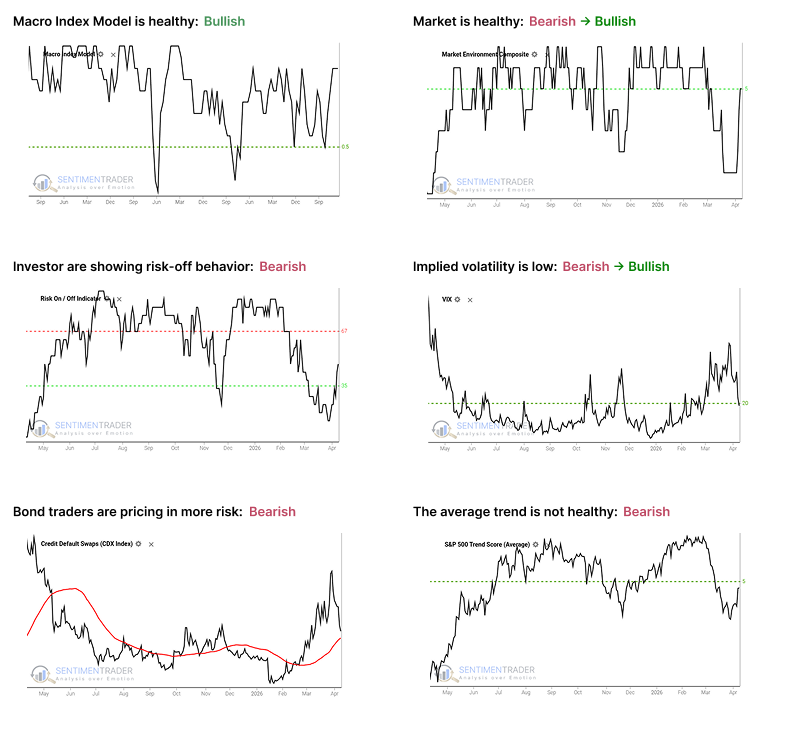
- The Macro Index Model is above the 50% threshold, which has been a vital level as outlined here.
- The Market Environment has been skittish, but is currently healthy. Future returns, especially for higher-beta indices, has been markedly better, with less risk, when the environment is healthy as outlined here.
- The Risk On / Off Indicator shows that investors are now in risk-off mode. This has historically been a warning sign for weak future returns as outlined here.
- Implied volatility remains below 20, showing a calm environment. The S&P 500 has perfomed well when this is the case as outlined here.
- Credit default swap spreads are above their 50-day moving average, which is modestly concerning as outlined here.
- A composite of trend measures in the average S&P 500 stock have dropped below 5, which shows weak trend conditions.
Nonfarm Payroll Beat Triggers Short-Term Cyclicality and Gold Rotation
The Bureau of Labor Statistics (BLS) dropped the March employment report last Friday, revealing that the economy added 178k jobs. With the median economist estimate sitting at 65k, the print came in a staggering 113k above consensus.
As the table below illustrates, when NFP beats by >110k, economically sensitive areas of the market-like the Russell 2000 ETF (IWM)-perform the best. Conversely, the 10-Year Treasury struggles with a dismal 20% win rate.
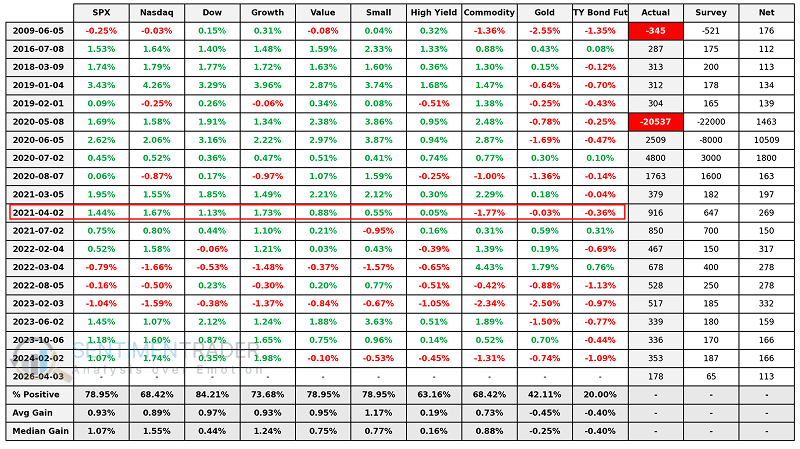
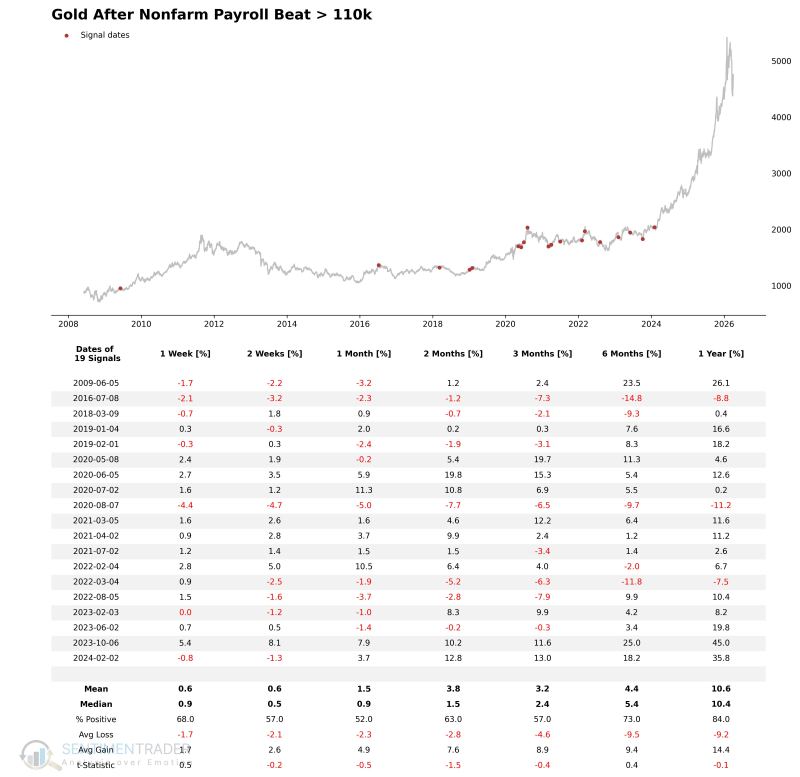
Zooming out, the S&P 500 consistently underwhelms over the subsequent 1-to-4-week timeframe. Gold, however, shines in the 1-to-2-week timeframe, posting notable improvements in both win rate and expected returns compared to the initial release day.
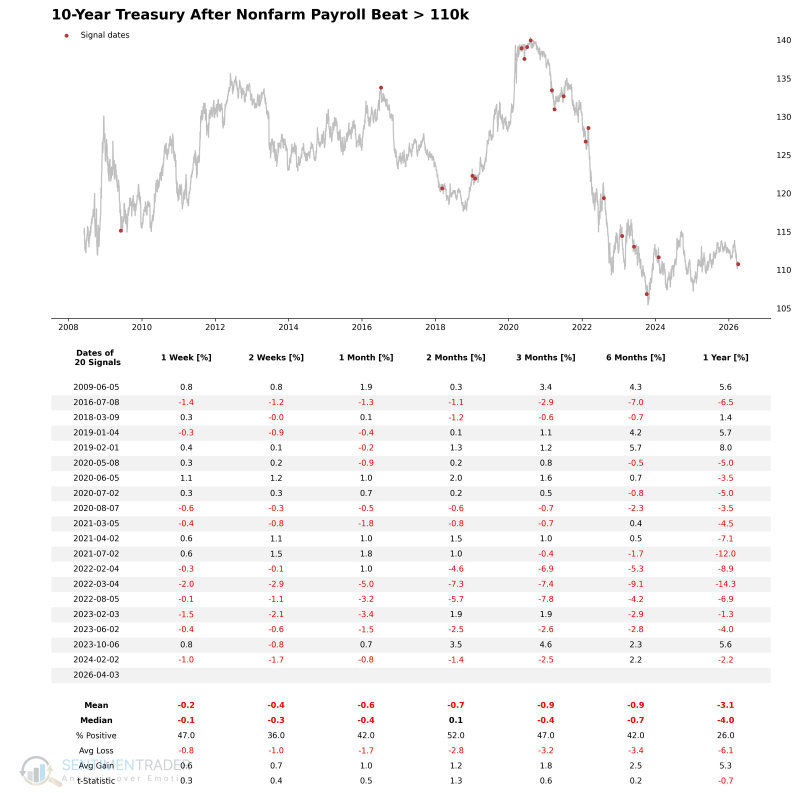
The 10-Year Treasury does not share gold's structural rebound, maintaining a firmly bearish posture through the 1-to-4-week stretch.
Aggregate Model Deterioration Conflicts with Institutional Positioning
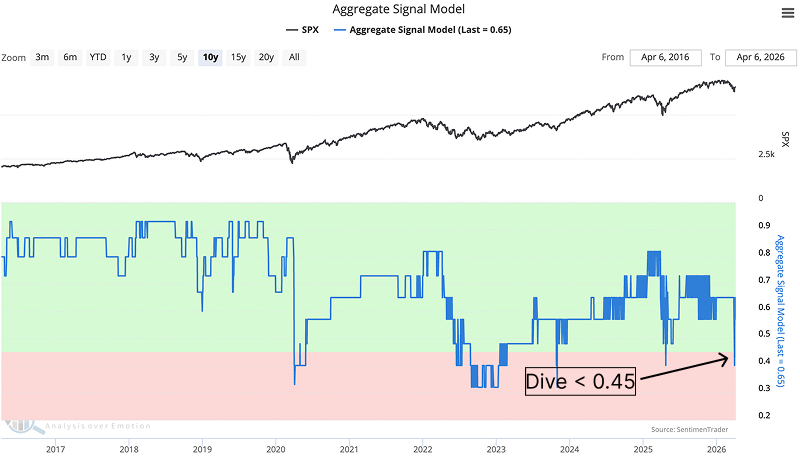
The Aggregate Signal Model just breached the 0.45 threshold, indicating structural deterioration in the broader market. Dropping below 45% suggests narrowing participation and de-risking pressure.
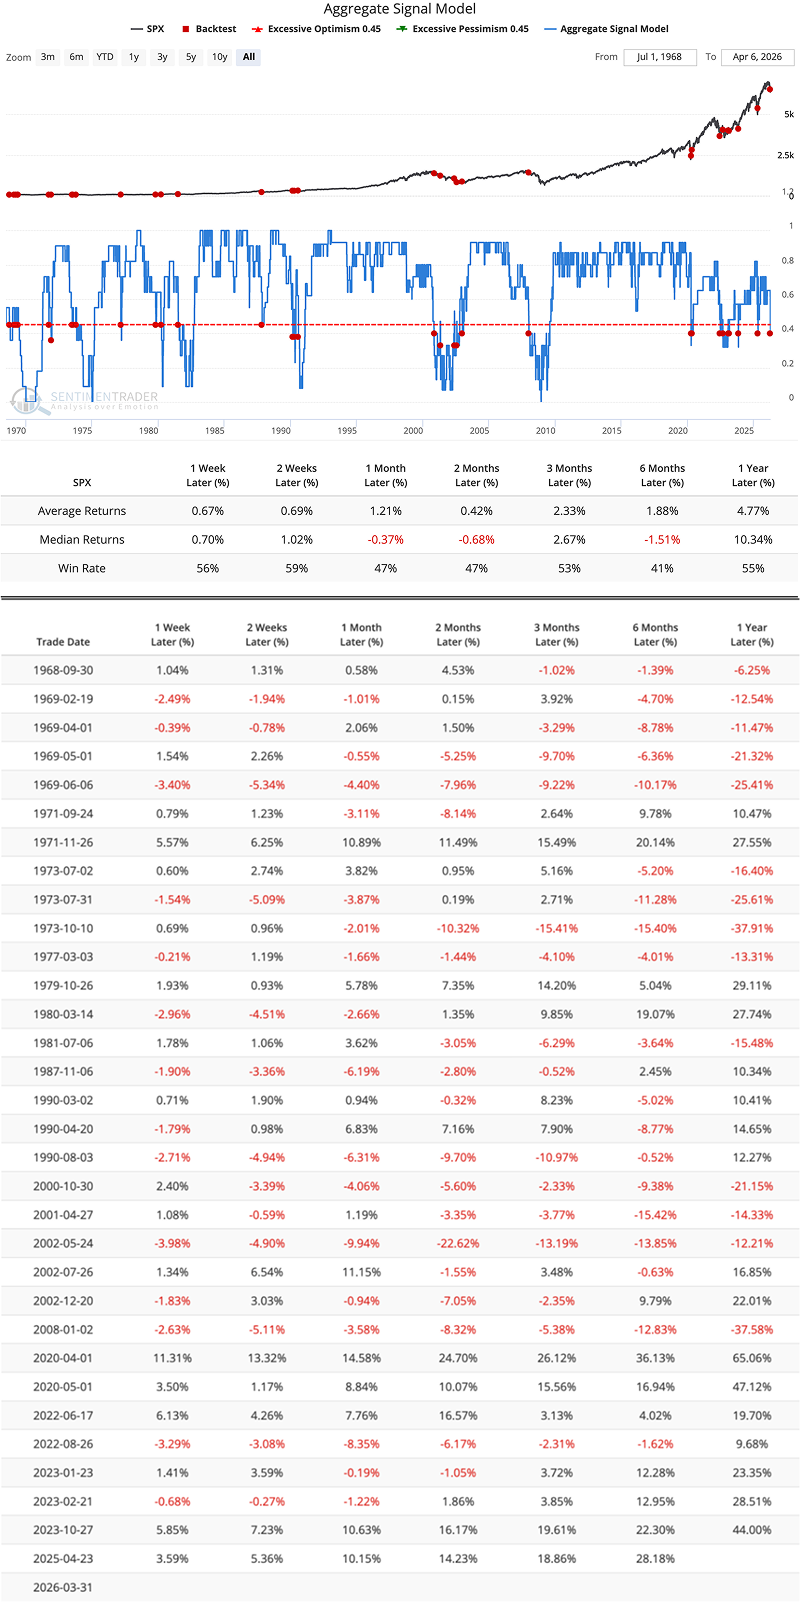
The historical path following these breaks is largely negative, with the S&P 500 higher just 41% of the time over six months. Short-term momentum favors the downside.
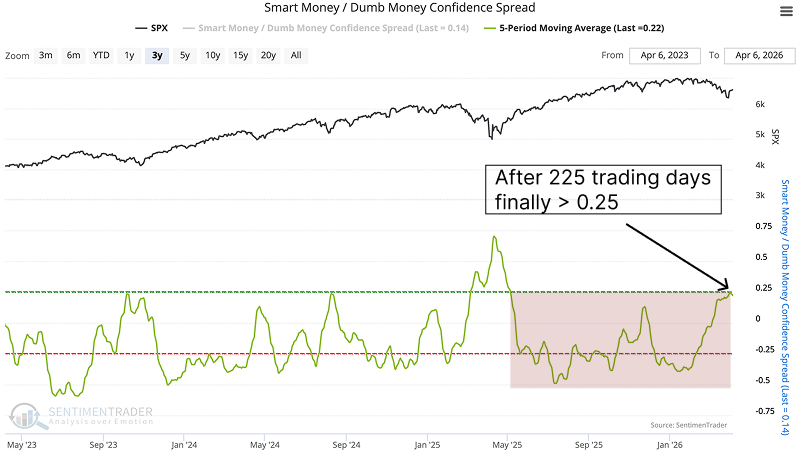
The catch is the sentiment beneath the surface. The 5-period moving average of the Smart Money / Dumb Money Confidence Spread crossed above 0.25 on March 30, terminating a 225-trading-day stretch where institutional confidence lagged retail optimism.
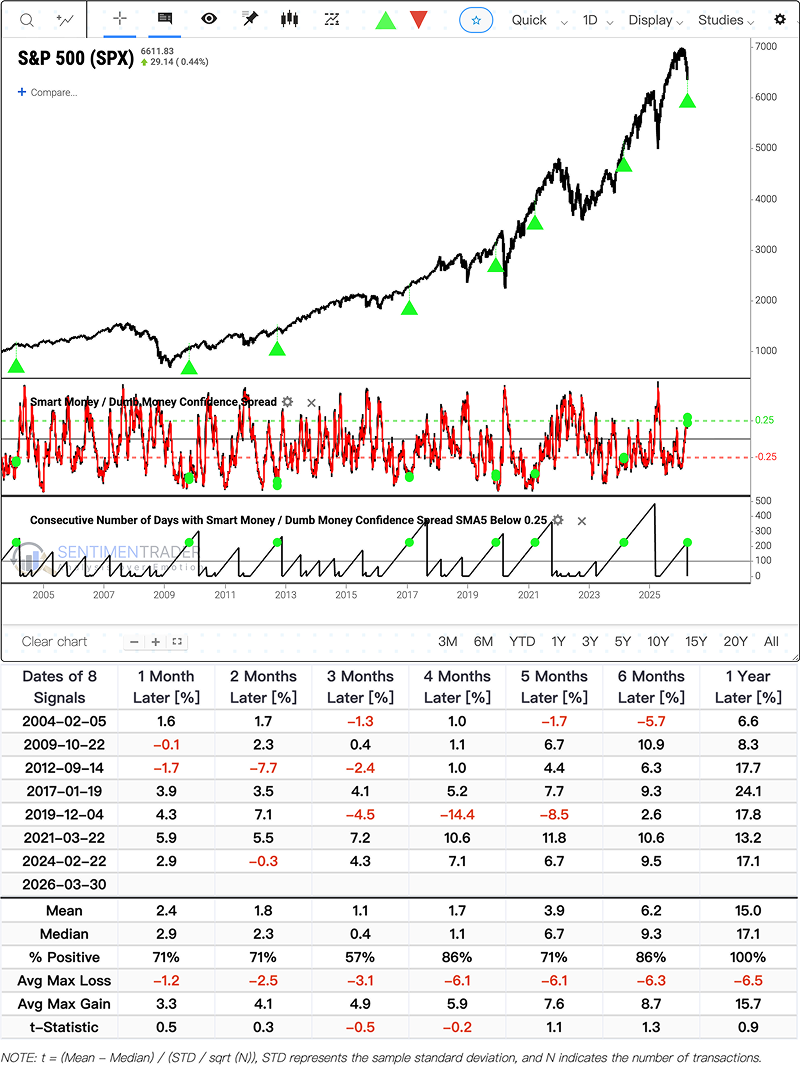
Those seven prior instances heavily favor the bulls over a longer horizon. A year after the signal, the index was higher 100% of the time. The average gain exceeded 15%.
Nasdaq 100 Breadth Reversal Signals High-Probability Rally
The Nasdaq 100 had officially fallen into correction territory, but short-term breadth gauge broke back above the 70 level following a rapid rebound.
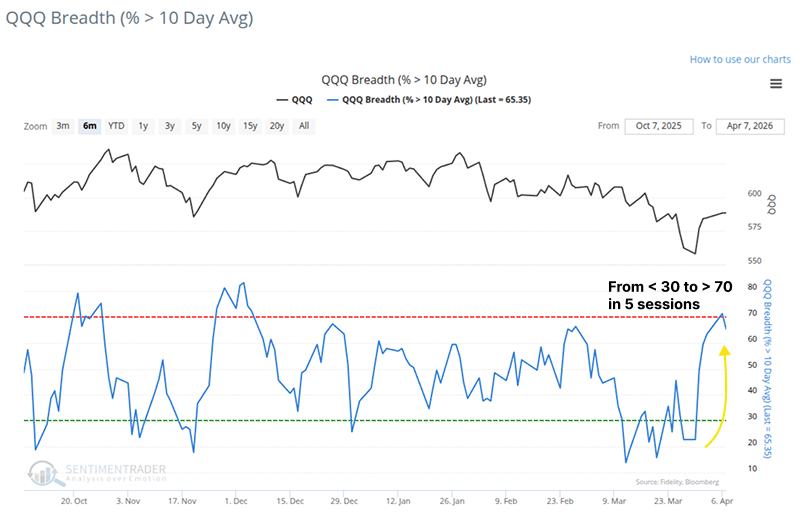
As equities caught a bid, the QQQ Breadth expanded significantly. Such rapid momentum reversals historically yield highly positive forward returns. Whenever the percentage of QQQ components trading above their 10-day moving average spikes from under 30 to over 70 in five days, the QQQ boasts an 80% win rate over a one-year timeframe.
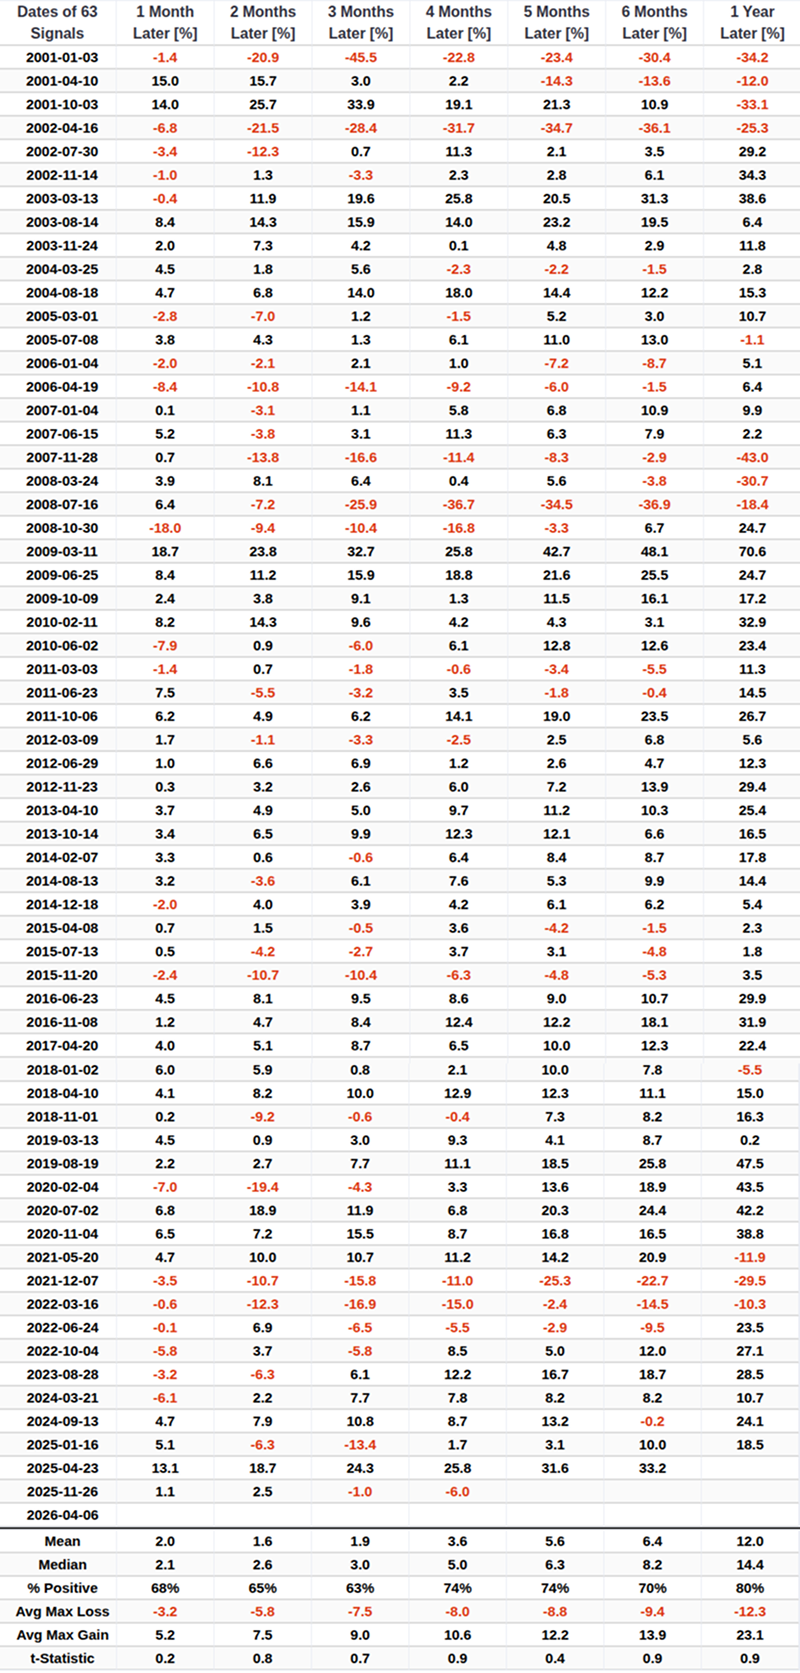
Beyond the Nasdaq, short-term breadth indicators for the Dow and S&P 500 have also staged recovery. When breadth sits at or above 70 across all three major indexes, upward momentum typically sustains.
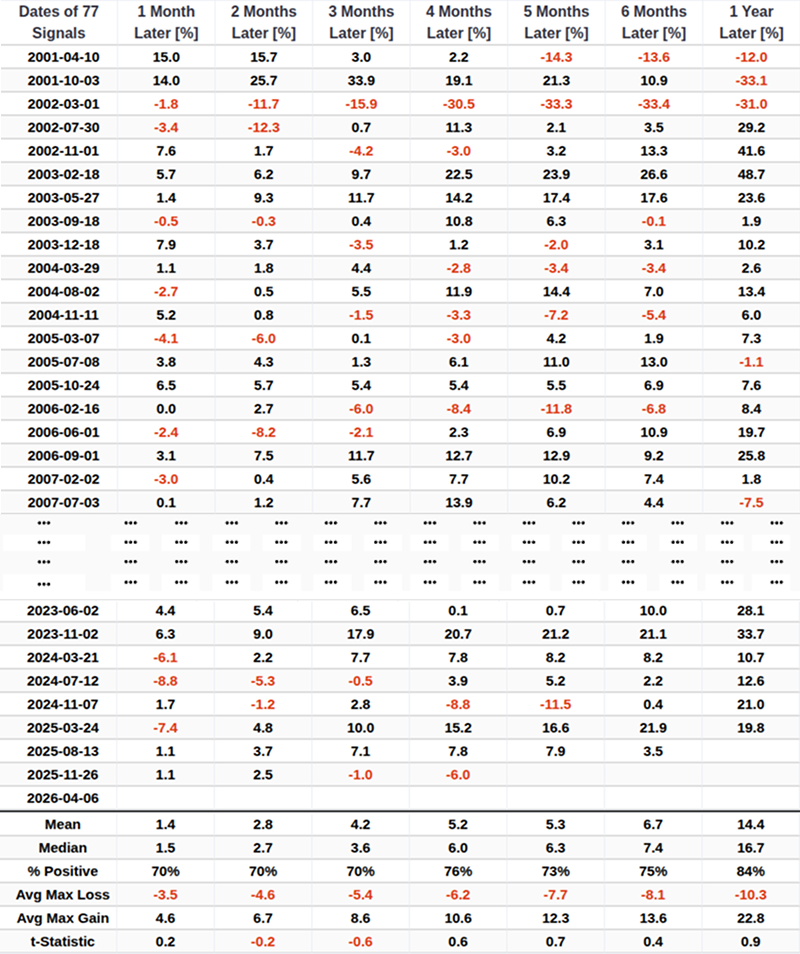
Crude and Energy Double Flush Points to Defensive Rotation and XLE Rebound
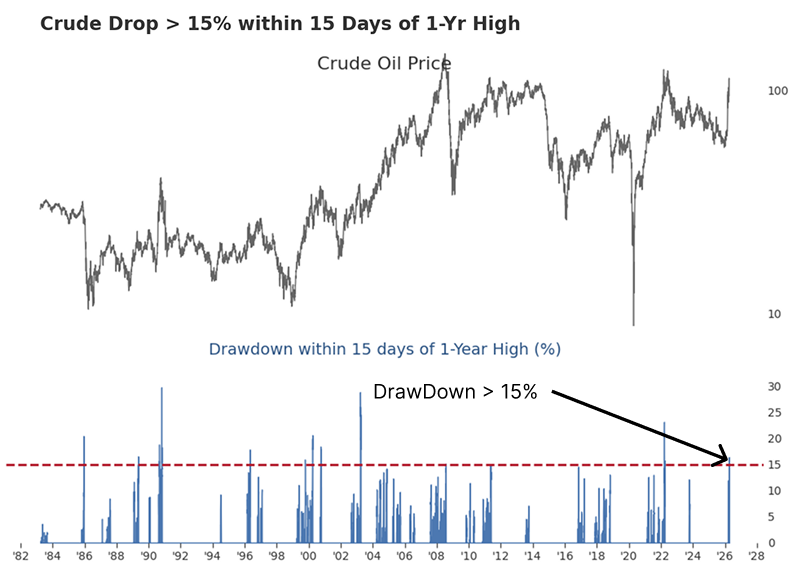
The XLE dropped 7% from its multi-month high in under three weeks. This pullback is the downstream symptom of a violent 15% collapse in crude oil. Historically, this sets up a compelling mean-reversion trade.
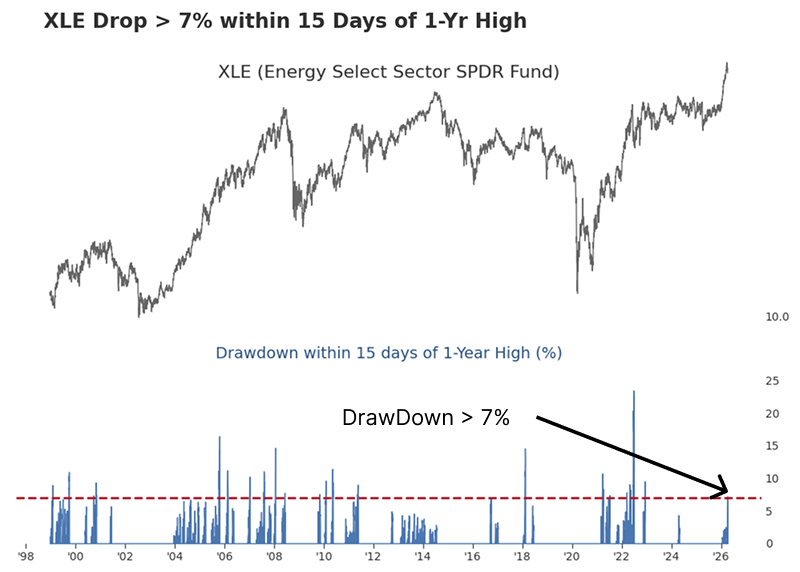
The broader market initially stalls before fracturing. Capital unequivocally flees risk for safety. Utilities deliver a robust 7.7% median gain over six months with an 83% win rate.
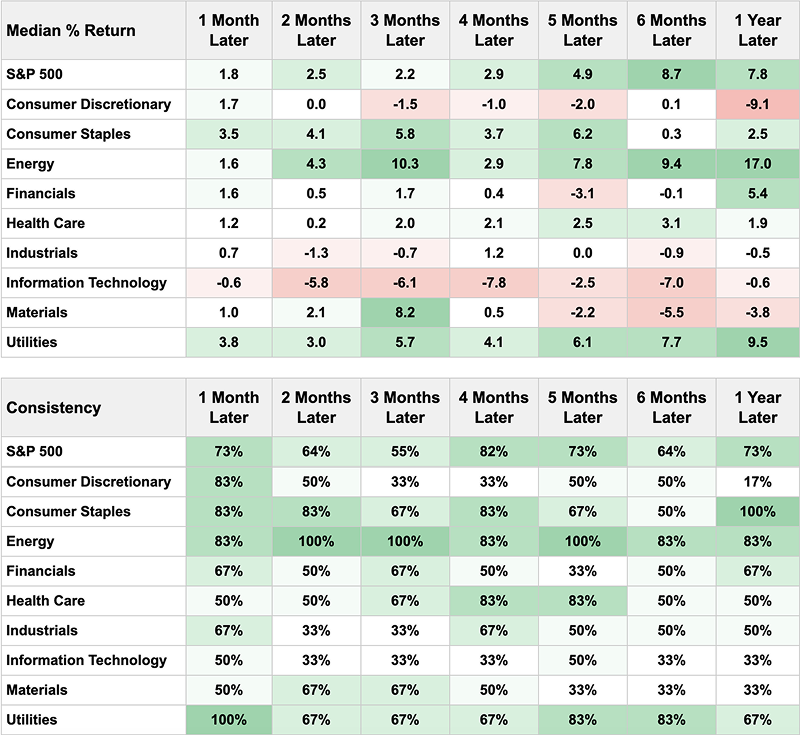
Three months after a crude flush of this magnitude, the energy sector traded higher 100% of the time, delivering a median surge of 10.3%. XLE prices in the worst-case oil downside before the final flush, decoupling from crude itself.
Natural Gas Seasonal Window Requires Price Confirmation
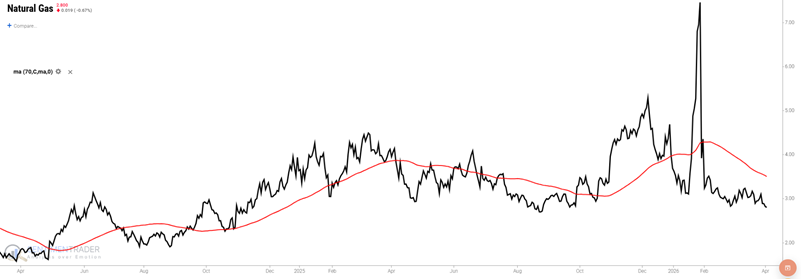
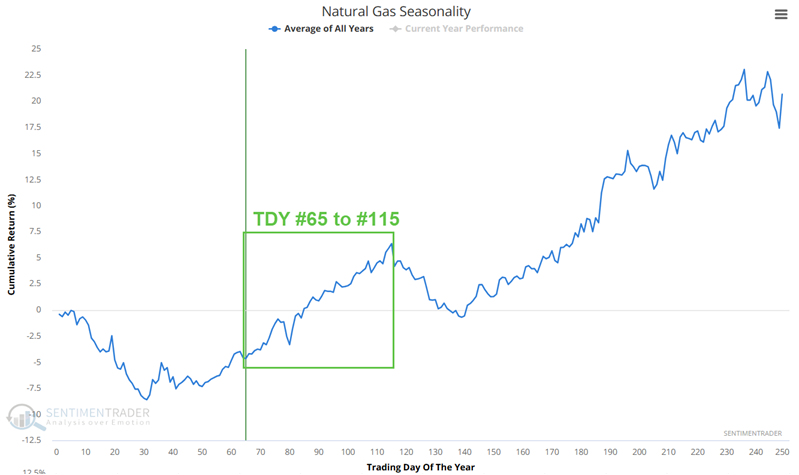
Natural Gas soared briefly in January 2026, then declined steadily. Despite the drop, it enters a favorable seasonal window from April 2nd through June 15th. Seasonality is a directional filter, not a standalone roadmap.
If seasonality and price trend align, there is opportunity. Historical results show a 75% win rate, but with a median loss of -$2,500 during the period, highlighting inherent volatility.
The UNG ETF tracks movements without unlimited futures risk, offering a practical alternative for non-futures traders.
OEX and ROBO Put/Call Extremes Flash Contrarian Buy Signals
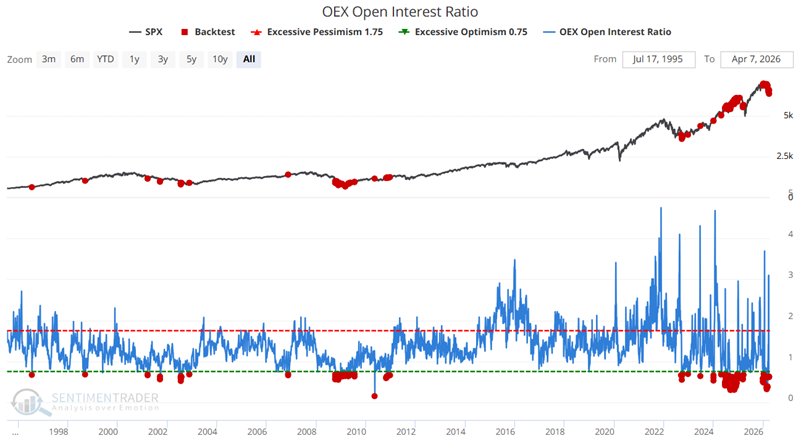
The OEX Open Interest Ratio recently plunged below 0.70. While signals can occur early, they serve as powerful weight-of-the-evidence tools, historically showing a 97% 1-Year Win Rate for the S&P 500.
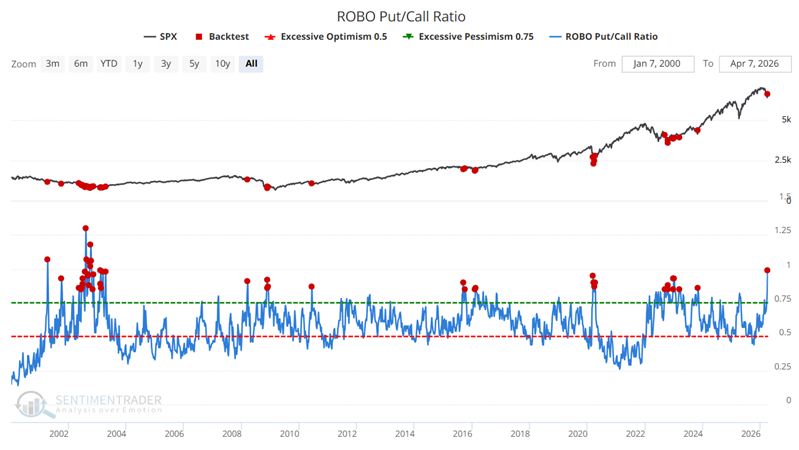
Similarly, the ROBO Put/Call Ratio, which isolates small retail trades, spiked above 0.84. This contrary indicator suggests retail bearishness is overdone. The 94% 3-month Win Rate argues for a stock bounce.
Industry Bear Market, WTI/Gold Ratio, and Consumer Confidence Support Bullish Case
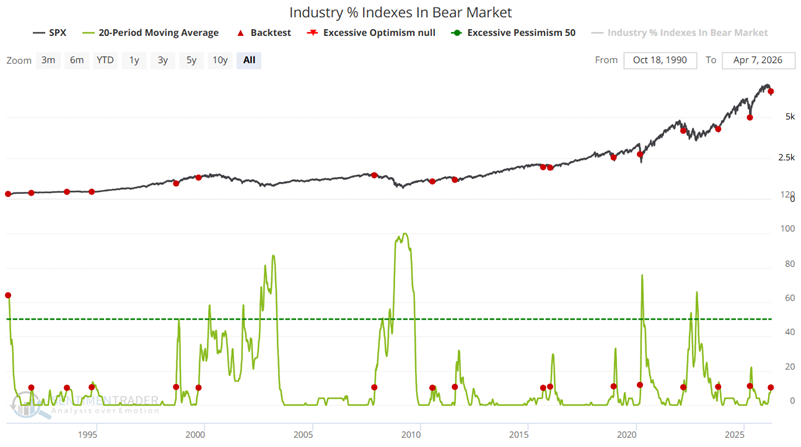
The Industry % in Bear Market indicator recently crossed above 10% for the first time in three months, historically coinciding with intermediate market bottoms and strong 1-month to 1-year reliability.
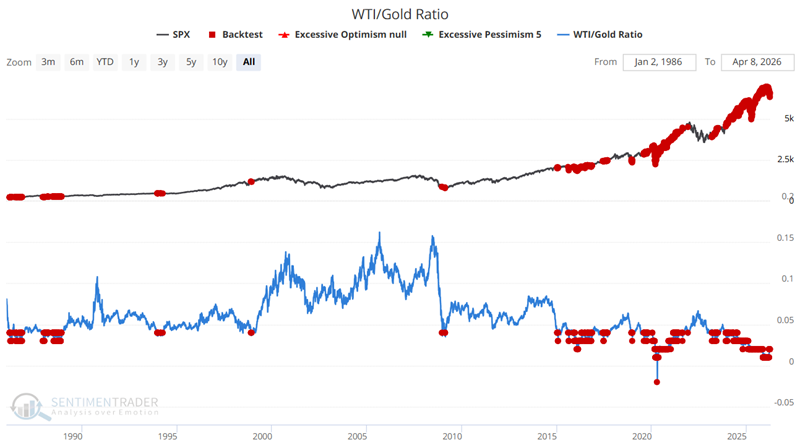
The WTI/Gold Ratio remains constrained below 0.037. Low oil prices relative to gold tend to be an economic boon, with a historical 96% 1-Year Win Rate for equities following such readings.
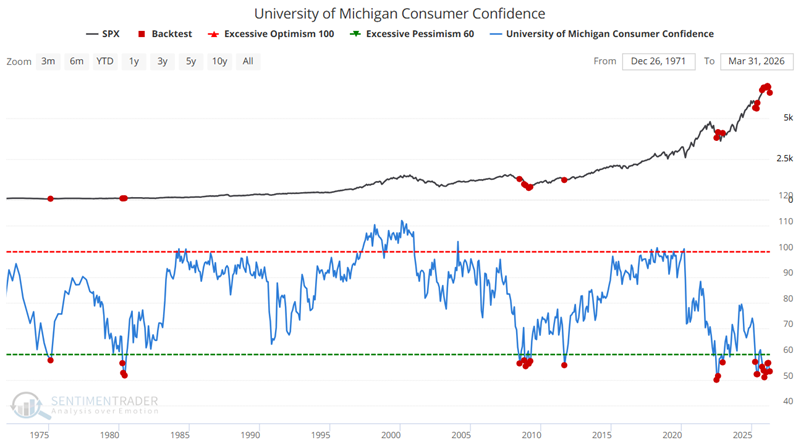
Finally, U of M Consumer Confidence falling below 58 reflects extreme pessimism, serving as a classic contrarian signal that has preceded 90% positive 9-month returns.
Soybean Seasonality and Uptrend Align for Spring Rally
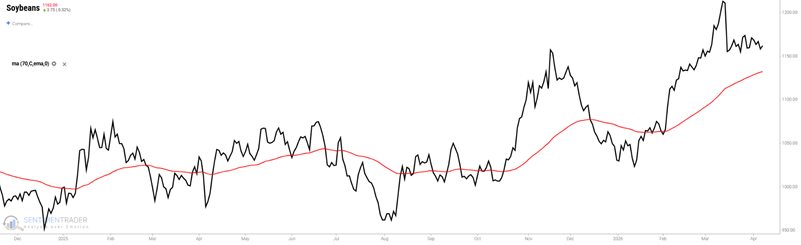
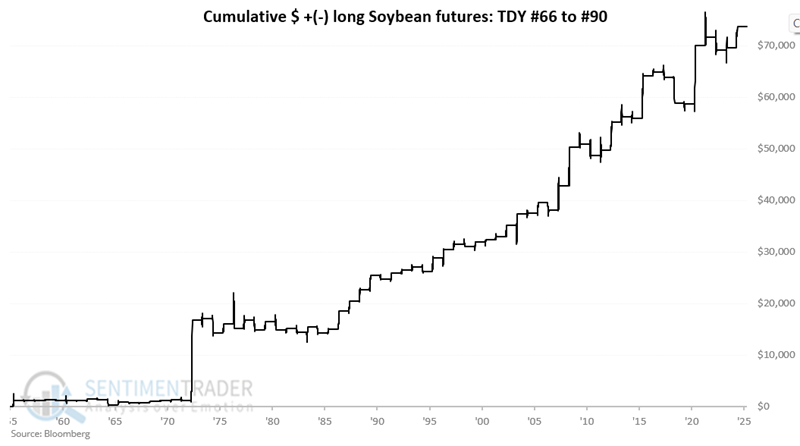
Soybeans enter a historically favorable seasonal period from April 8th through May 12th. With price action already in an established uptrend, the alignment offers a favorable speculative setup.
Historical data shows a 64% win rate, with gains heavily skewing positive during this window. The SOYB ETF provides a lower-risk access point than direct futures trading.
About TradingEdge Weekly...
The goal of TradingEdge Weekly is to summarize some of the research published to SentimenTrader over the past week. Sometimes there is a lot to digest, and this summary highlights the highest conviction or most compelling ideas we discussed. This is NOT the published research; rather, it pulls out some of the most relevant parts. It includes links to the published research for convenience, and if you don't subscribe to those products, it will present the options for access.