
Once More to the Corn Bin

As I review my previous posts, it would seem at first blush that the corn market has gotten more than its fair share of attention. See here, here, here, and here. You get my drift.
But then again, maybe not, as it has been - and remains - very topical. And so here we are again.
WHAT'S NEW
The Sentimentrader Backtest Engine just generated a new signal for Corn (which you can replicate by clicking this link and then clicking "Run Backtest"). This signal occurs when the 100-day average for Corn Optix drops from above to below 72. The new signal and previous signals appear in the screenshot below.
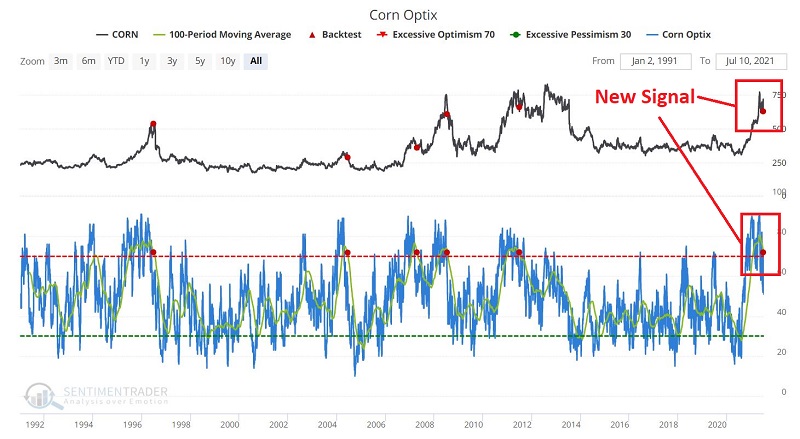
As you can see in the table below, this signal has generally - but importantly, not always - been a precursor of some abysmal results for Corn in the year ahead (note that the 2007 signal witnessed a decline for Corn 3 months after the signal, but was followed by a rip-roaring rally in the next 9 months - which, for the record, set the stage for the 2008 collapse).
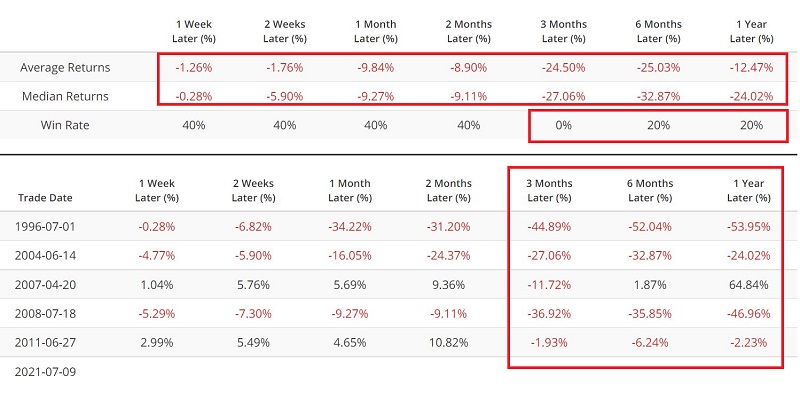
So, does this new signal mean that Corn is doomed to plummet in the year ahead? Not necessarily. Nevertheless, the potential warning sign is fairly clear.
PREVIOUS EXAMPLE TRADES
This previous article highlighted two example trades using options on ETF ticker CORN (Teucrium Corn Fund). The chart below shows the updated status of a "Bear Call Spread" using CORN options.
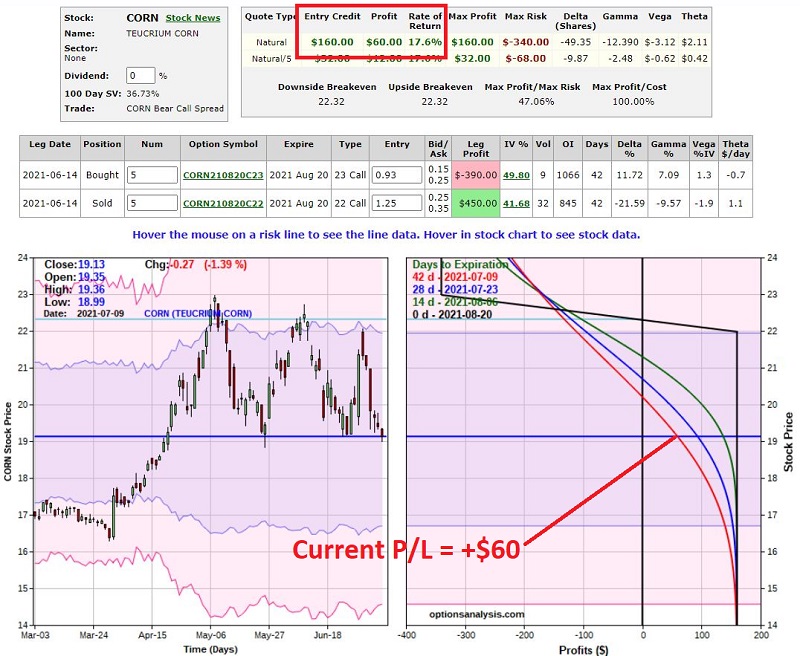
As you can see in the chart above, as of the close on 7/9, regarding this example trade:
- There is an open profit of $60
- It has a maximum profit potential of $160
- With CORN trading at $19.13, the breakeven price is $22.32
- The options expire on 8/20
- The maximum profit of $160 will be achieved if CORN is at or below $22 a share at expiration
- The maximum risk is -$340 and would occur if the position is held until expiration AND CORN is >=$23
The chart below shows the updated status of a "Bear Put Spread" using CORN options.
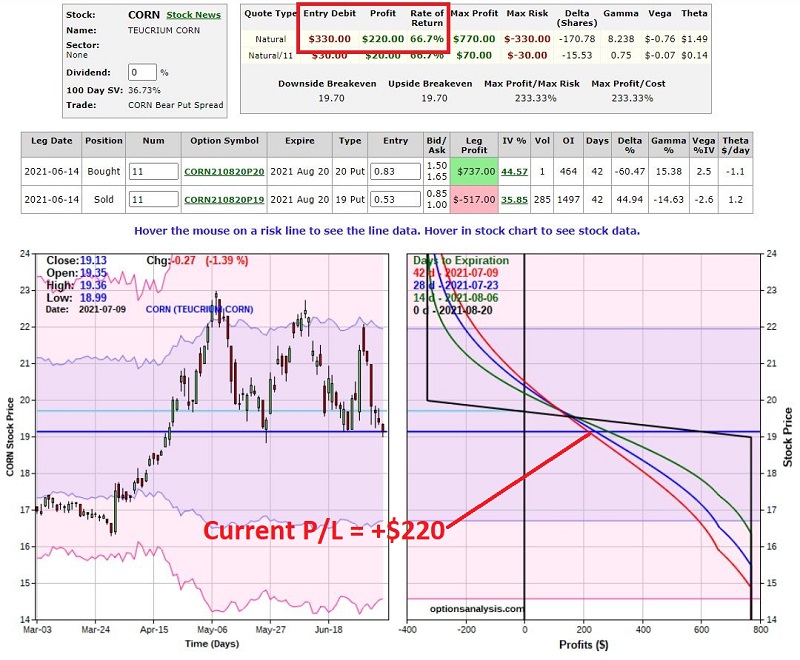
As you can see in the chart above, as of the close on 7/9, regarding this example trade:
- There is an open profit of $220
- It has a maximum profit potential of $770
- With CORN trading at $19.13, the breakeven price is $19.70
- The options expire on 8/20
- The maximum profit of $770 will be achieved if CORN is at or below $19 a share at expiration
- The maximum risk is -$330 and would occur if the position is held until expiration AND CORN is >=$20
WHERE TO FROM HERE?
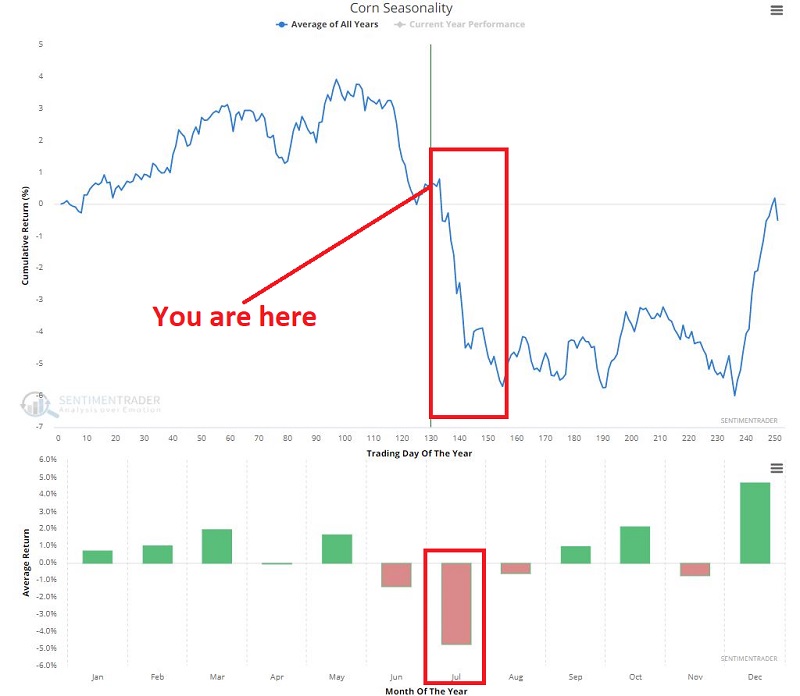
The chart below displays the Annual Seasonal Trend for Corn. As you can see pretty clearly, if history proves to be an accurate guide, the month ahead could be fraught with peril for Corn.
The two primary ways to play would be:
- To sell short Corn futures contracts as a direct play on a price decline
- To construct a trade using options on ticker CORN along the lines of the example trades above
A few caveats:
- Futures trading involves the use of margin and leverage and entails significant risk. You should have a thorough understanding of the mechanics of futures trading and the potential risks involved before entering any trade.
- Likewise, options trading also entails risk, as options can expire worthless, assignment is possible when trading option spreads, and CORN options are not heavily traded; thus, bid/ask spreads may be wide and liquidity low.
One last word of caution. While the new Optix signal combined with the extremely unfavorable Seasonal trend is a potentially powerful combination, the corn market is presently very oversold and may be due for a bounce in the near term.
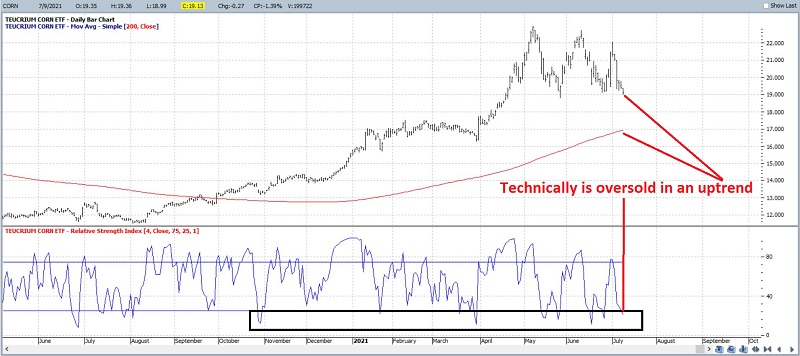
If we look at the price chart for ticker CORN below - forgetting about sentiment (Optix) and seasonality for the moment - one can argue that what we see is an "oversold market (4-day RSI at 21%) in an established uptrend (closing price well above a rising 200-day moving average)."
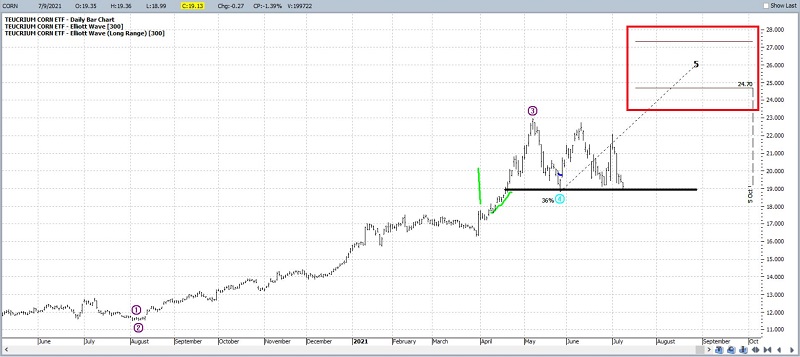
One last contrary item. In the chart below, we see a "Line in the Sand" at the recent lows, plus - for what it is worth - the Elliott Wave algorithm built into ProfitSource is still projecting a Wave 5 advance for CORN in the months ahead.
As a result, before taking the plunge, traders may be wise to exhibit a small bit of patience and wait for:
- A clear breakdown below recent lows as confirmation of the start of a new down leg
- OR, for a short-term bounce in corn to relieve the current oversold status
Remember, not every situation calls for immediate action. Sometimes waiting for the right moment - and then acting decisively - is what is needed. A clear breakdown in price below support (trend confirmation) or a "dead cat bounce" (one which relieves the present oversold status) in corn may provide that moment.