
Commodity at the Crossroads - The Corn Edition

In this article on 5/21, I first mentioned the idea of keeping an eye on corn as at the time it had:
- Rallied to a high
- Pulled back sharply
- Entered a typically weak seasonal period
Since that time, corn has:
- Rallied sharply again...
- ...BUT failed to break through upside resistance
- Broken back to the downside
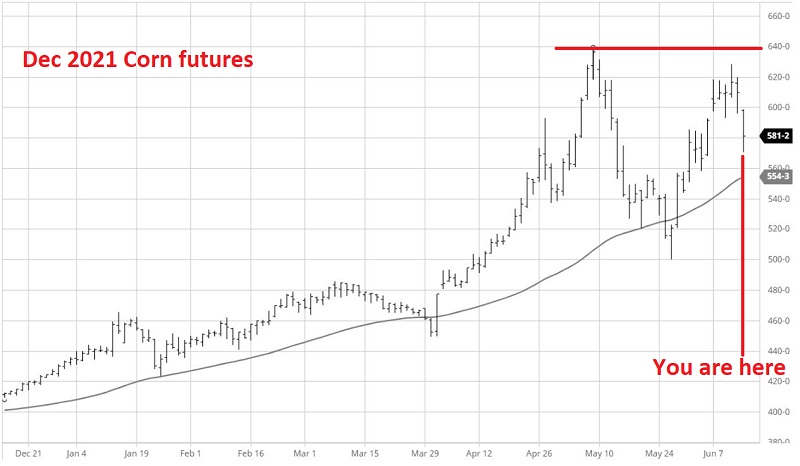
On a trend-following basis, corn remains in an uptrend. As you can see in the chart below, corn is still trading above its 50-day moving average. Still, the warning signs discussed below suggest that any drop below the 50-day average could signal traders of potential trouble.
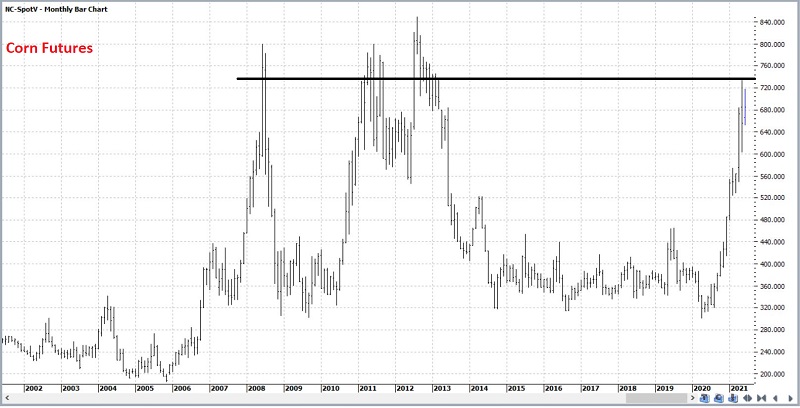
WARNING SIGN #1: RESISTANCE
In the chart below (from www.ProfitSource.com), we see that corn futures have spent little time above the resistance level of 750 in the last 20 years. Again, anything is possible. However, the long-term odds do not appear to favor a sustained breakout to the upside.
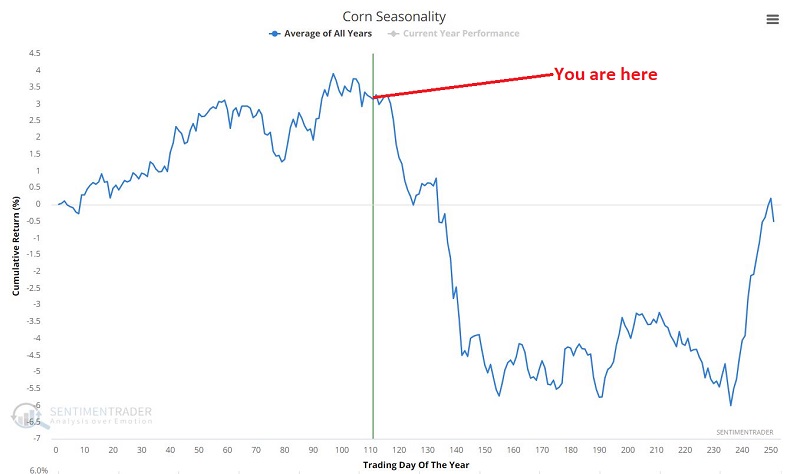
WARNING SIGN #2: SEASONALITY
The corn market historically has exhibited a highly seasonal bias across the calendar year. The seasonality chart below pretty clearly illustrates the potential danger zone corn is entering.
Let's look at a particular segment of trading days during the calendar year. The first "Trading Day of the Year" (TDY for short) is TDY #1.
- The blue line displays the hypothetical $ + (-) achieved by holding long a corn futures contract ONLY from the close on TDY #115 through the close on TDY #155 every year since 1976
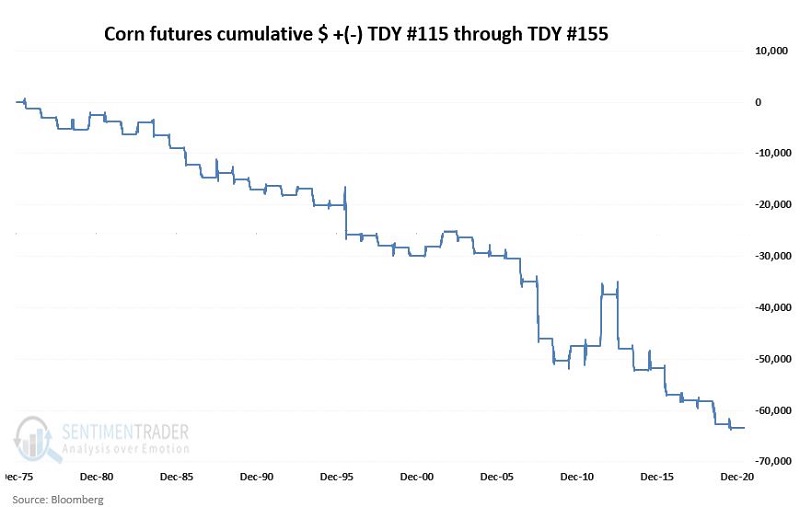
While anything can happen within a given year, the long-term tendency for weakness is obvious.
WARNING SIGN #3: SENTIMENT
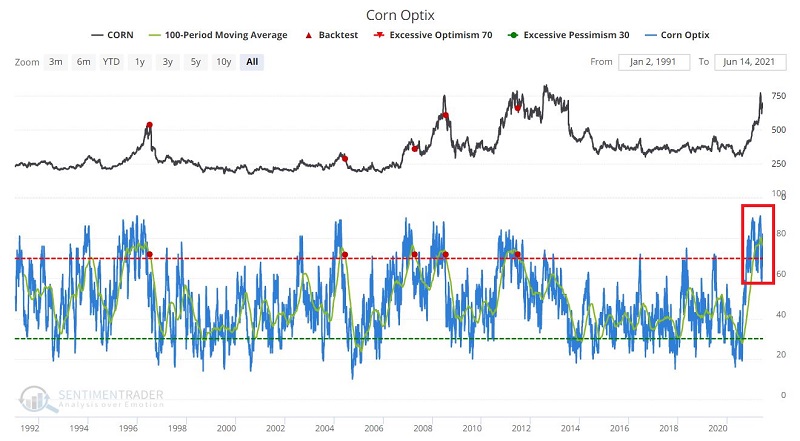
Since 1996 there have been only 5 previous occasions when the 100-day moving average of corn Optix dropped from above to below 72. Those signals are displayed in the chart below.
The chart below "zooms in" on the red box on the far right-hand side of the chart above.
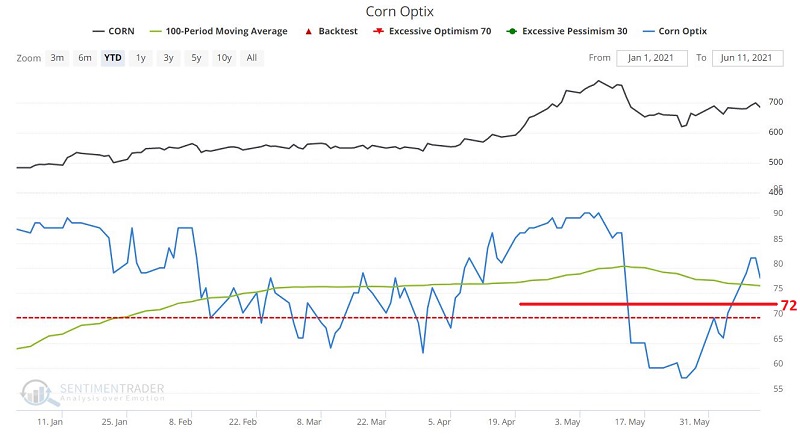
As you can see, the 100-day moving average of corn Optix (the green line in the chart above) is above 72 at the moment. A drop below that level - when it comes - will likely be an unfavorable sign for corn. How unfavorable?
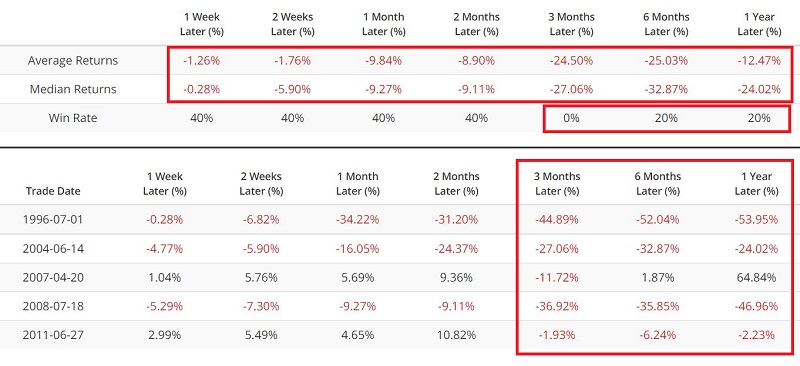
As you can see in the table below, the average and median returns across all time frames have been negative and the Win Rate well below 50%, particularly 3 months and out.
TRADING
The most straightforward approach to playing weakness in the price of corn is to sell short corn futures. For non-futures traders, ticker CORN tracks the price of corn futures contracts.
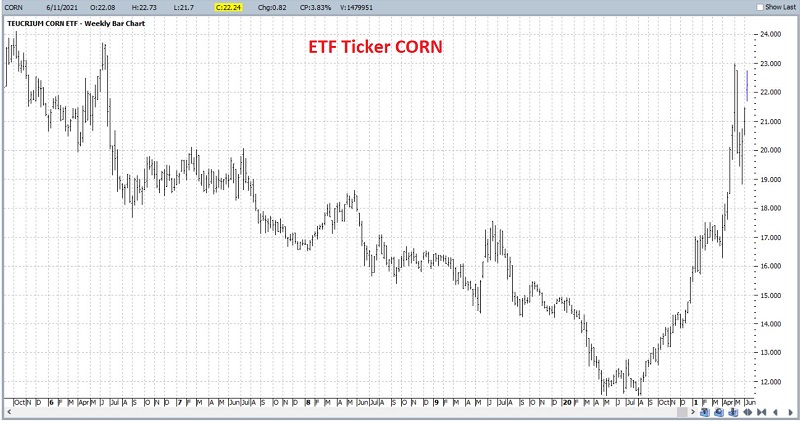
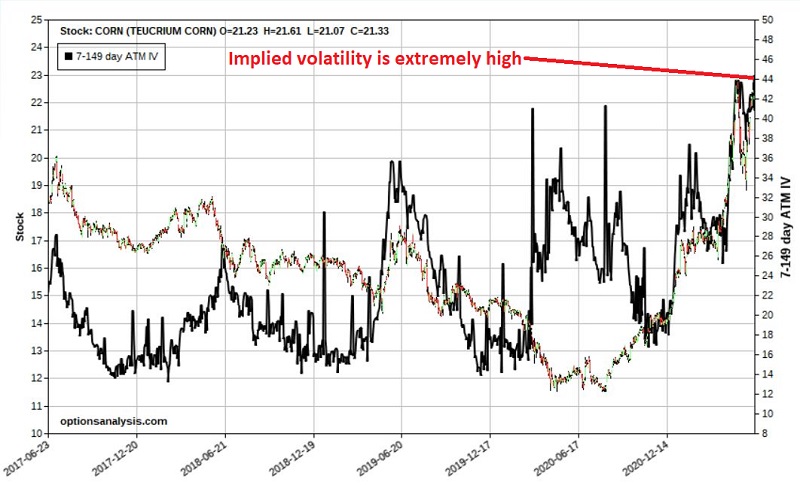
Selling short shares of CORN is one potential play for traders who are comfortable doing so (AND who fully understand the importance of and are willing to implement stop-loss orders). A lower dollar risk approach might be to trade options on ticker CORN. One problem is that the implied volatility for CORN options is at roughly its highest level ever (this means that there is a great deal of time premium built into the price of CORN options, i.e., they are "expensive" on a historical basis).
The chart below displays the price chart for CORN and the average implied volatility for CORN options (the black line). All charts below are courtesy of www.Optionsanalysis.com.
The danger here is that if you buy a put option and IV subsequently declines, the option can lose a great deal of its time premium due to "Vega" - the greek value that indicates how many $'s a given option position will gain or lose due solely to a change in IV. As a result, a spread might make more sense (IMPORTANT: It should be noted that CORN options have inconsistent volume, and bid/ask spreads can be relatively wide. As a result, it is important to trade these options using limit orders to enter positions).
BEAR CALL SPREAD EXAMPLE
The example trade below involves "selling premium" as follows:
- Selling 5 CORN Aug2021 22 strike price calls @ $1.25
- Buying 5 CORN Aug2021 23 strike price calls @ $0.93
The particulars and risk curves appear in the chart below.
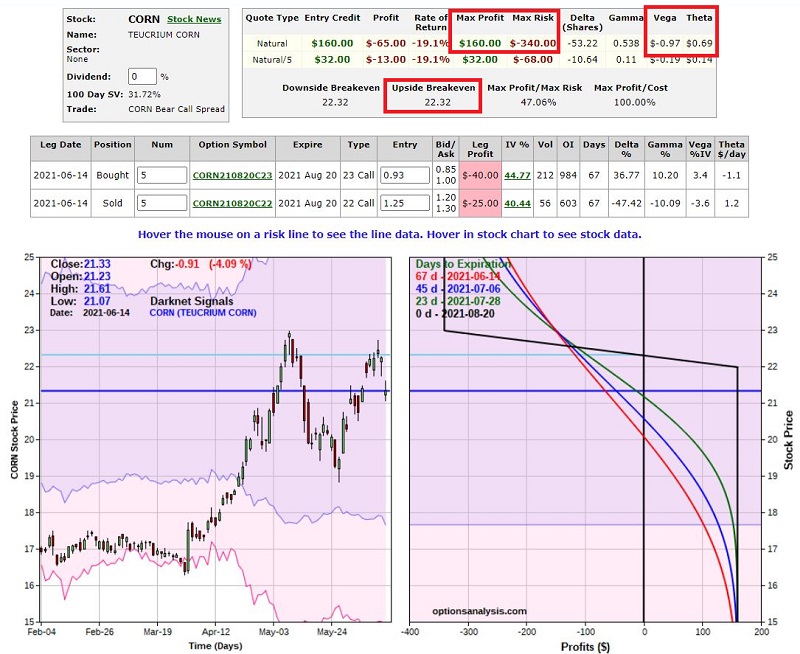
The goal is for CORN to be below the breakeven price of $22.32 a share at August expiration and the position (which is "short premium") to expire worthless.
Note that:
- "Vega" is negative (this means that if implied volatility falls, this trade will gain because it is short premium)
- "Theta" is positive (this means that this position will profit from time decay)
Now let's consider a more aggressive approach - buying a "Bear Put Spread."
BEAR PUT SPREAD EXAMPLE
The example trade below involves "buying premium" as follows:
- Buying 11 CORN Aug2021 20 strike price puts @ $0.83
- Selling 11 CORN Aug2021 19 strike price calls @ $0.53
The particulars and risk curves appear in the chart below.
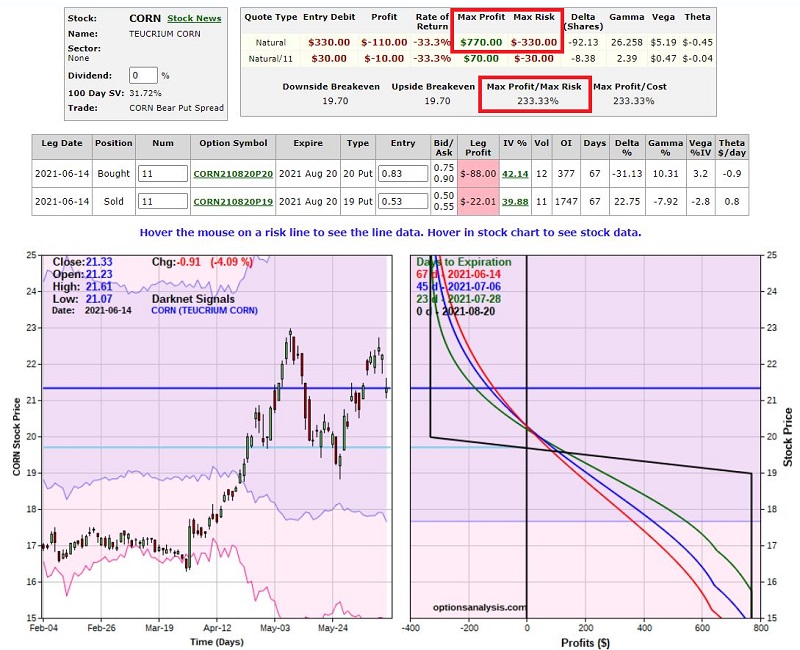 While they have roughly the same $ risk ($330 vs. $340), the key differences between this bear put spread trade and the earlier bear call spread trade are:
- The bear put spread has much greater profit potential ($770 vs. $160)
- The bear call spread is profitable at expiration at any price below $22.32, while the bear put spread has a breakeven price of $19.70
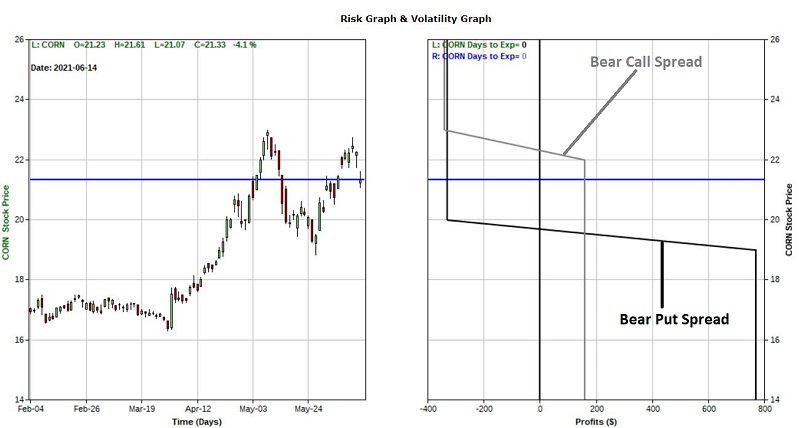
In a nutshell, the bear put spread is a "higher risk, higher potential reward" trade. The chart below illustrates this by overlaying the risk curve at expiration for both trades.
SUMMARY
Given the nature of markets in the last year plus widespread supply and demand imbalances, there is no reason that corn cannot continue to rally to much higher ground. That said, if it fails to do so, sentiment and seasonality suggest the potential for significant price weakness.
For each trader, the key decisions are:
- Whether or not to participate
- And if so, then "how" to participate