
Enjoy the Rally in Corn - While it Lasts

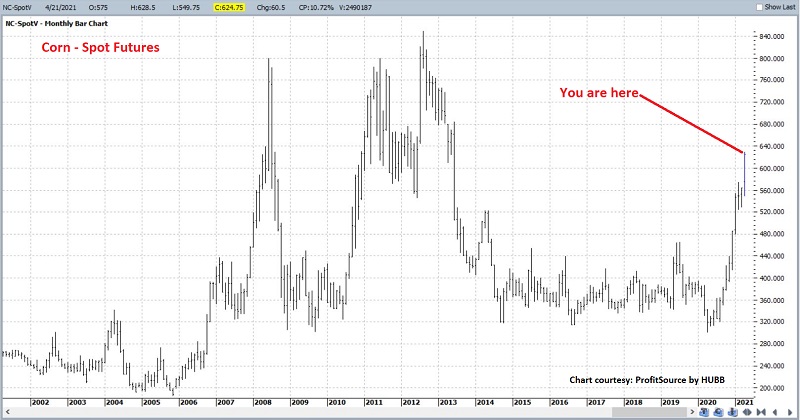
Corn has been a strong performer of late, as you can see in the chart below.
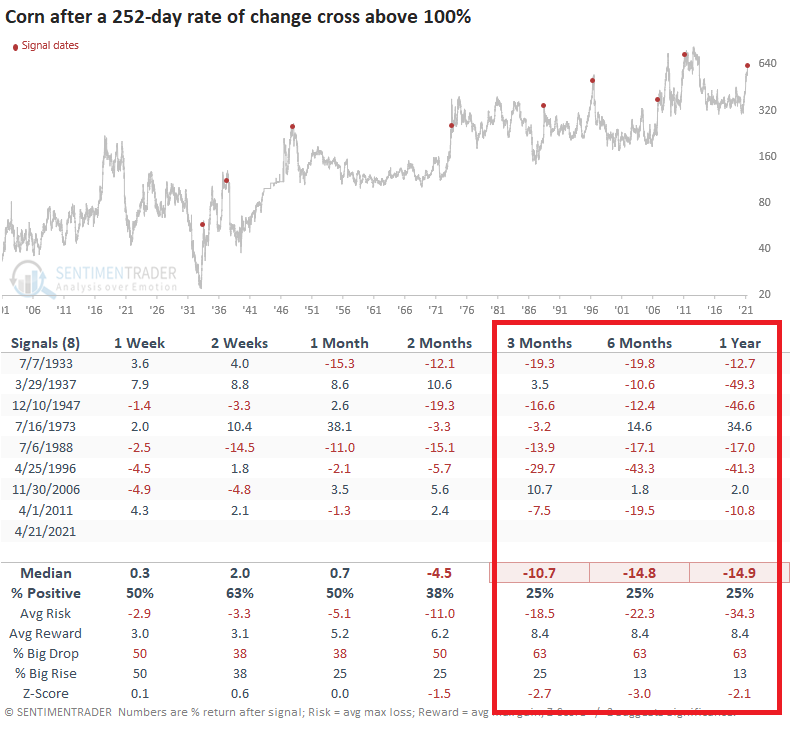
Things have been so good, we may have reached a point where things are getting a bit "too good." The chart below - created by and borrowed from - Dean Christians shows previous instances when corn rallied more than 100% over 252 trading days. Historically, a rally of this magnitude has typically served as something of a warning sign.
Not one to stand in the way of a freight train, I am happy to oblige the trend as long as it wants to last. However, like any trend, this one will eventually end, and commodities tend to reverse quickly. So is there any way to get a "heads up" regarding when corn may run out of steam? Let's consider a few key factors, namely:
- Seasonality
- Sentiment
- Trend
SEASONALITY
As you can see in the chart below, corn is one of the most reliably seasonal markets around. Due to the planting cycle (nothing in the ground October into April, planting in spring, growing in summer, harvest in fall), the corn market tends to rally from December into late-May (when the crop is in doubt) and to decline late spring into late fall (when the crop yield for the year is essentially known).
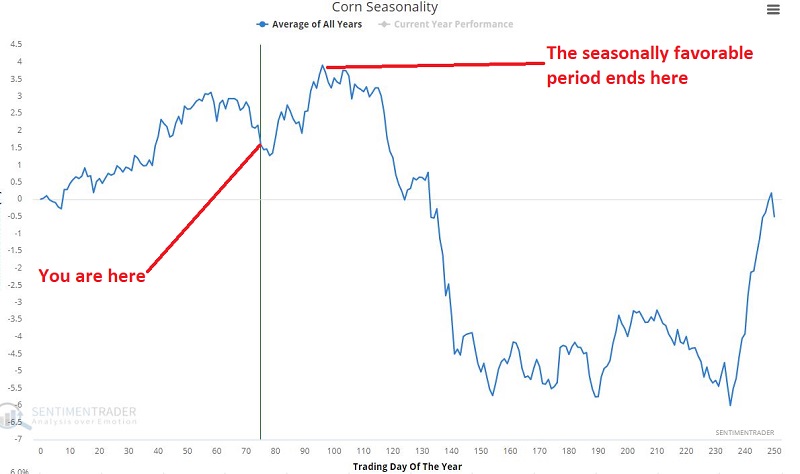
The key point here is that time is running out on the seasonally favorable period of the year.
SENTIMENT
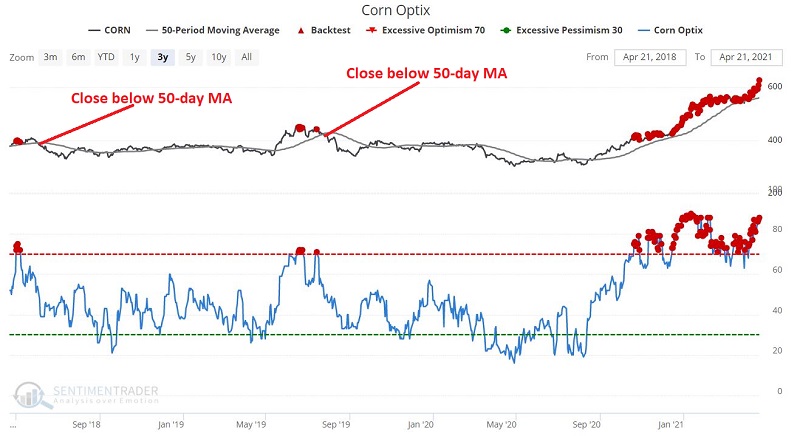
The chart below displays all occasions when Corn Optix was above 70% since 1992.
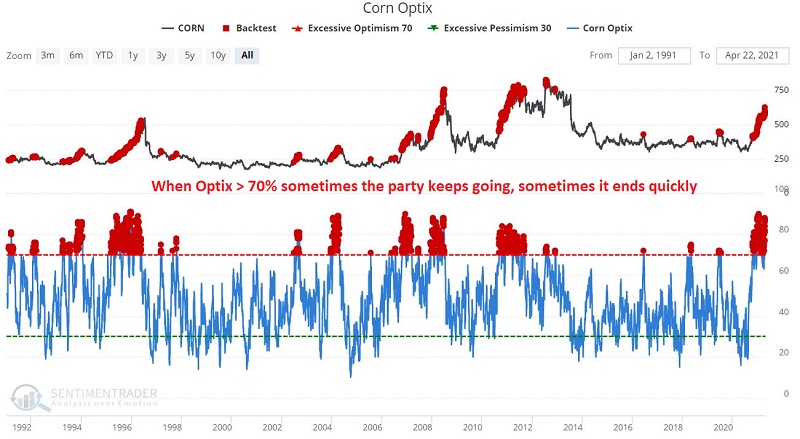
Once Option exceeds 70%, sometimes the rally continues for a period of time, and on other occasions, the rally stops almost dead in its tracks. The key takeaway appears in the table below.
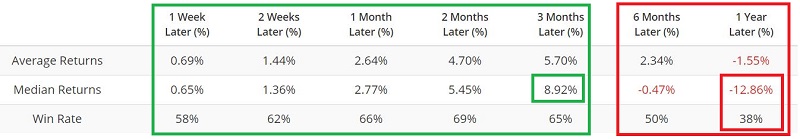
The numbers reveal that corn tends to show continued strength for up to 3 months after an Optix reading of 70%+. But after that, the results get much worse. The two key things to note following an Optix reading of 70%+:
- a median 12-month return of -12.86%
- a winning percentage of only 38%
Bottom line: When the party is over, the party is over.
TREND
Let's try to refine the results above just a little. Since we know that corn tends to keep rallying after an Optix reading of 70%+, we will apply a simple 50-day moving average of the daily closing price. When:
- Corn Optix exceed 70% and THEN
- Corn subsequently closes below its 50-day moving average
- We will deem the trend for corn as "unfavorable"
Some recent takeaway results appear in the chart below.
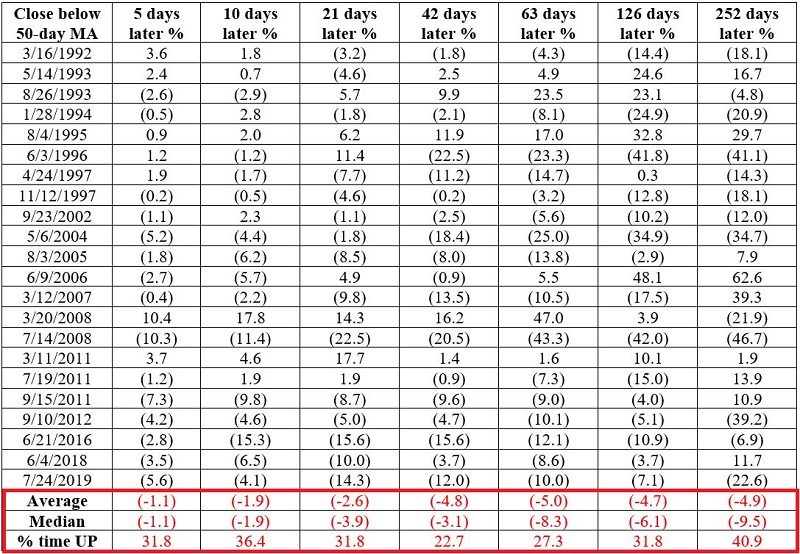
The table below displays results for corn when this scenario has played out in the past. Note that by waiting for the price to close below the 50-day average:
- The average and median returns for all timeframes are negative
- The percentage of instances that showed a gain is below 50% for all timeframes
THE BOTTOM LINE
The Good News:
- Corn is presently still within a seasonally favorable period
- Corn is presently above its 50-day moving average
The Bad News:
- Corn Option is around 88%, i.e., extremely high
- The seasonally favorable period is running out of time
The next time corn closes below its 50-day moving average, the warning signal will flash. Does that mean corn is then doomed to decline? Not at all. But history suggests it would not be a trend worth fighting.