
Can Corn?

In the first chart below, you can see that corn has had a terrific run in the last 9+ months. Since bottoming at a multi-year low near $3 a bushel in April 2020, corn has rallied over 33%. The obvious question is, "can it keep going?"
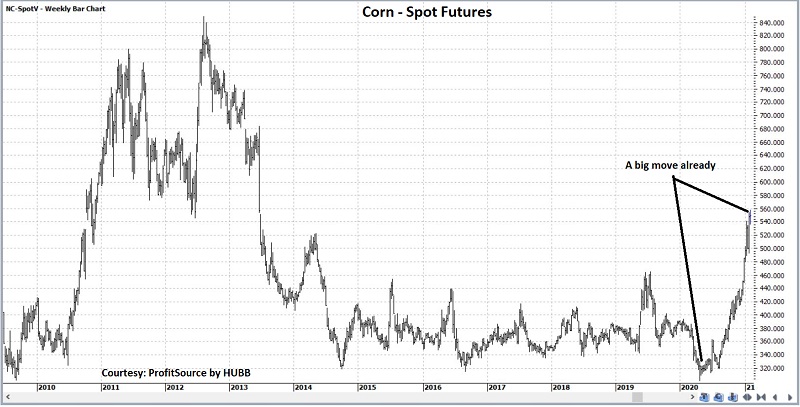
Let's take a closer look at some factors that might impact corn in the months ahead.
Seasonality (Broadly)
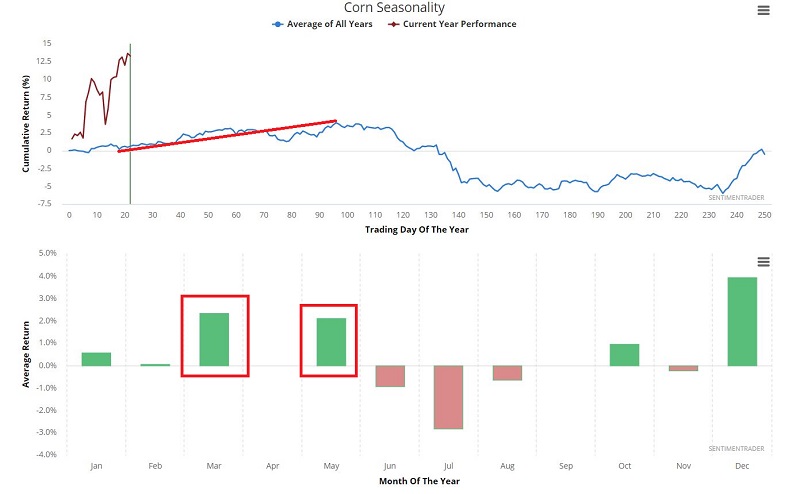
As you can see in the chart below, corn has a seasonal tendency to be bullish through at least the end of March and often into as late as May. In fact, historically March has been the second most favorable month for corn behind December.
Seasonality (Specifically)
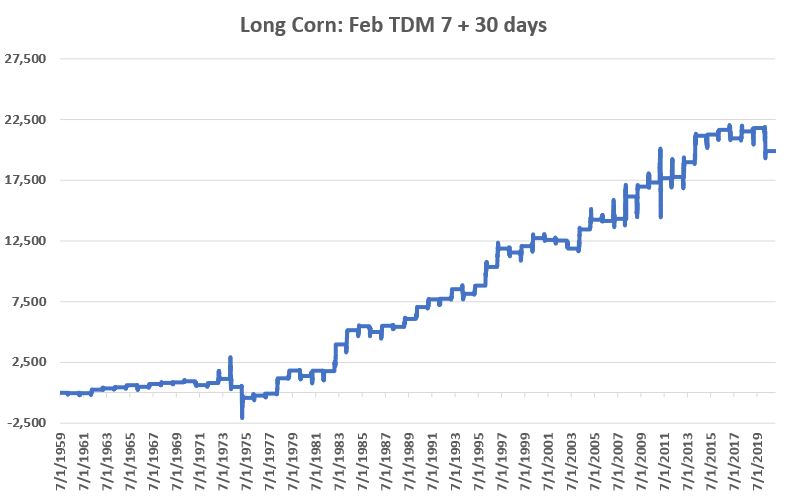
A seasonally favorable period for corn begins at the close of February Trading Day #7 (2/9/2021 this year) and lasts for 30 trading days (ending 3/24/2021). The chart below displays the hypothetical gain achieved by holding a long 1-lot position in corn futures each year since 1960 during this period.
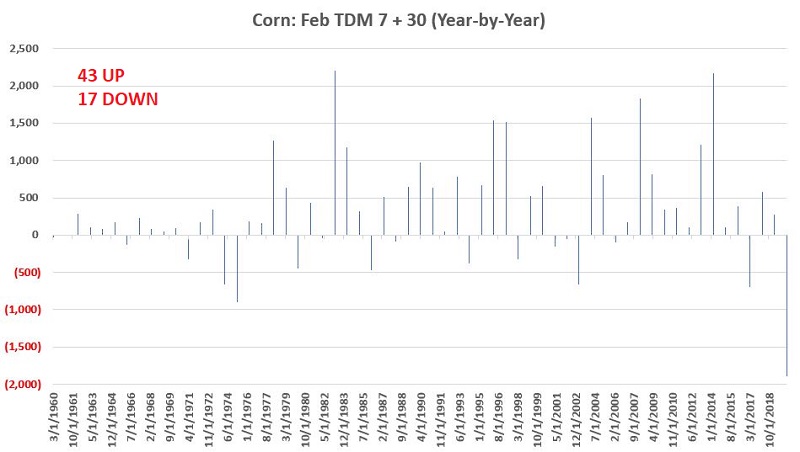
This period has seen corn rise 43 out of 60 years (72% of the time). The average gain was +$634 and the average loss was -$433. So:
- Win/Loss Ratio = 2.53-to-1
- Profit/Loss Ratio = 1.46-to-1
Prior to 2020 the largest loss during this period was -$900. As with a lot of markets, the COVID-19 selloff sent corn for a loop and it suffered a quite large -$1,897 loss during this typically favorable period in 2020. Recency bias may cause this loss to weigh heavily on the mind of anyone considering a long position in corn during this time period in 2021. But it probably should not. The year-by-year hypothetical profit/loss from a 1-lot long position in corn during this favorable period appears below.
Sentiment
Here is where things get really interesting. As you can see in the chart below, trader optimism has been extremely high for corn of late.
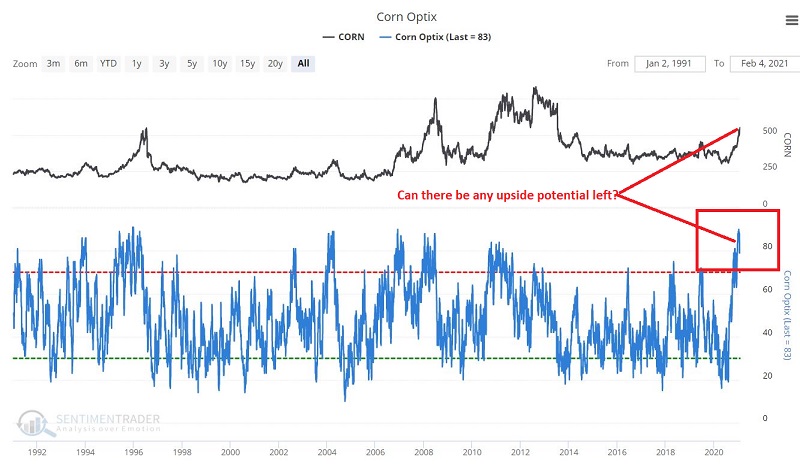
Knee-jerk analysis would likely lead one to consider this as an unfavorable sign. And ultimately it may be - but history suggests that may not be for a while. The chart below shows each time Corn Optix has topped 85% for the first time in 252 days.
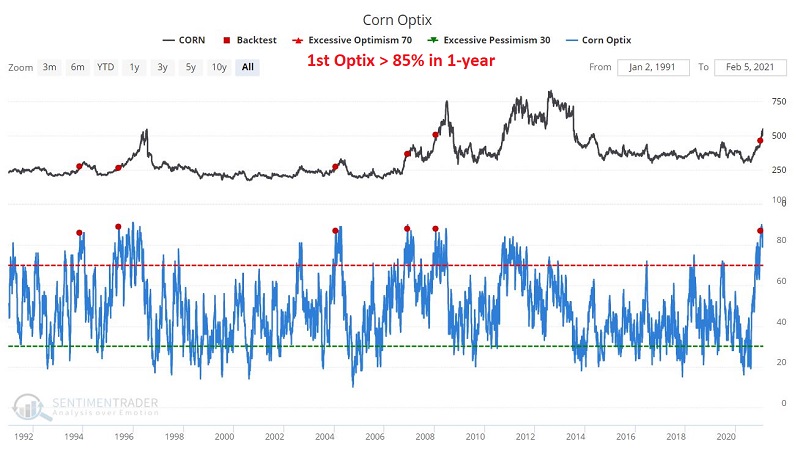
What the sample size is relatively small, what we observe is that the spike in optimism for corn typically occurs in the middle stages of a significant price advance. Typically, price action has continued to follow through for the next 3 months. After that there have been a majority of instances where the advance ran out of gas and corn stood lower 12 months later.
As you can see in the table below, corn moved higher 1 to 3 months after the initial 85% Optix reading in each previous case, with an average 3-month gain of just less than 12%. Note also that one year later corn stood higher only 40% of the time.
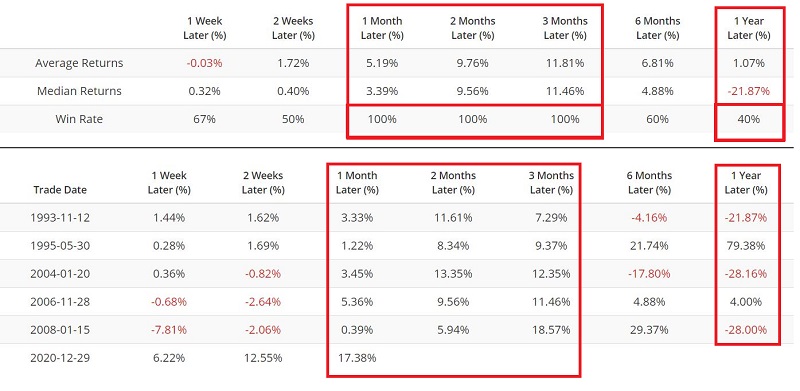
All of this seems to suggest a better than even chance that corn can continue to rally in the weeks and possibly months ahead.
For those who are not inclined to trade corn futures contracts, an alternative might be the ETF ticker symbol CORN, the Tecrium Corn Fund, which holds one-third of its portfolio in each of three different corn futures contracts. This fund offers non-futures traders a way to play the corn market without trading futures.
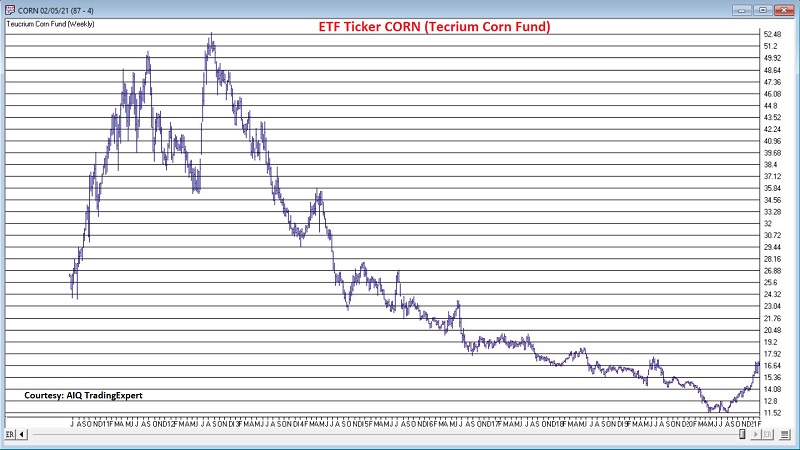
Shares of ticker CORN can be bought and sold just like shares of stock.