Market overview: no fat pitch
The S&P 500 is approximately 2% below its all-time high (on a daily CLOSE basis). Here's my market outlook:
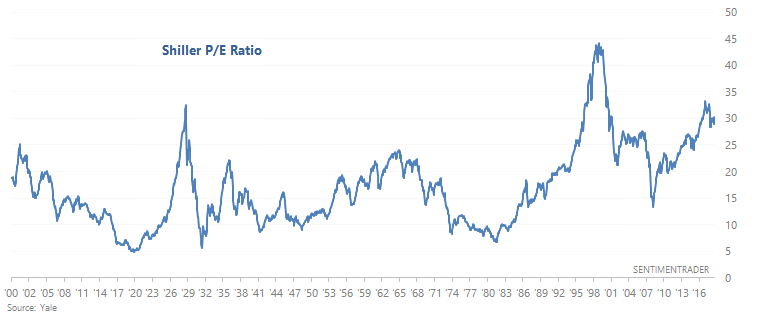
- Long term risk:reward doesn’t favor bulls. Valuations are high, but valuations can remain high for years.
- Fundamentals (6-12 months): still bullish because there is no significant U.S. macro deterioration, but this could change IF macro data deteriorates significantly over the next few months
- Technicals (3-6 months): mostly bullish, but not as bullish as before.
- Technicals (1-2 months): no clear edge in either direction.
Fundamentals (6-12 months)
The economy and the stock market move in the same direction in the long term. Hence, leading economic indicators are also long term leading indicators for the stock market.
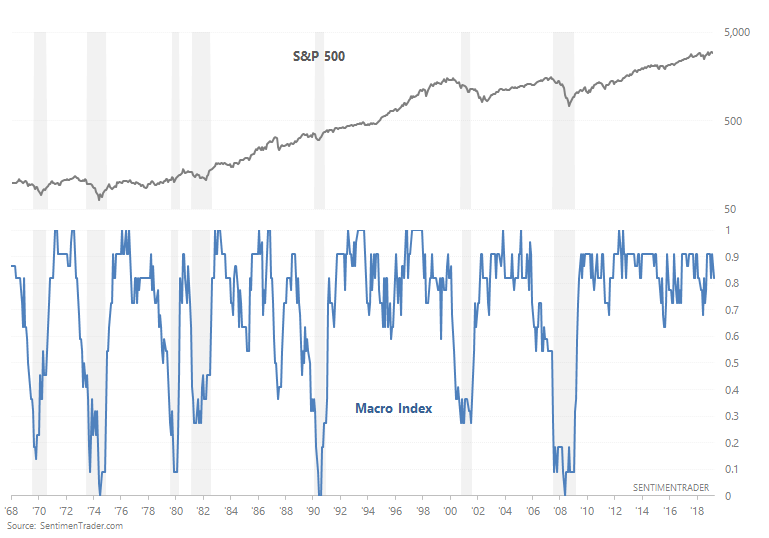
Here is our Macro Index, which aggregates 11 leading indicators. Overall, there is no significant U.S. economic deterioration right now. What will happen to macro in the future? I don't know. Instead of trying to guess the future, macro tells us how to react and trade day-by-day depending on what's happening right now.
The main weak points in U.S. macro revolve around trade, manufacturing, and the yield curve. (Please see the specified economic-data charts at the bottom of this post.)
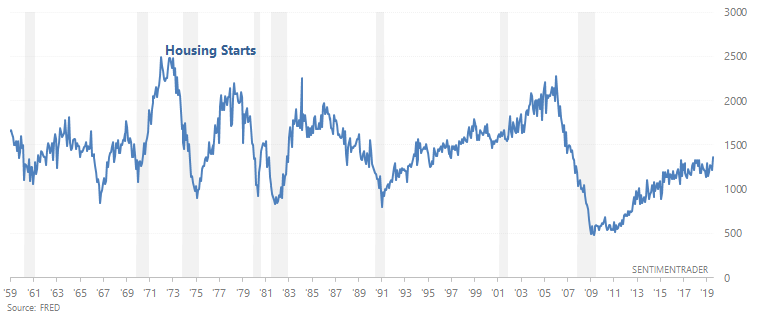
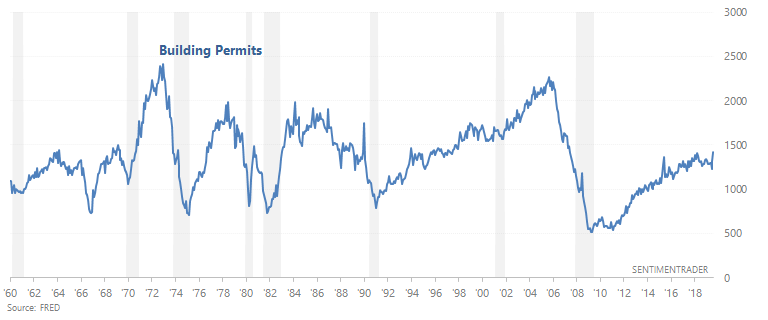
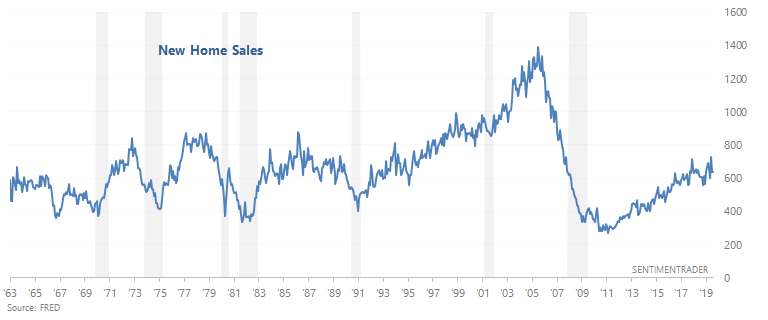
- Housing was weak, but is starting to improve. In the past, Housing Starts, Building Permits, and New Home Sales trended downwards before recessions began. Housing Starts, Building Permits, and New Home Sales are trending sideways now.
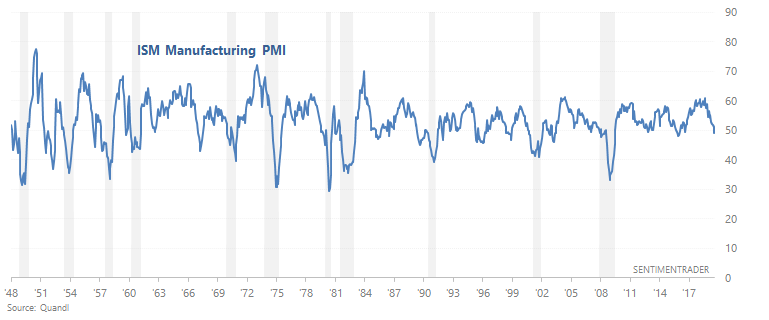
- Manufacturing-related data remains weak. The ISM manufacturing PMI has fallen below 50, signalling contraction.
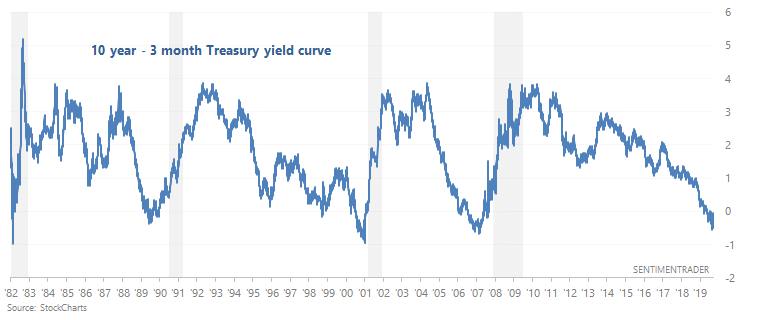
- The yield curve remains a long term bearish factor for stocks. As we've demonstrated many times here at SentimenTrader, yield curve inversions typically happen near the end of economic expansions and bull markets.
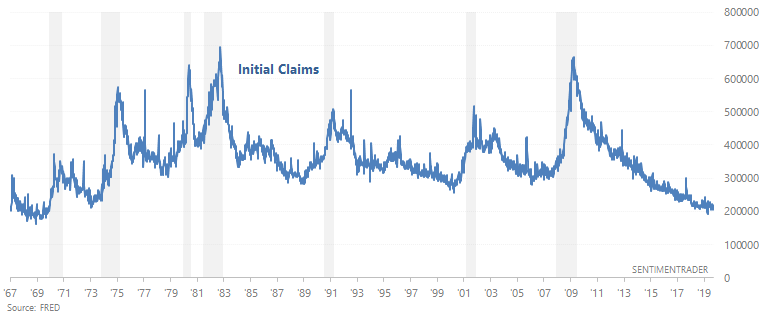
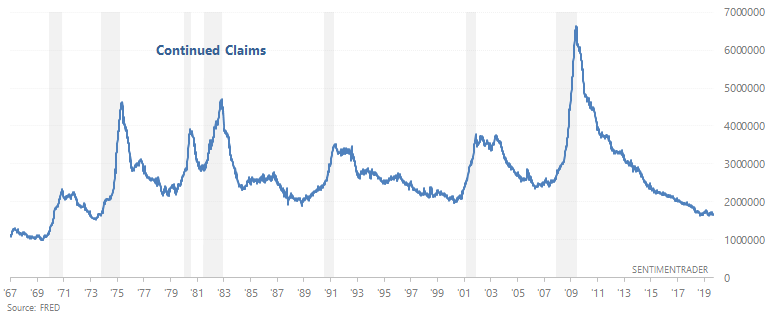
- The labor market is still a bullish factor for macro. 2 leading labor market indicators - Initial Claims and Continued Claims - continue to trend sideways. In the past, Initial Claims and Continued Claims trended upwards before recessions began.
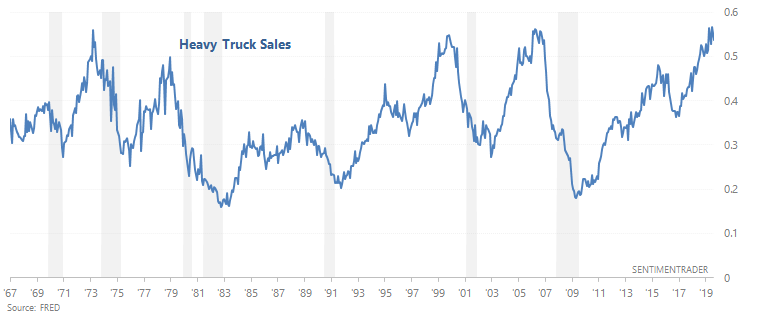
- Heavy Truck Sales is still a bullish factor for macro because this indicator is still trending upwards. In the past, Heavy Truck Sales trended downwards before recessions began.
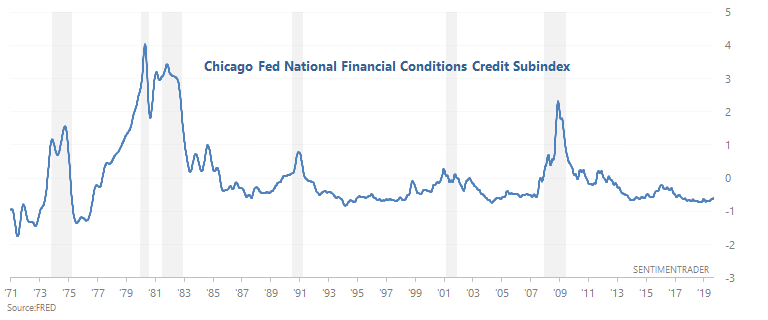
- Financial conditions have yet to see significant deterioration.
Technicals (3-6 months)
Most stats suggest that the stock market's 3-6 month outlook is bullish, although there are now some bearish stats mixed inbetween. Let's start with the bullish stats, and then we'll look at the bearish ones.
Bullish:
Consumers' Expectations
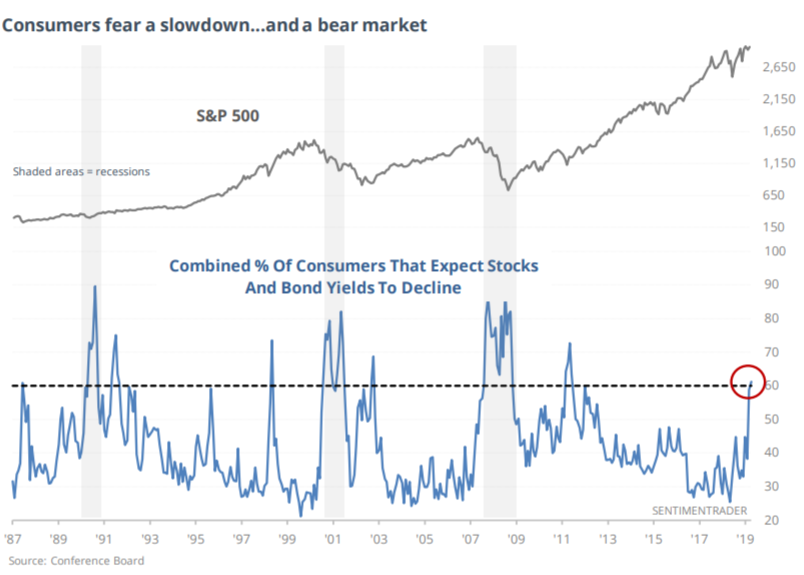
As Jason noted on Friday, nearly 60% of consumers expect stocks and yields to decline:
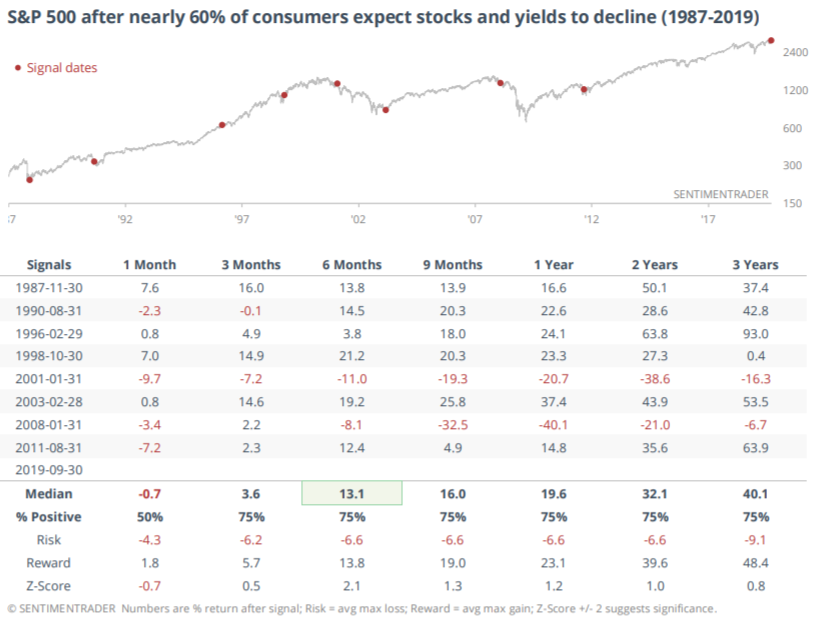
When consumers were this pessimistic towards economic growth, the S&P's 6 month forward returns were better than average:
Overall, consumers are less confident. Both the Conference Board's Consumer Confidence and the University of Michigan's consumer sentiment indices are down more than -5% over the past 12 months:
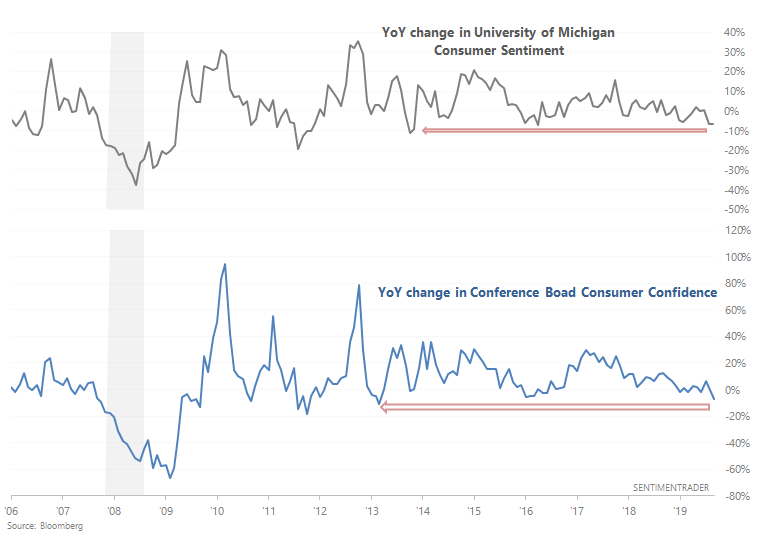
However, this wasn't a consistently adequate SELL signal for stocks. Sometimes this preceded big bear markets (e.g. 2000 and 2007), but there were also plenty of false SELL signals.
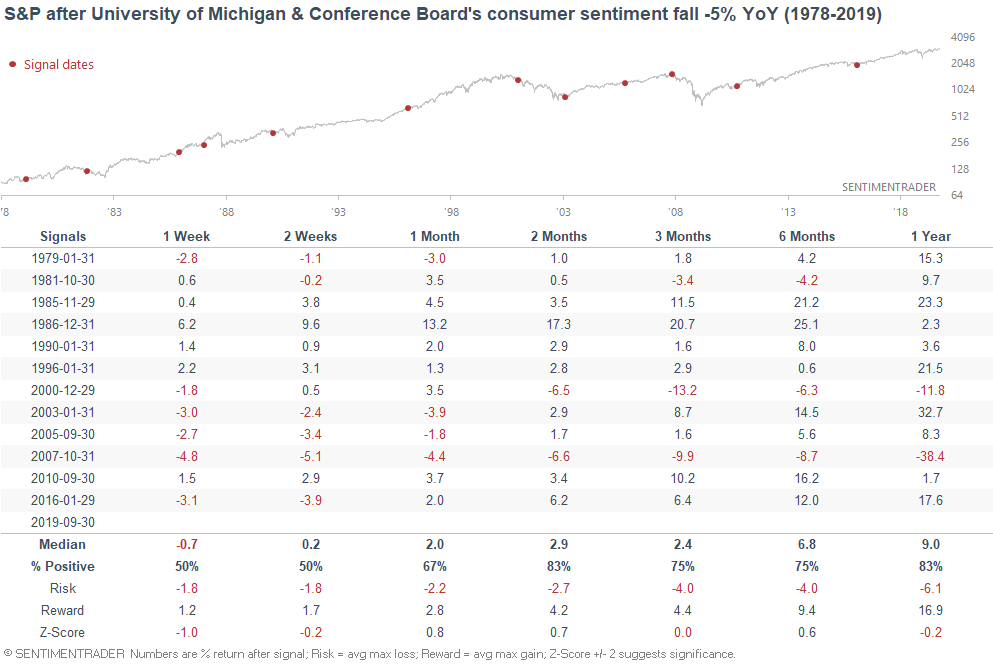
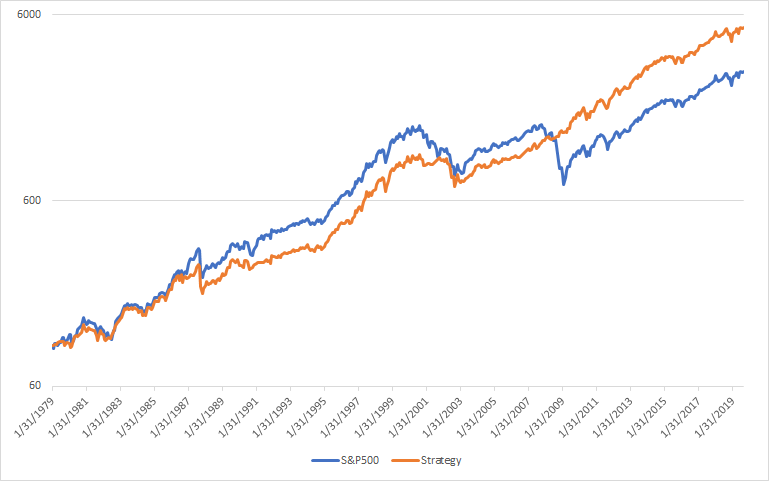
With that being said, now isn't the ideal time to buy stocks. It was better to buy stocks when both consumer sentiment indices' YoY change were above -5%. The following chart looks at what happens if you:
- Buy the S&P 500 when both consumer sentiment indices' YoY change >-5%
- Otherwise, buy the Bloomberg Barclays U.S. Treasury Bond Index
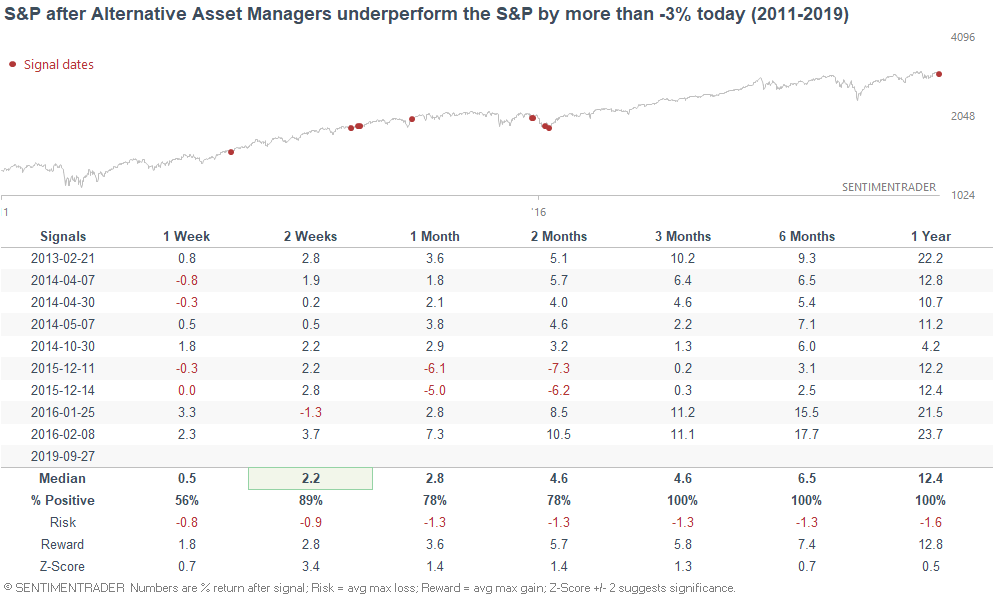
Alternative Asset Managers
As the Market Ear noted, Alternative Asset Managers significantly underperformed the S&P 500 on Friday. This is probably related to the recent selloff in momentum:
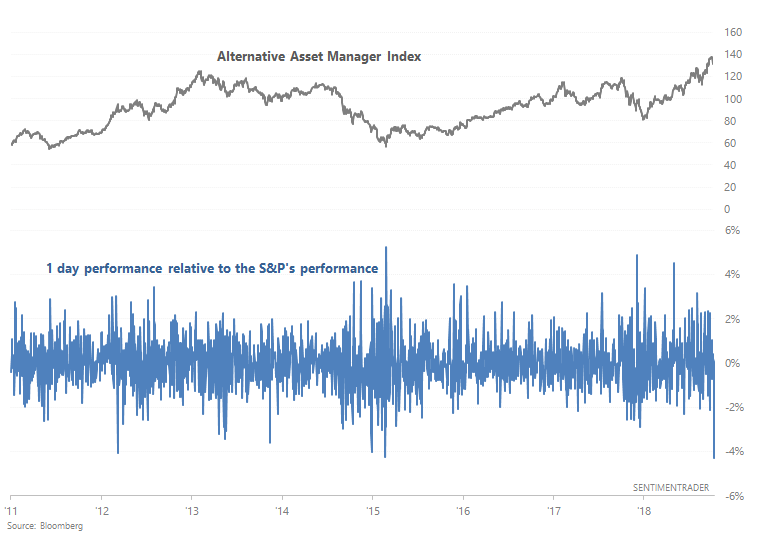
The last time alternative asset managers underperformed by this much was towards the end of the 2015-2016 stock market consolidation. And before that, it was mostly bullish for the S&P over the next 2 weeks and 3 months.
Long term breadth
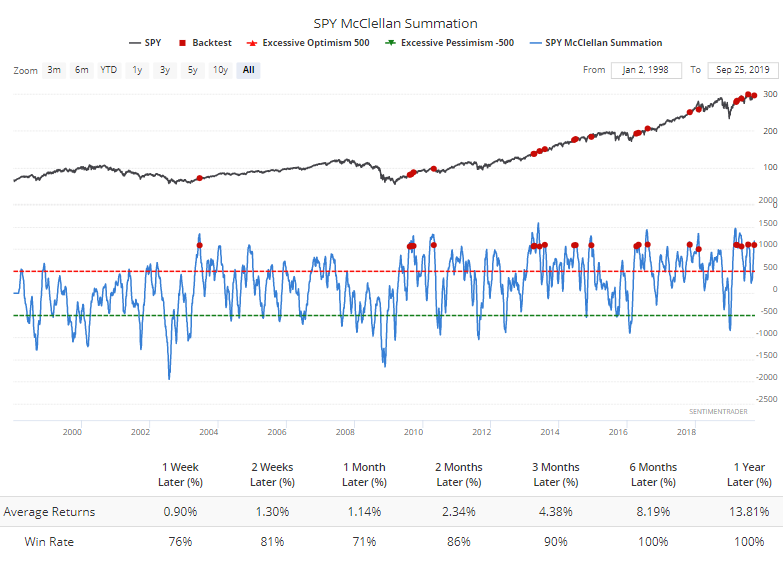
As Jason noted on Wednesday, the S&P 500's McClellan Summation Index is rolling over:
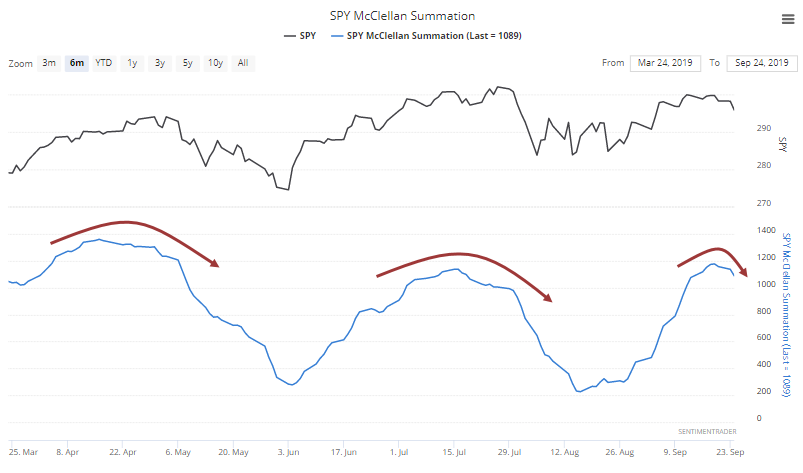
While some may see this as a worrisome sign for stocks, it usually wasn't over the next 2-3 months:
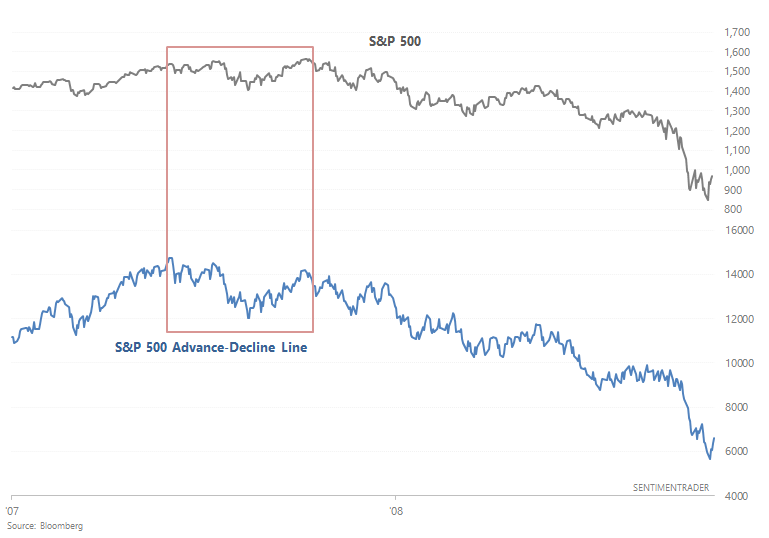
In addition, the popular S&P 500 advance-decline line continues to trend higher, having recently made a new high in mid-September.
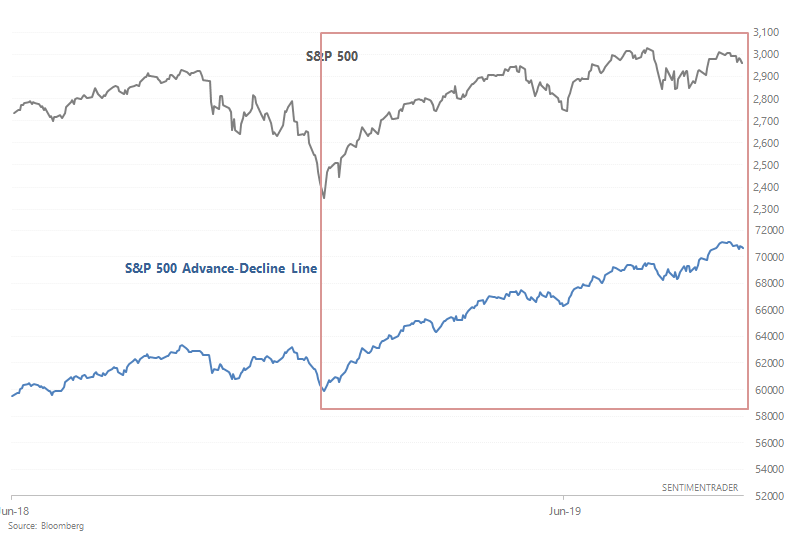
This stands in contrast with 2007, when the Advance-Decline Line peaked months before the S&P 500 peaked.
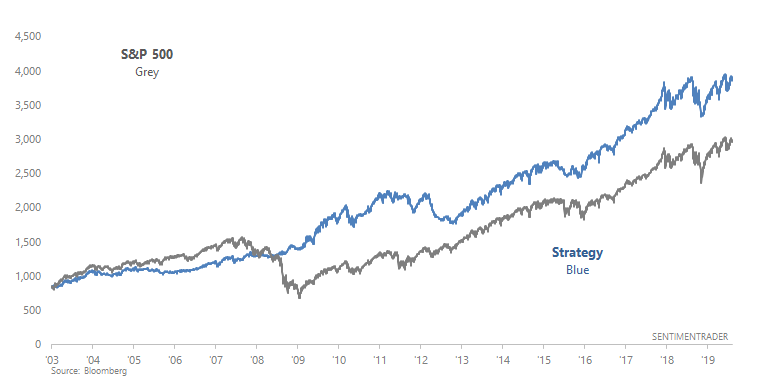
From 2003-present, here's what happened if you:
- Buy the S&P 500 if the Advance-Decline Line's 100 dma is going up
- Otherwise, buy the Bloomberg Barclays U.S. Treasury Bond Index
Economic Policy Uncertainty
As I mentioned on Thursday, there is a weak negative correlation between political uncertainty and stocks (e.g. uncertainty goes up, stock prices fall).
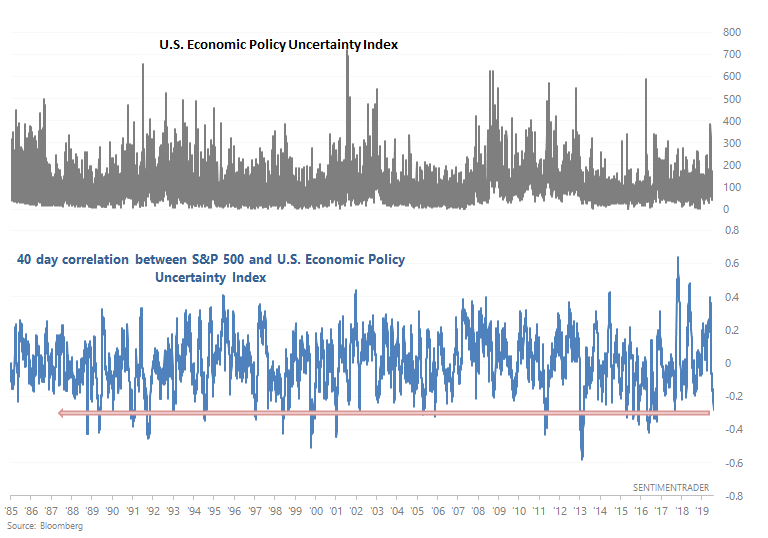
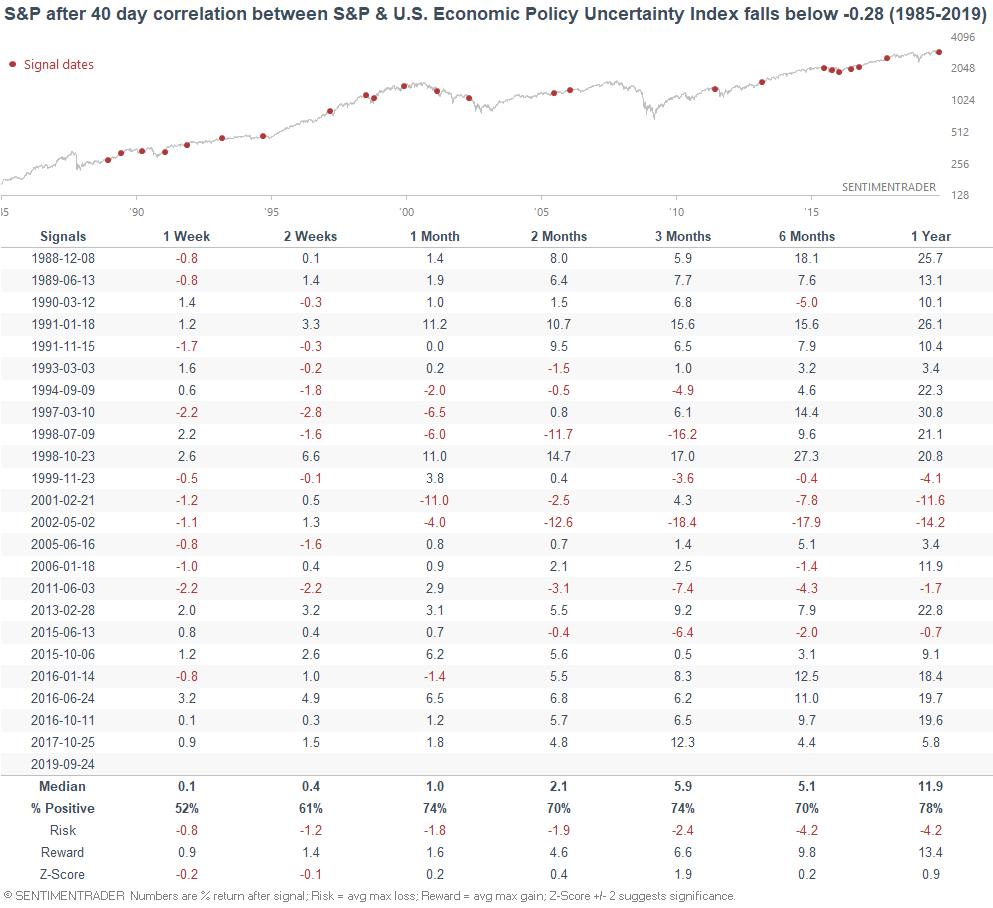
When the S&P and economic policy uncertainty were this inversely correlated in the past, the S&P's returns over the next 3 months were slightly more bullish than average.
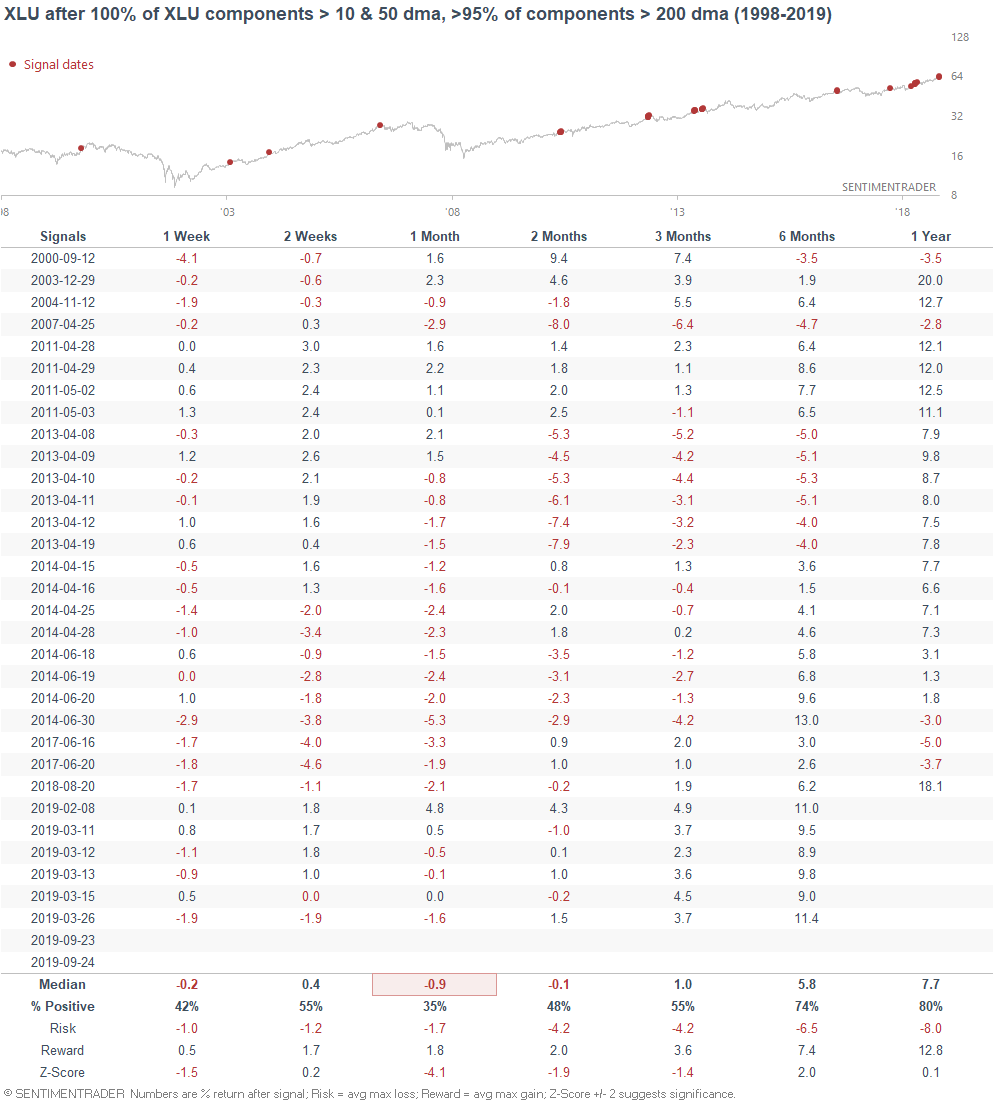
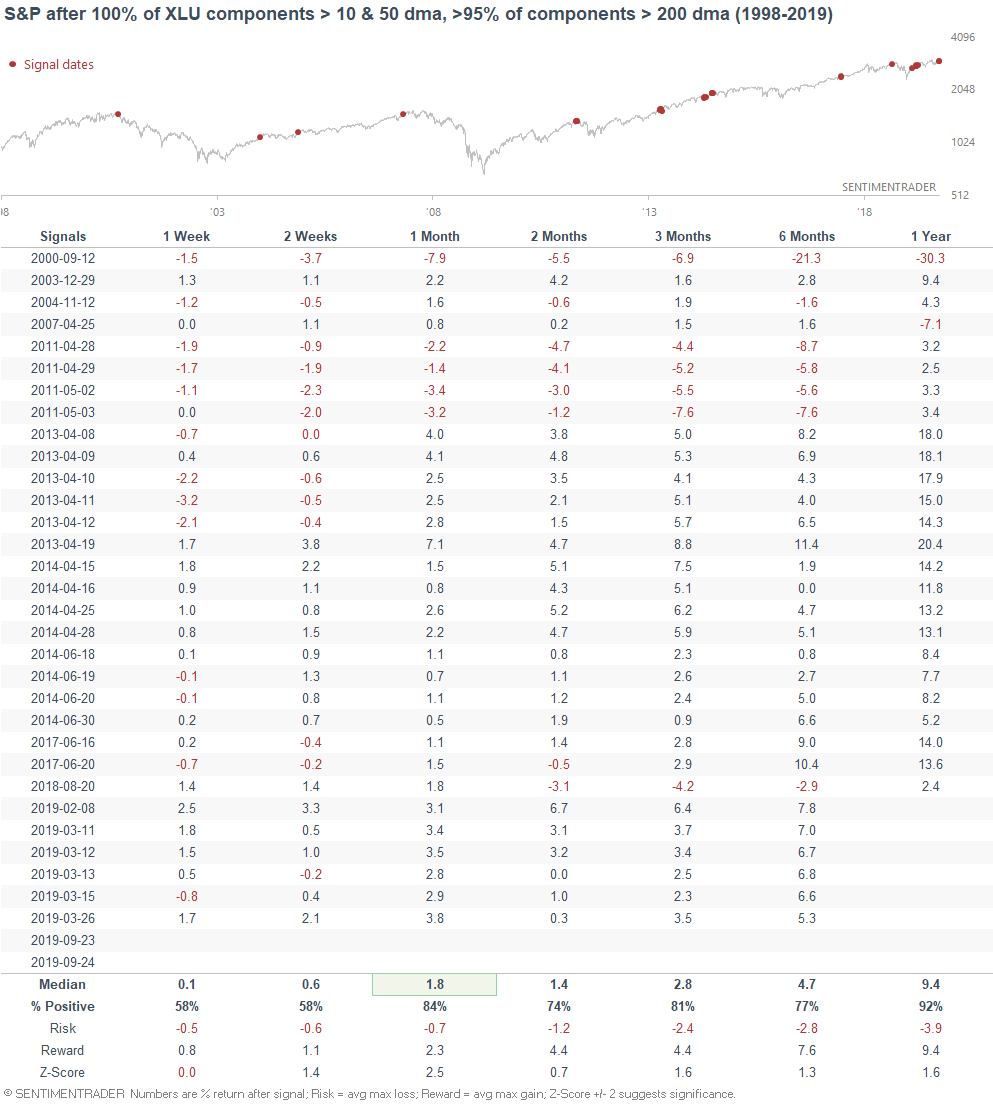
Utilities
As I mentioned on Thursday, there has been an extreme shift towards defensive sectors like utilities. XLU has registered very strong breadth readings - too strong. When it did so in the past, utilities were often weak over the next month, and the broader S&P 500 performed better:
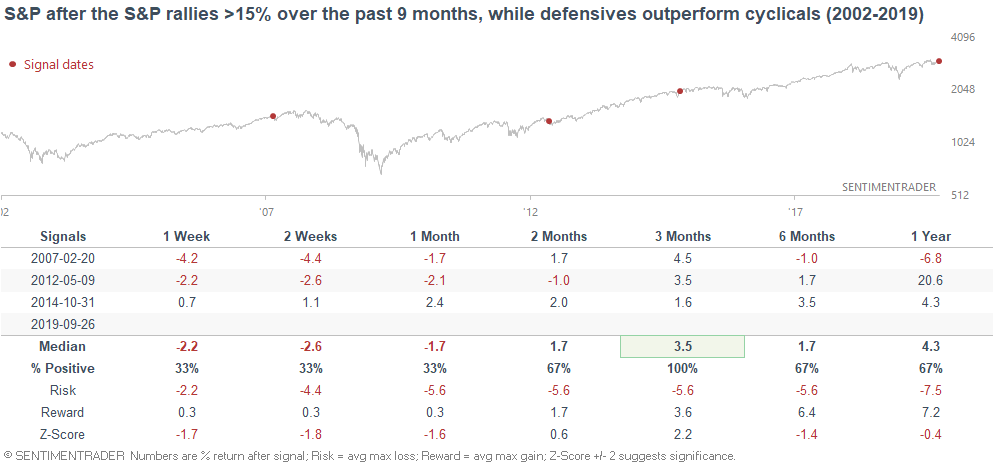
Moreover, Zerohedge noted that defensives have significantly outperformed cyclicals this year.
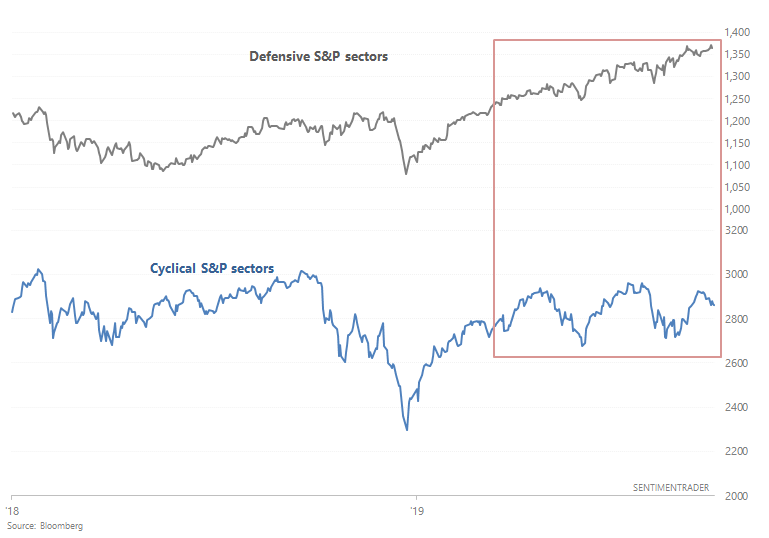
While this did happen before the 2007 bull market's top, there were other less ominous historical cases as well:
IPO fear
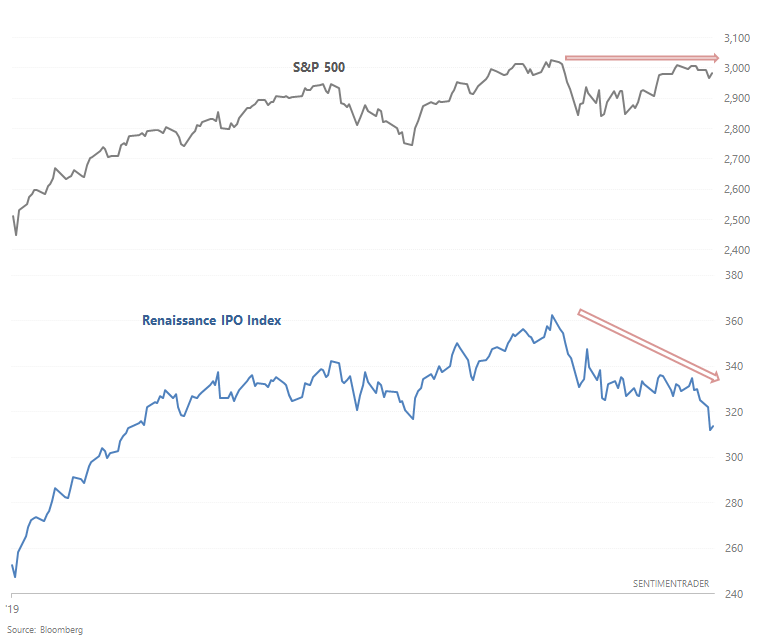
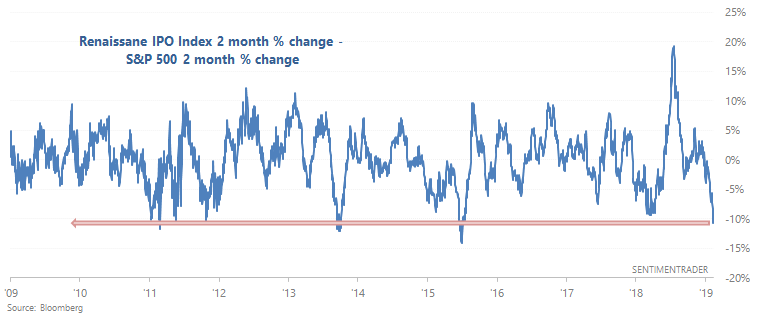
As I noted on Wednesday, investors and traders have been quite fearful of recent IPO's, causing the Renaissance IPO Index to significantly underperform the broad S&P 500 over the past 2 months:
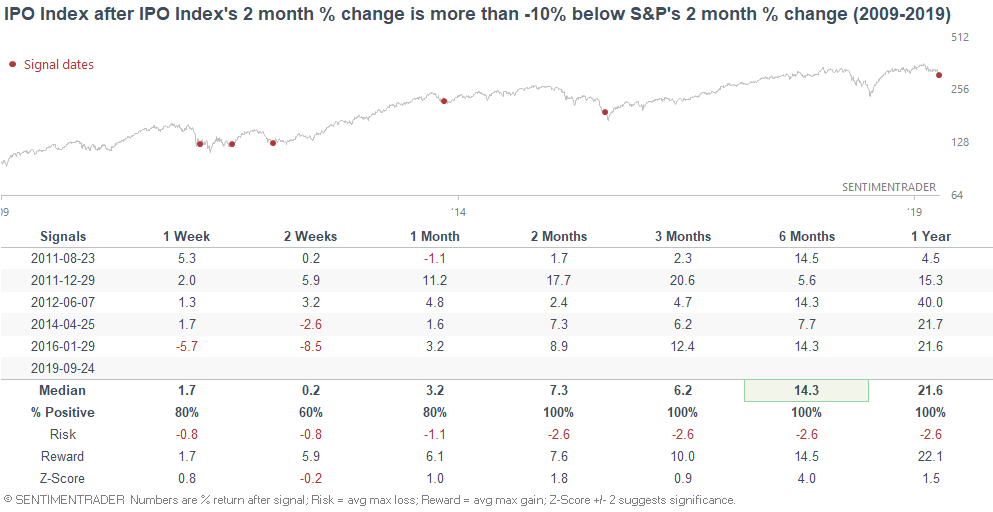
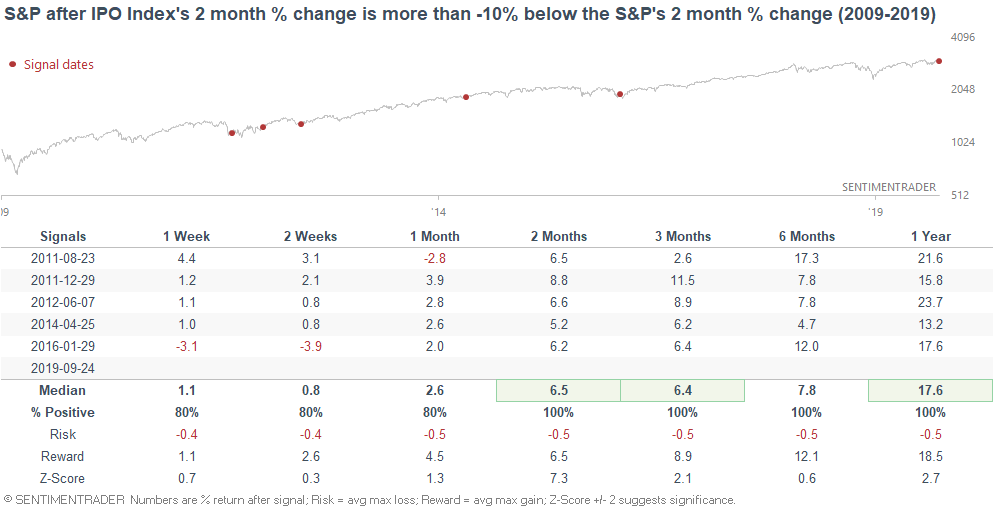
When this happened in the past, the IPO Index and S&P 500 typically did well over the next 2-3 months:
Neutral/Bearish:
Sentiment
One of the most notable things in markets today is that while the S&P 500 is near an all-time high, various sentiment indicators show a disproportionate amount of pessimism. For example, the Index Put/Call ratio remains consistently high over the past 6 days, and the NAAIM Exposure Index has fallen below 65.
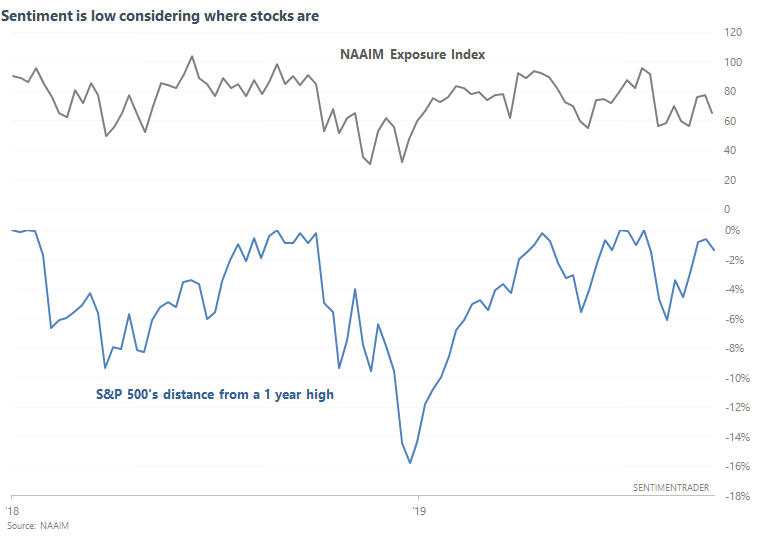
Historical cases when NAAIM was under 65% while the S&P was within 2% of a 1 year high typically occurred around periods of market stress. For example:
- 2006-2007: clear housing market deterioration
- 2010, 2011, 2012: EU problems
- 2014-2015: oil crash and emerging market crisis
- Now
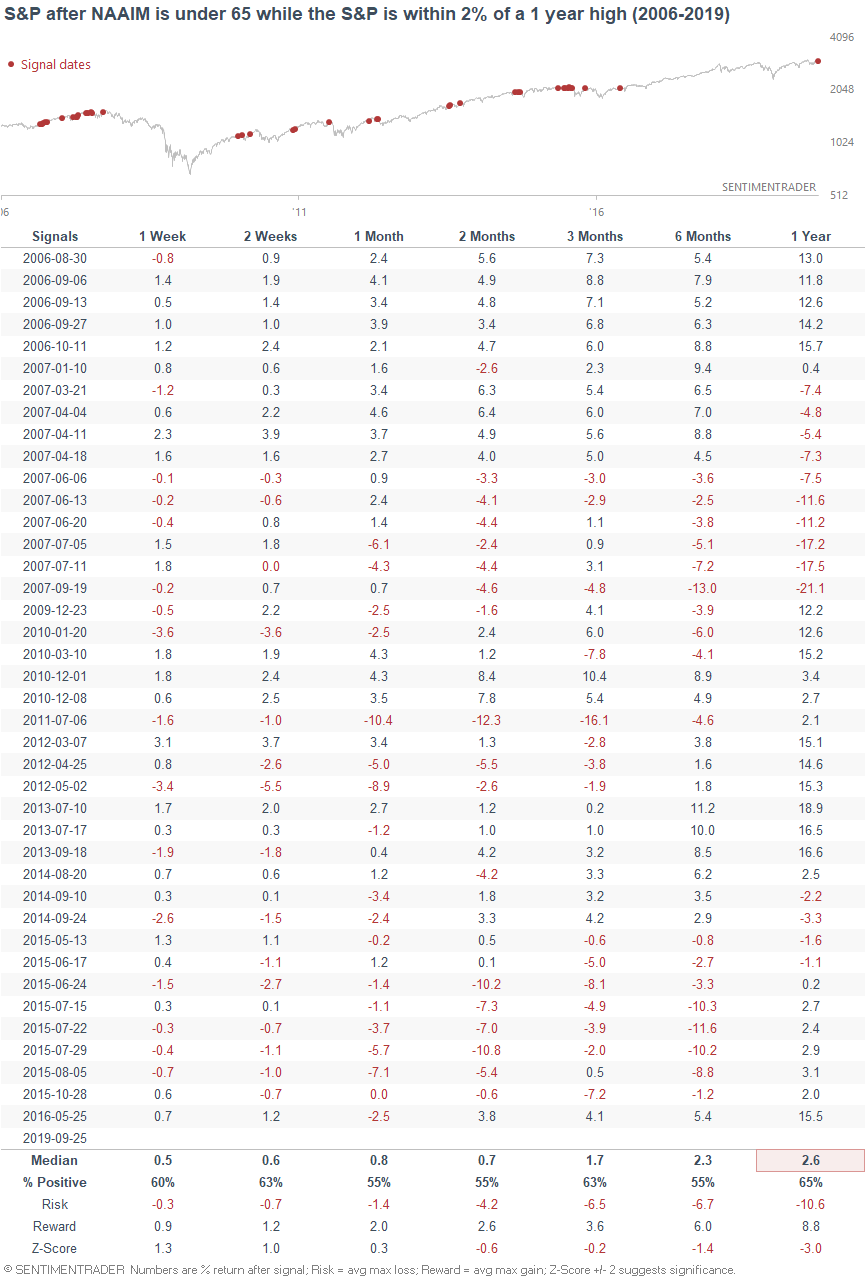
As a result, the S&P's forward returns over the next year were consistently worse than average. Sometimes these worries panned into nothing, and sometimes they turned into very real concerns.
To recap
- Long term risk:reward doesn’t favor bulls.
- Fundamentals (6-12 months): still bullish because there is no significant U.S. macro deterioration.
- Technicals (3-6 months): mostly bullish, although some of the medium term studies are having less of a bullish bias
*Economic Data charts (from "Fundamentals")
Housing Starts:
Building Permits:
New Home Sales:
ISM Manufacturing PMI:
10 year - 3 month yield curve:
Initial Claims:
Continued Claims:
Heavy Truck Sales:
Chicago Fed National Financial Conditions Credit Subindex:
Popular valuation indicator Shiller P/E:
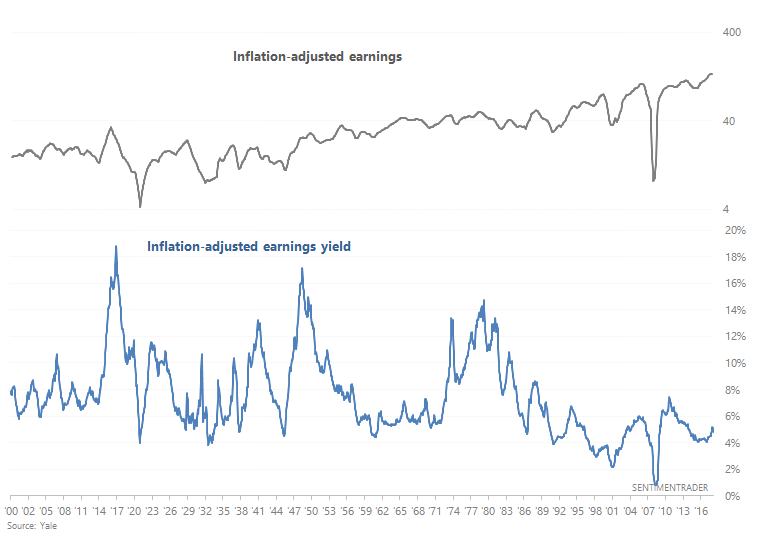
Inflation-adjusted S&P 500 earnings & inflation-adjusted forward earnings yield:
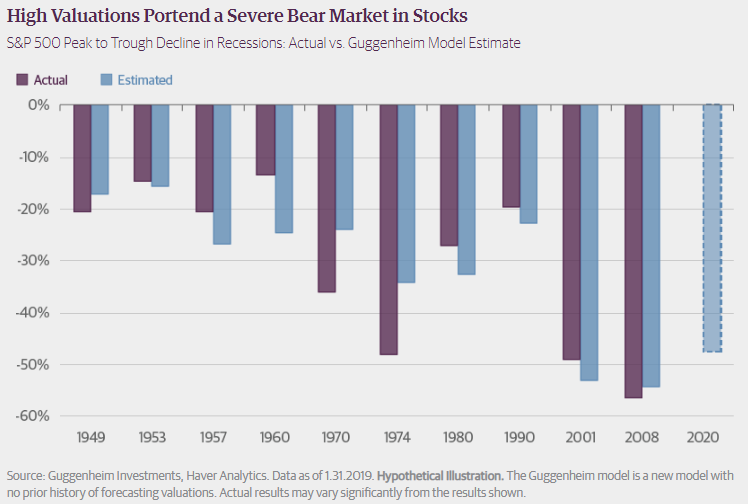
Here's an interesting chart from Guggenheim which demonstrates the relationship between the size of a recession-driven bear market and the stock market's valuations before the bear market: