What I'm looking at - stocks vs. politics, nonstop utilities surge, global money supply, Bitcoin's crash
With stocks fluctuating and generally going nowhere over the past 2 weeks, here's what I'm looking at:
Economic Policy Uncertainty vs. price action
Over the past few months I've seen a lot of media headlines like this:
- "Stocks going up on easing trade worries"
- "Stocks going down on trade worries"
It seems like the default "reason" for why stocks go up is because "political uncertainty is decreasing", and the default "reason" for why stocks go down is because "political uncertainty is increasing".
I generally don't care too much for these types of headlines, because it's pointless trying to attribute each day's price movements to a specific reason. (The shorter the time frame, the more random price action becomes). However, there is something to be said about the recent correlation between political uncertainty and stock market movements.
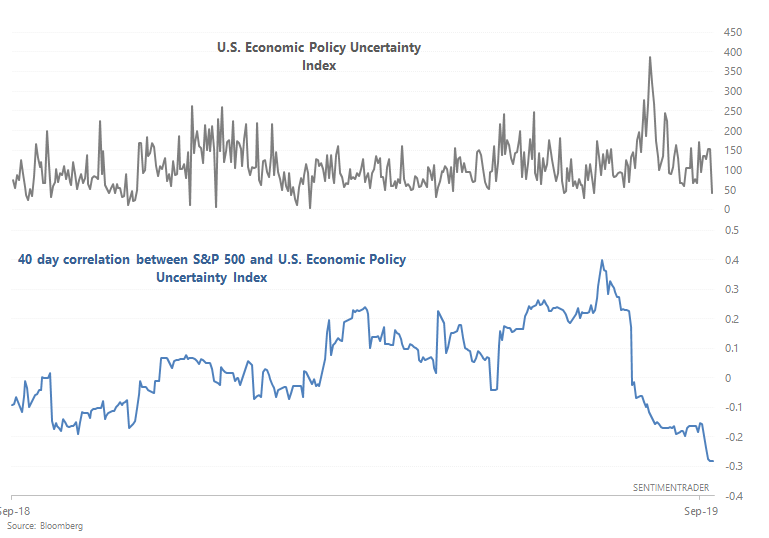
The following chart illustrates the 40 day correlation between the S&P 500 and the U.S. Economic Policy Uncertainty Index.
As you can see, there is a weak negative correlation between political uncertainty and stocks (i.e. uncertainty goes up, stock prices fall). This is about as inverse as this correlation gets:
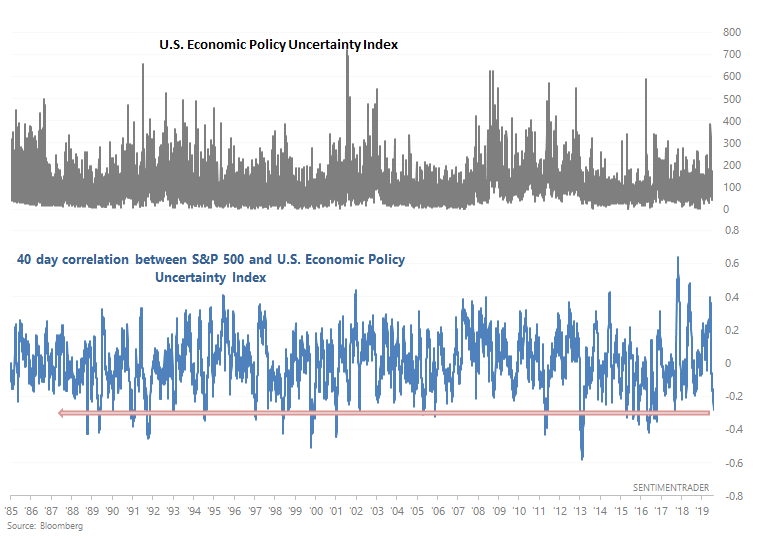
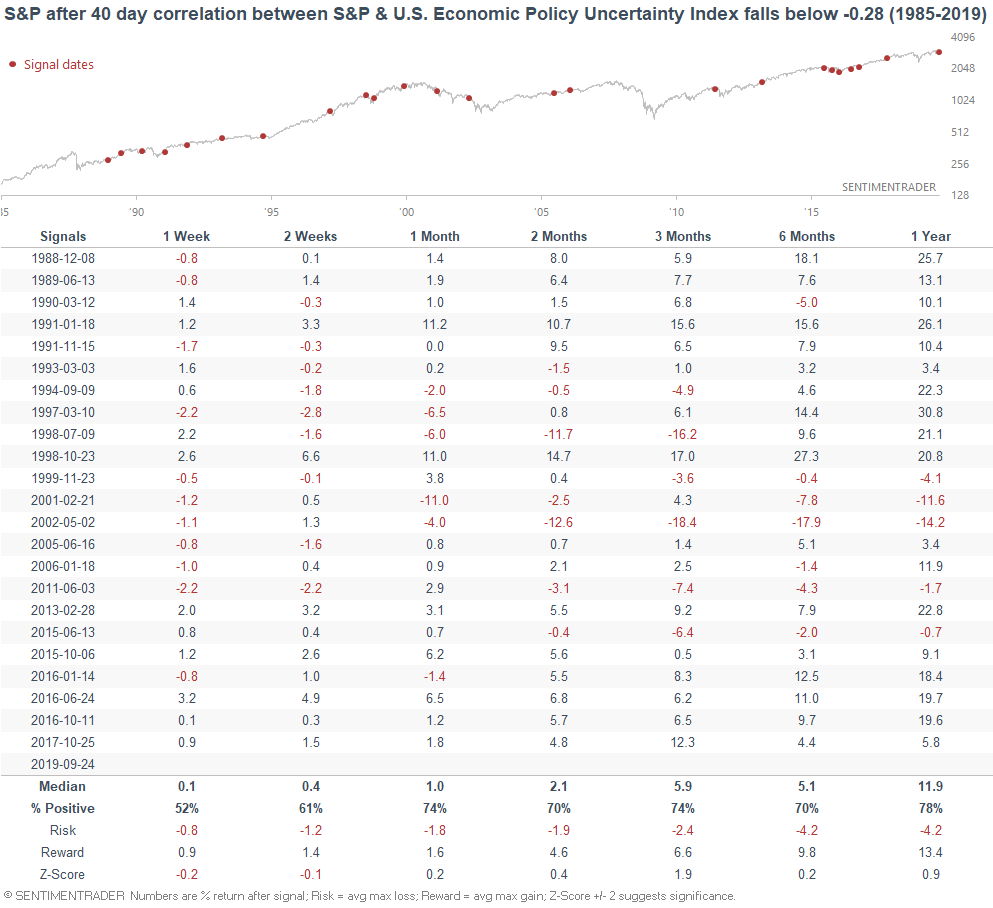
When the S&P and economic policy uncertainty were this inversely correlated in the past, the S&P's returns over the next 3 months were slightly more bullish than average.
Moreover, gold's forward returns over the next 2 months were slightly weaker than average (in case you were wondering if political uncertainty can still drive gold upwards).
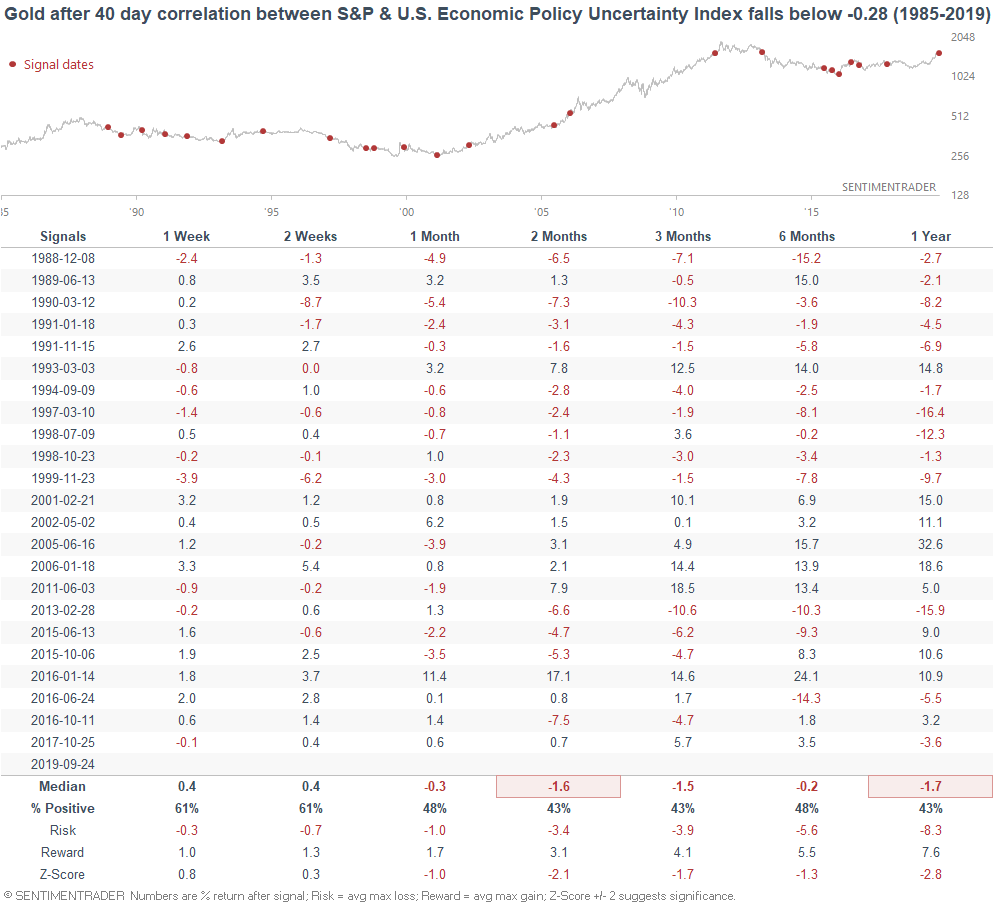
*This was not consistently bullish or bearish for the U.S. Dollar Index or 10 year Treasury yield.
Nonstop rotation towards utilities
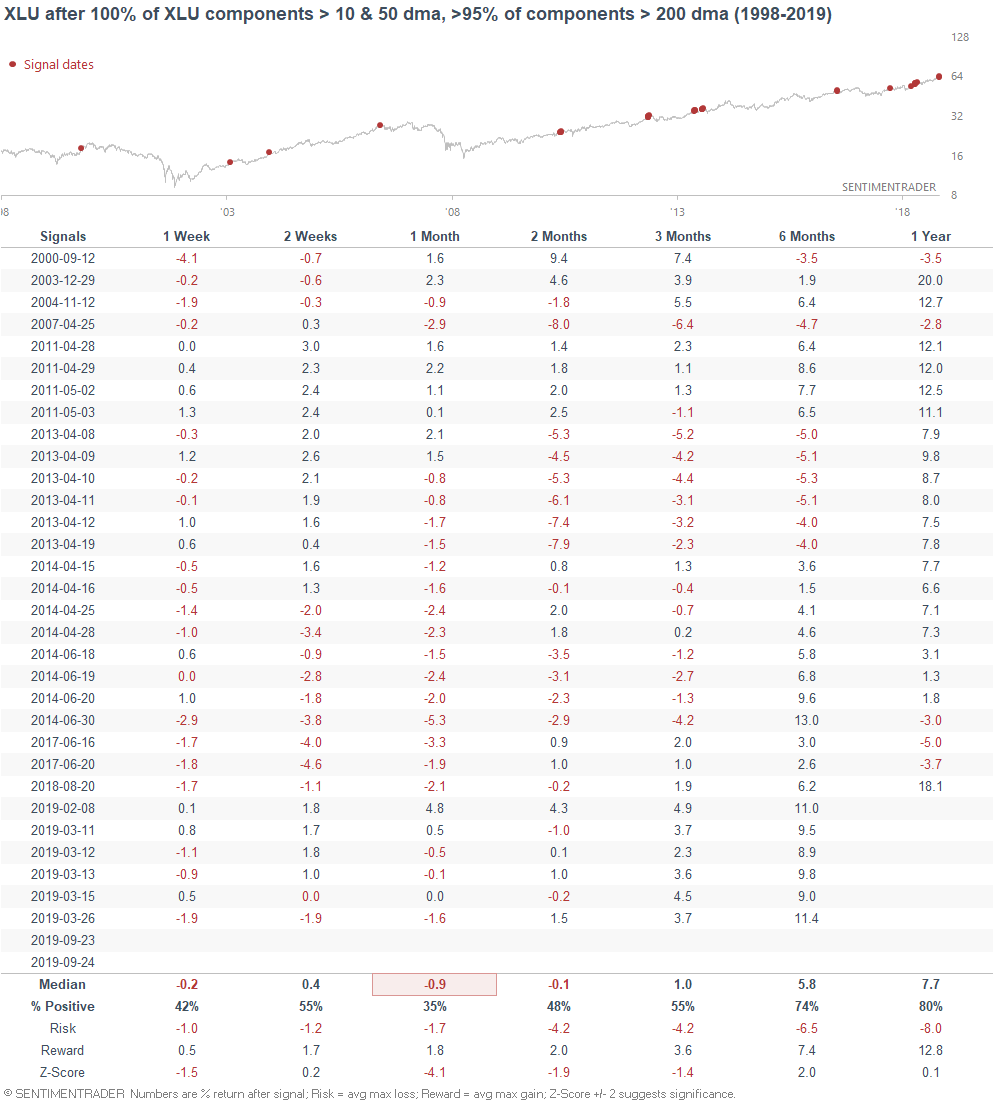
Utilities (defensive sector) continue to rally nonstop. As a result, 96% of XLU's components are above their 10 dma and 200 dma's, while 100% of components are above their 50 dma's.
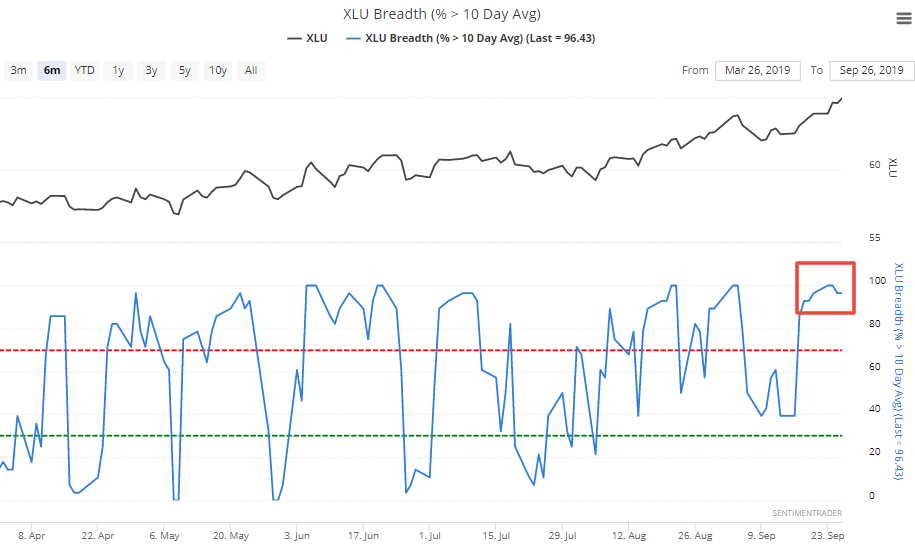
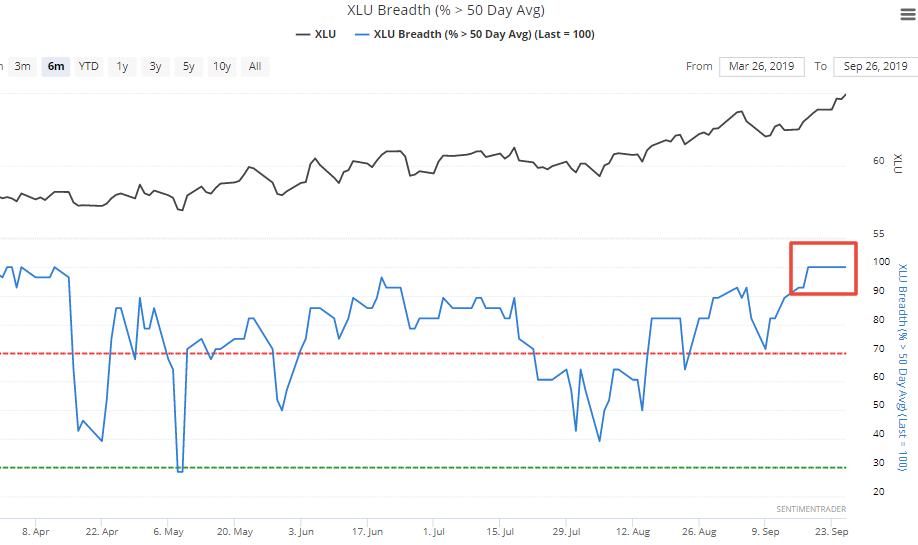
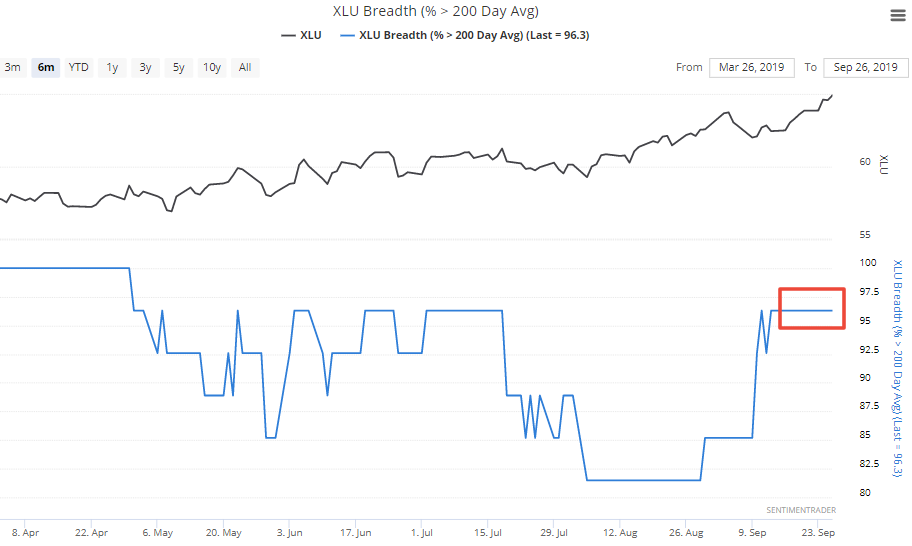
When XLU's breadth was this strong in the past, its returns over the next month were worse than average:
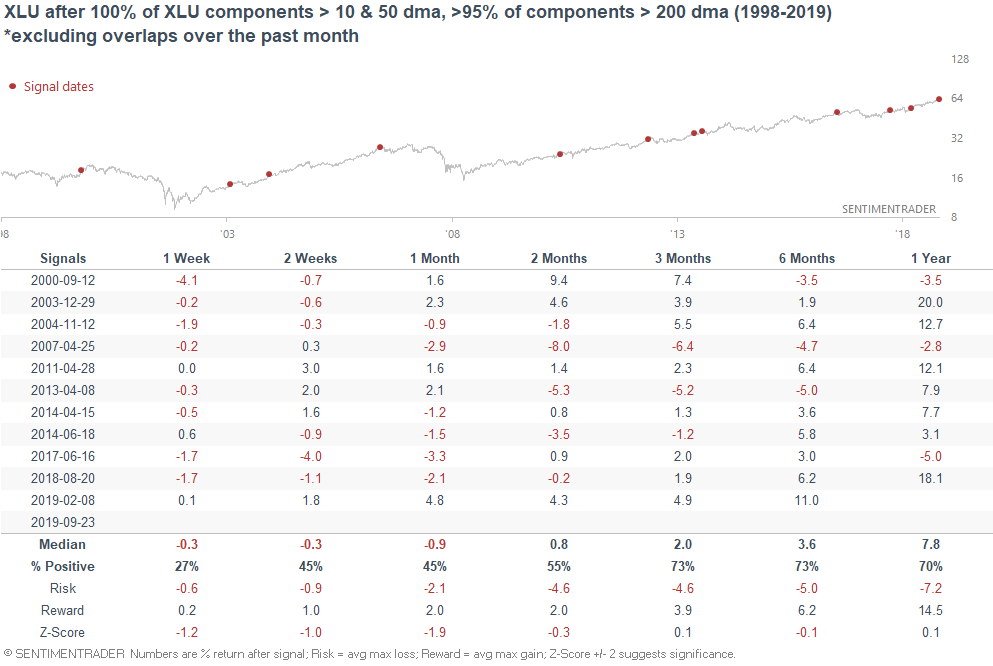
*Some of these historical cases are overlaps. But even if we eliminate overlaps over the past month, XLU's forward returns over the next month were still more bearish than average:
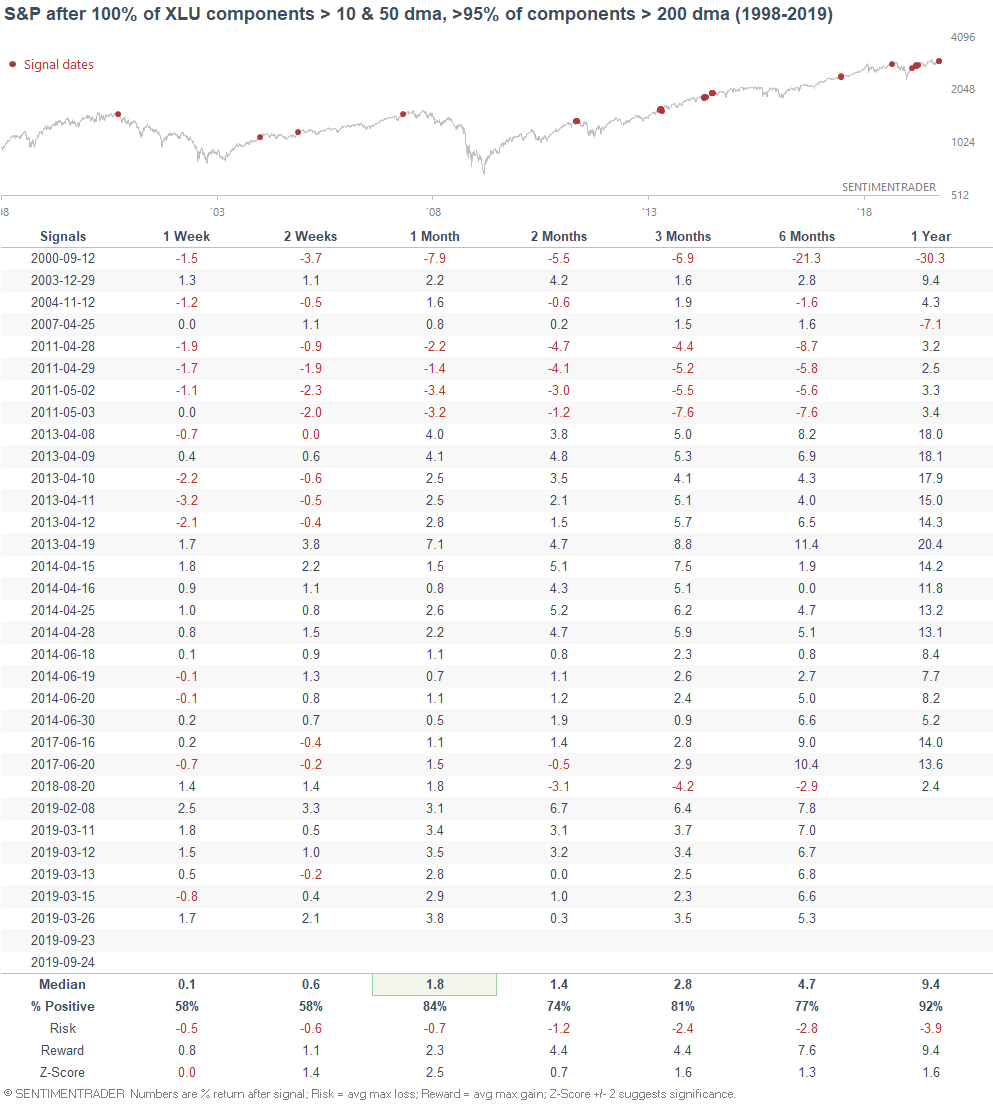
This was mostly bullish for the broad S&P 500 over the next month as investors and traders shifted away from defensive securities:
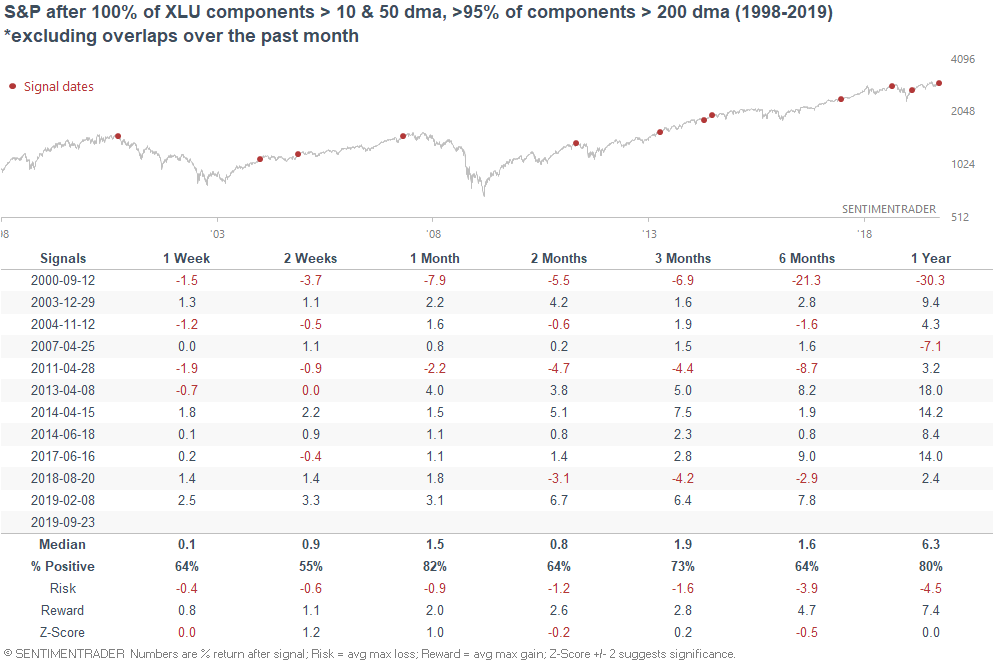
*Same chart, but excluding overlaps over the past month:
Moreover, XLU has outperformed the S&P 500 by more than 10% over the past 2 months. This is the largest outperformance since last year's stock market crash.
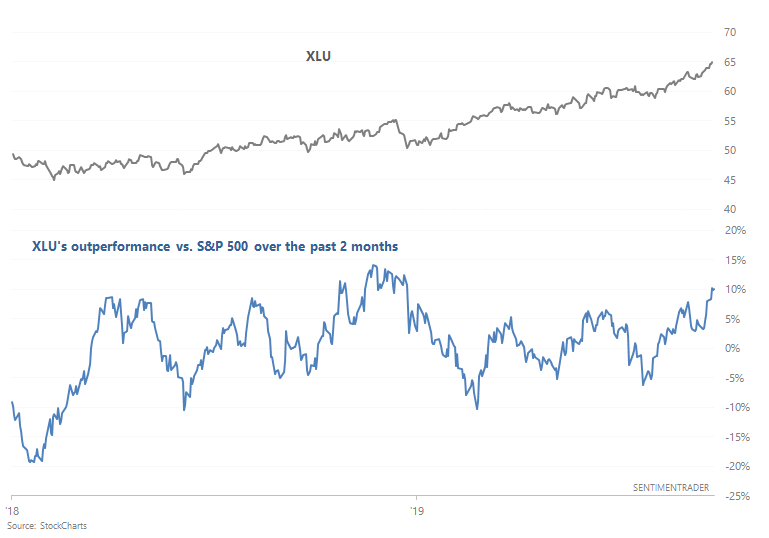
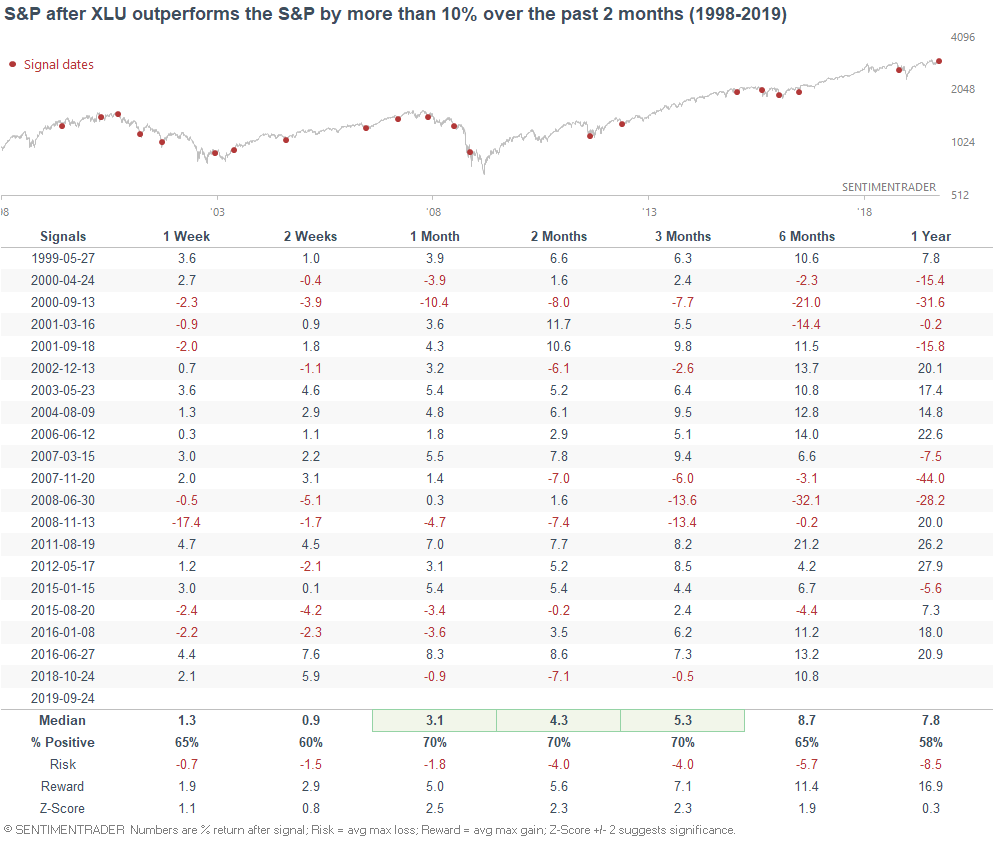
When utilities outperformed the S&P by this much in the past, there was typically a shift away from defensives and into the broader S&P over the next 1-3 months.
Here's what happened next to the S&P:
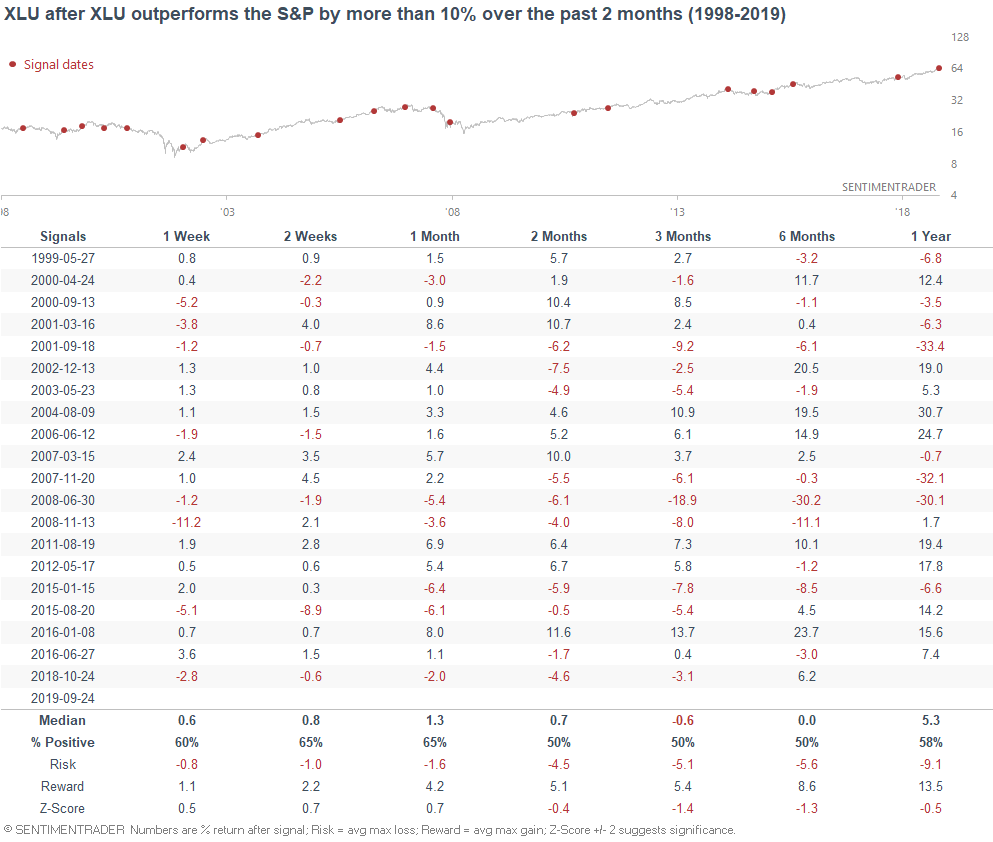
Here's what happened next to XLU:
Global Money Supply
As Zerohedge noted, the S&P 500 has diverged from the Global Money Supply:
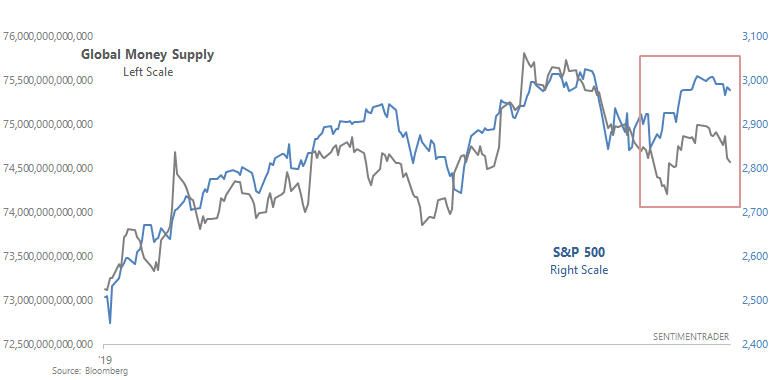
Is this bearish for stocks? The following table looks at every single case in which the Global Money Supply fell more than -1% over the past 3 months while the S&P went up:
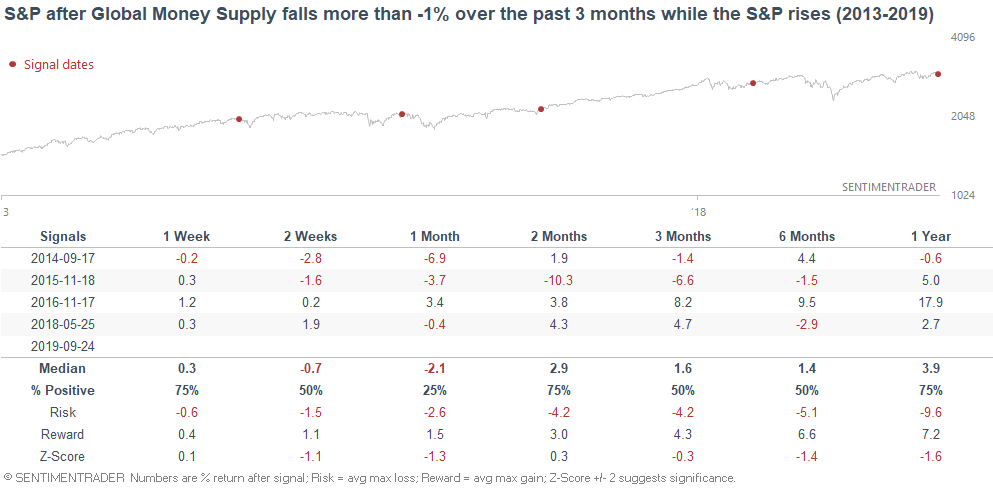
Risk:reward did not favor bulls over the next 6-12 months. However, the sample size is small and the historical data is extremely limited, so I wouldn't put too much weight on this.
Bitcoin's crash
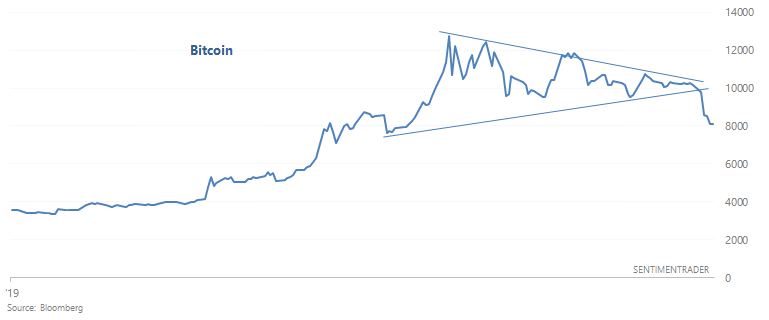
And lastly, let's touch upon Bitcoin.
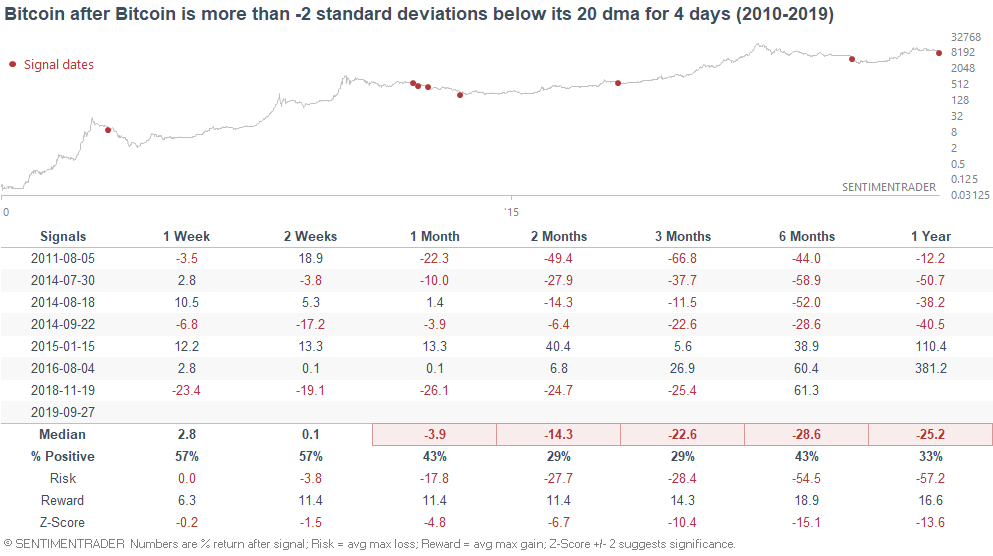
Bitcoin's trading range had been narrowing over the past few months, until the recent breakdown. Bitcoin's crash has pushed it more than -2 standard deviations below its 20 dma (used in Bollinger Bands) for 3 consecutive days.
When Bitcoin crashed for 3 days in the past, its forward returns were worse than random.
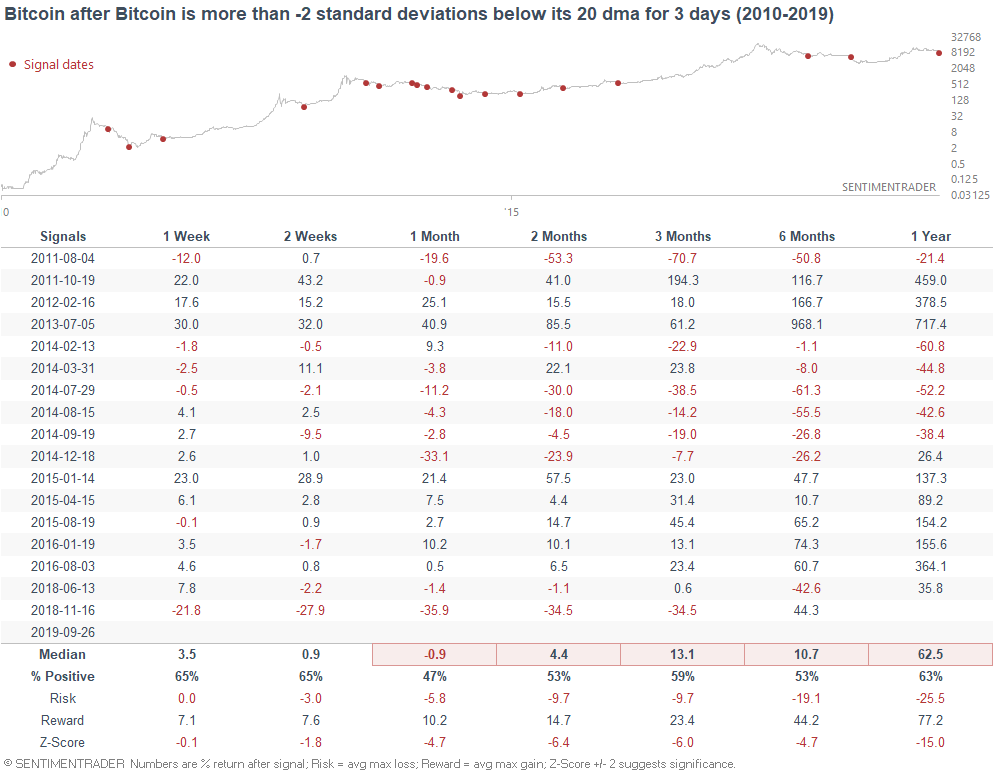
If Bitcoin fails to rally above its lower Bollinger Band today (4 days below its lower Bollinger Band), then its forward returns deteriorate even more.