What I'm looking at - IPO fear, Index Put/Call, Consumer Confidence, Baltic Dry Index, Bullish Percent Index
With stocks bouncing around near all-time highs, here's what I'm looking at:
IPO fear
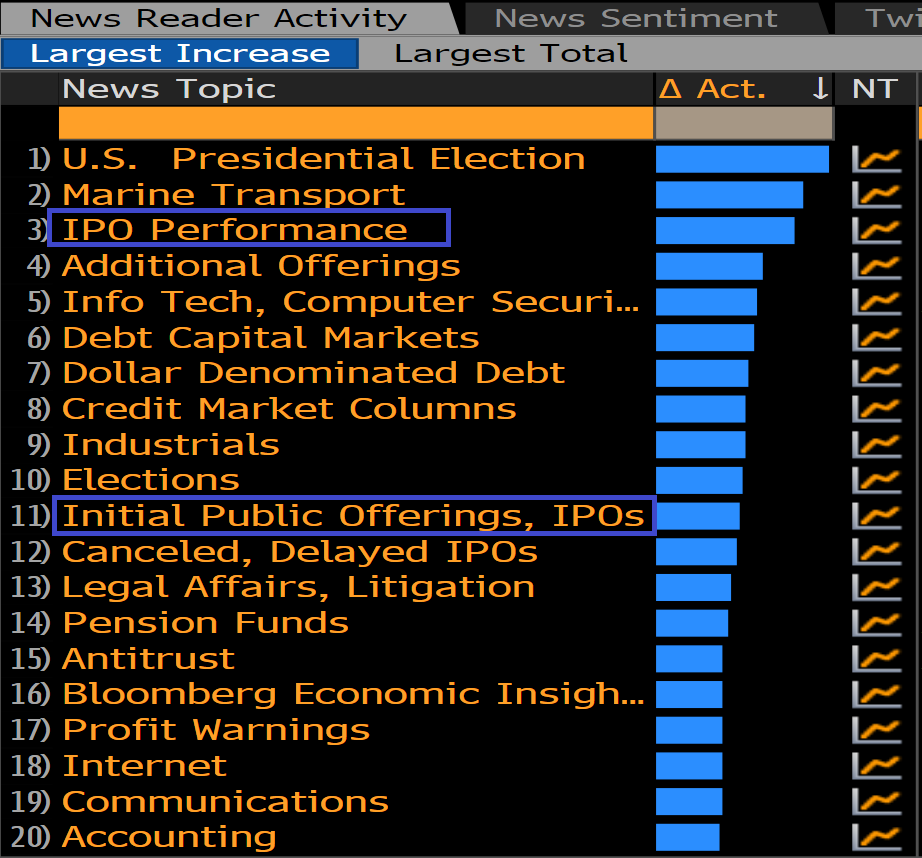
Much e-ink has been spilled about IPO's this year, with Uber's falling stock price and WeWork's back-to-earth wakeup. Looking at the list of trending topics on Bloomberg, it's clear that IPO's are on traders' minds:
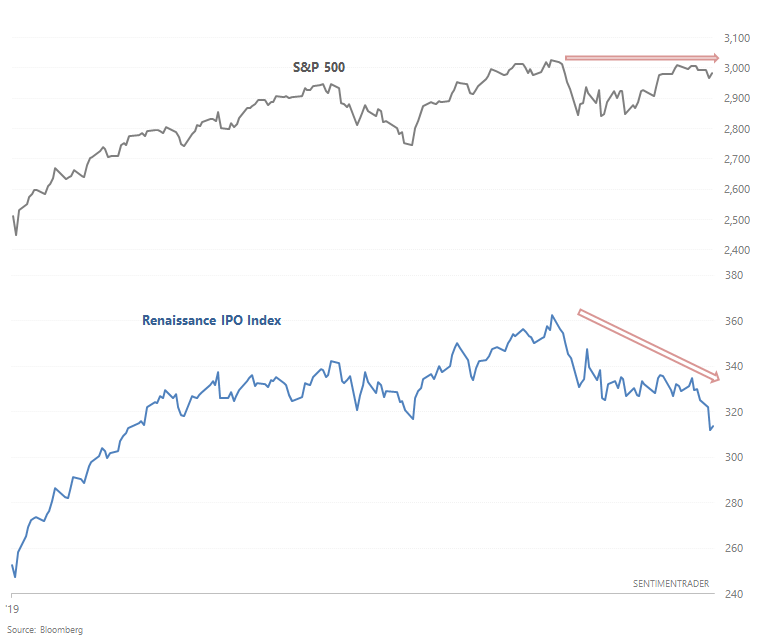
The Renaissance IPO Index, which tracks newly public companies over the last 2 years, is down more than -13% from its all-time high in July. This is quite a drop, considering that the S&P 500 is not far off its all-time high.
The recent drop in newly public companies has pushed the Renaissance IPO Index's 2 month rate-of-change deeply below the S&P 500's 2 month rate-of-change. From 2009 - present, this is one of the worst underperformances.
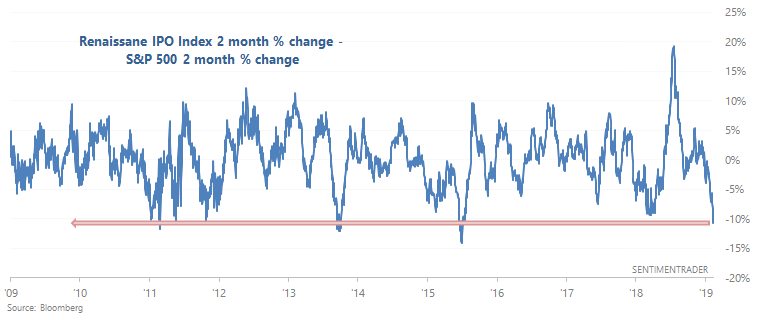
There are only 5 other unique historical cases in which the IPO Index underperformed by this much. All 5 cases saw stocks rally over the next 2-3 months.
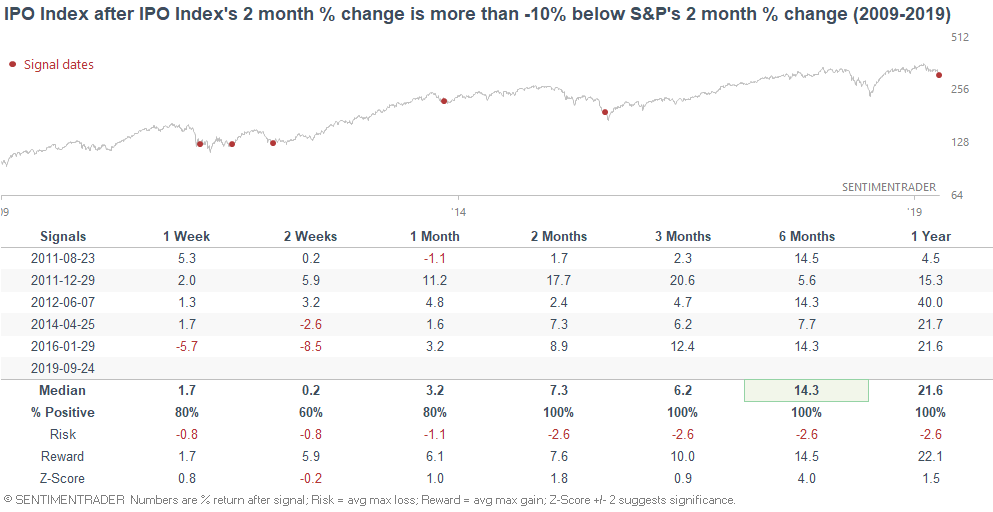
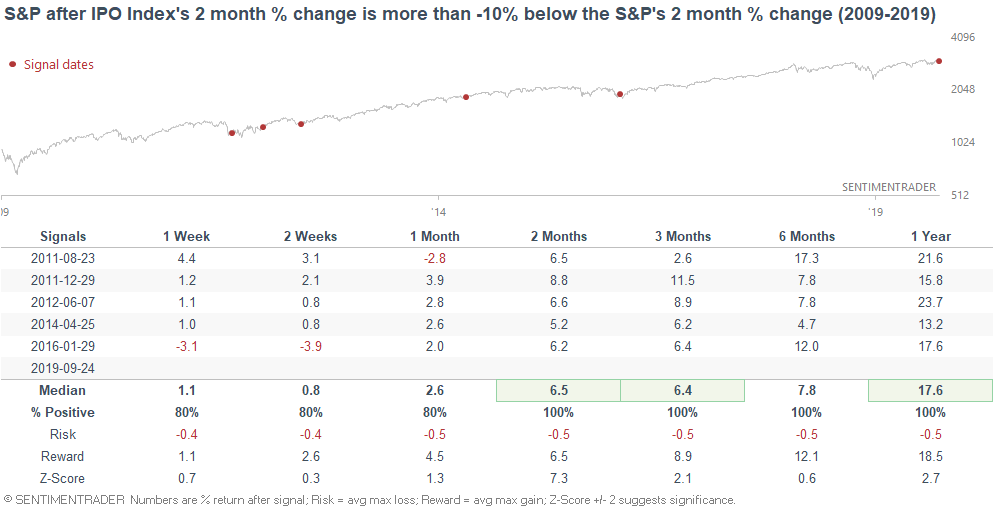
*Sample size is small, and the data is only from 2009-present.
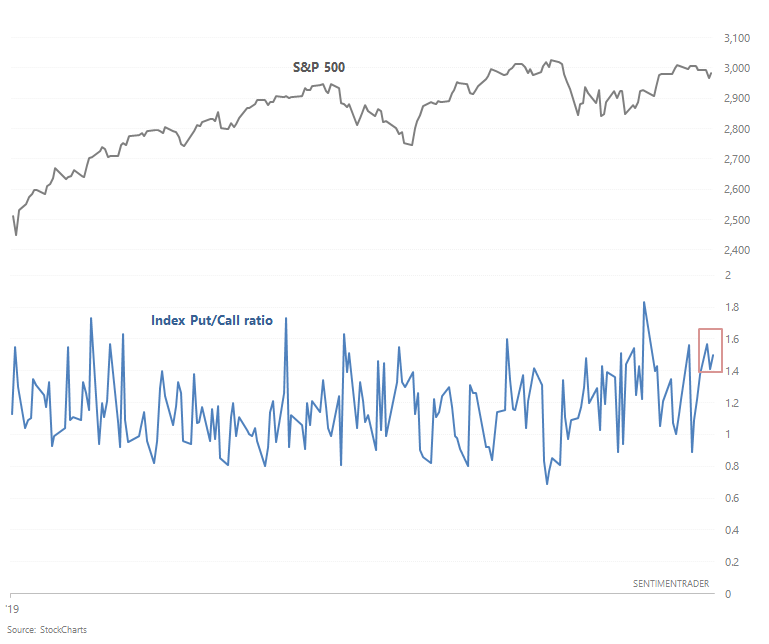
Index Put/Call ratio
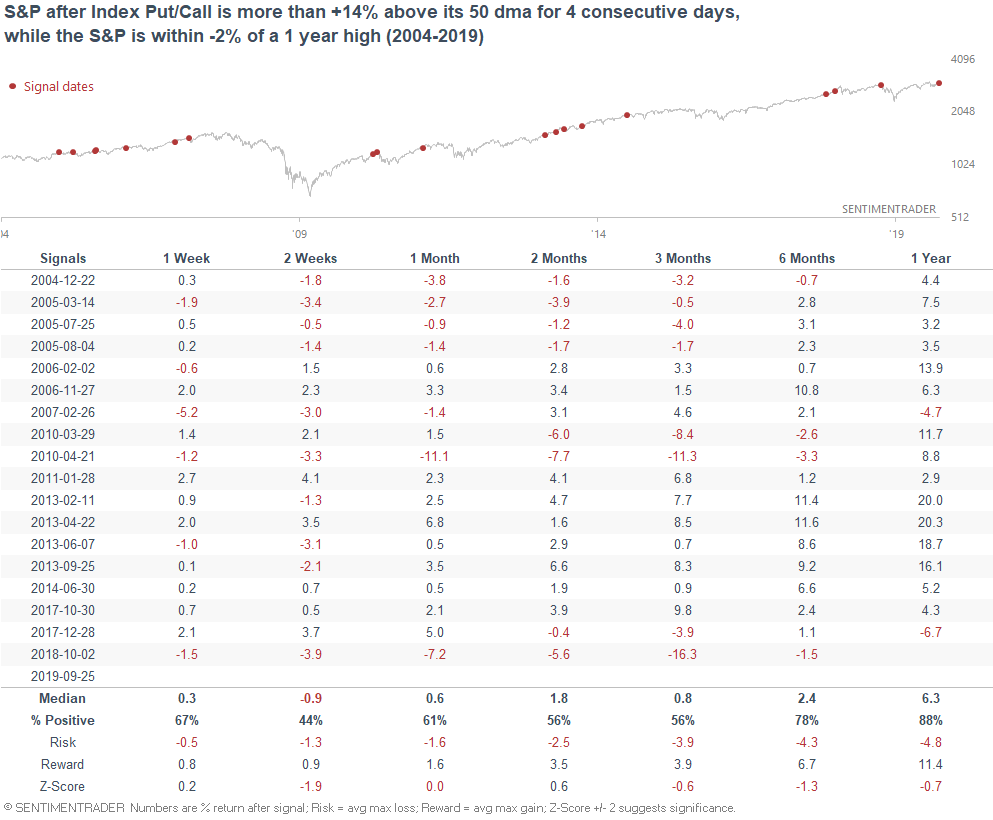
Speaking of fear, the Index Put/Call ratio is rather high given how little stocks have fallen. The Index Put/Call ratio has spent 4 days more than +14% above its 50 day average, even though the S&P is just 2% from an all-time high.
Such rapid jumps in the Index Put/Call ratio were slightly bearish for stocks over the next 2 weeks, as sometimes these fears panned out.
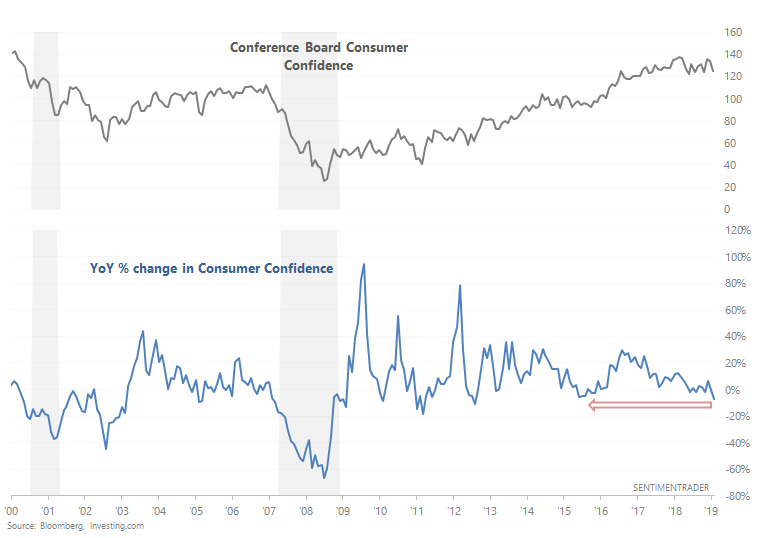
Consumer Confidence
As the WSJ noted, Consumer Confidence is starting to fall, with the YoY change at -7.5%. The Conference Board cites trade war worries for contributing to this decline.
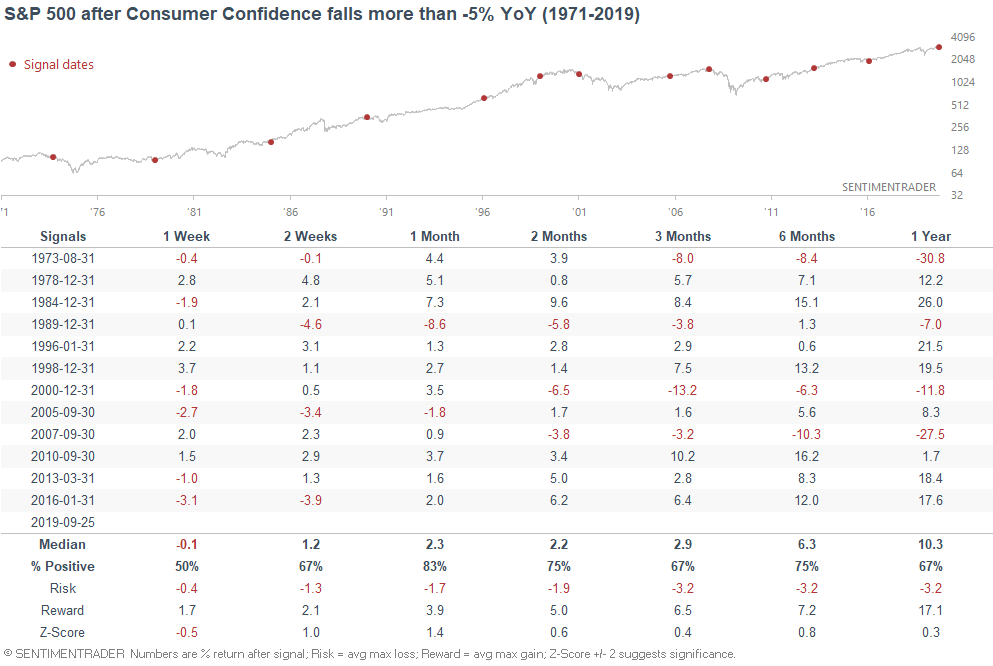
If we just look at cases in which Consumer Confidence fell more than -5% YoY (first time in 12 months), the U.S. stock market was not necessarily in immediate danger. This did happen in 2007, 2000, and 1973, but there were plenty of other false alarms or cases in which Consumer Confidence fell prematurely (e.g. 2016, 2005, 1998, 1996).
What if we only look at the late-cycle cases in which Consumer Confidence was high (>100) but coming down?
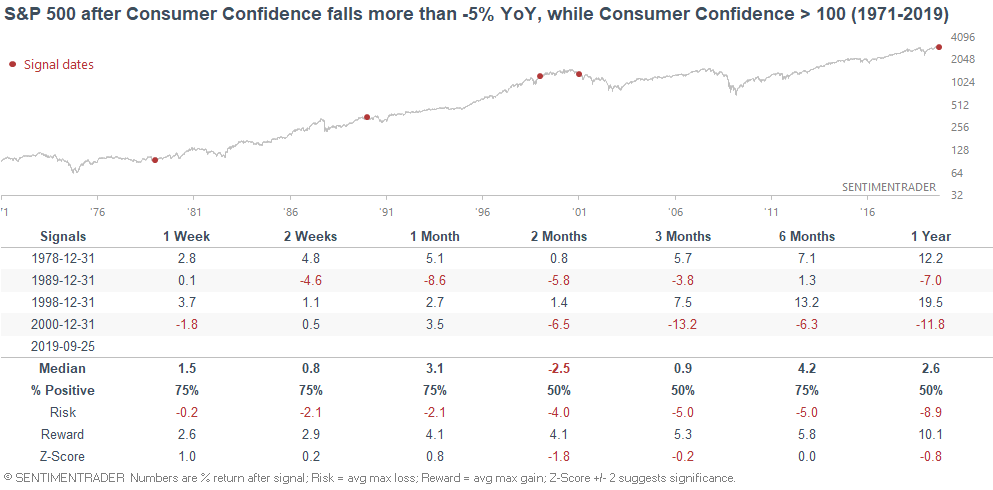
Less positive, and typically happen within 1.5 years of a recession. While I wouldn't consider this to be a SELL signal, it is a long term warning sign. Long term risk:reward does not favor bulls.
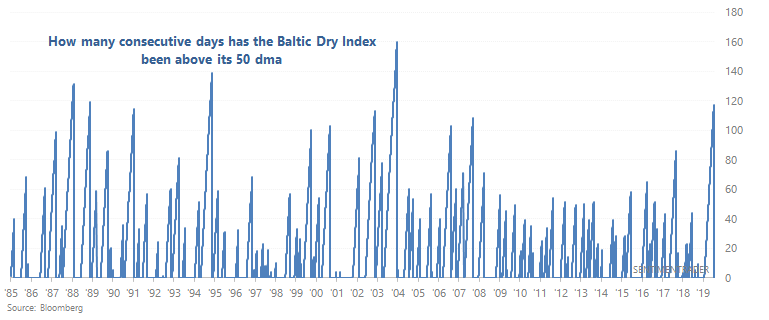
Baltic Dry Index
The Baltic Dry Index tracks the price of transporting various raw materials. Since this index essentially looks at supply and demand, it is often seen as a bellweather for global shipping. In financial circles, this indicator is mostly cited when it crashes (because it successfully predicted the 2008 crash), but doesn't really get mentioned when it surges.
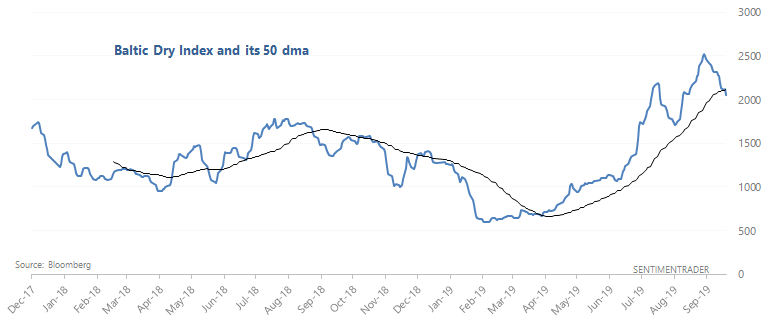
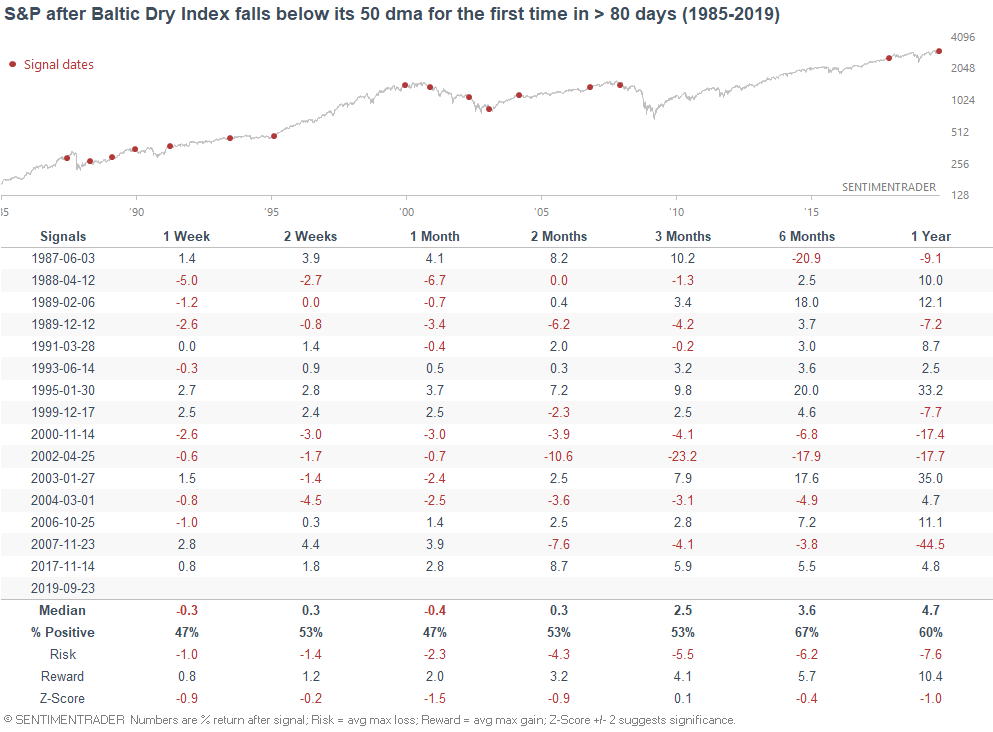
The Baltic Dry Index soared recently to a 9 year high, and is now starting to come down. It has fallen below its 50 dma for the first time in 117 days.
When such strong uptrends ended in the past, the S&P's 1-3 month forward returns were not necessarily bearish, but were worse than random:
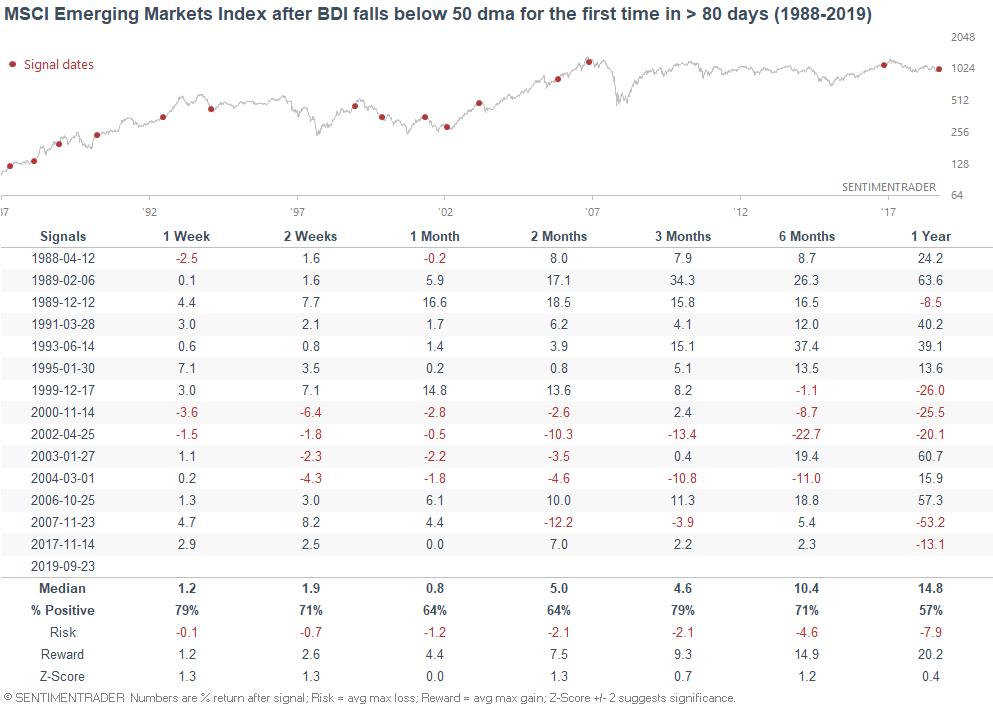
It was better for emerging markets:
Overall, I wouldn't consider the Baltic Dry Index to be a significant bullish or bearish factor for stocks. This isn't on my list of must-follow fundamental indicators.
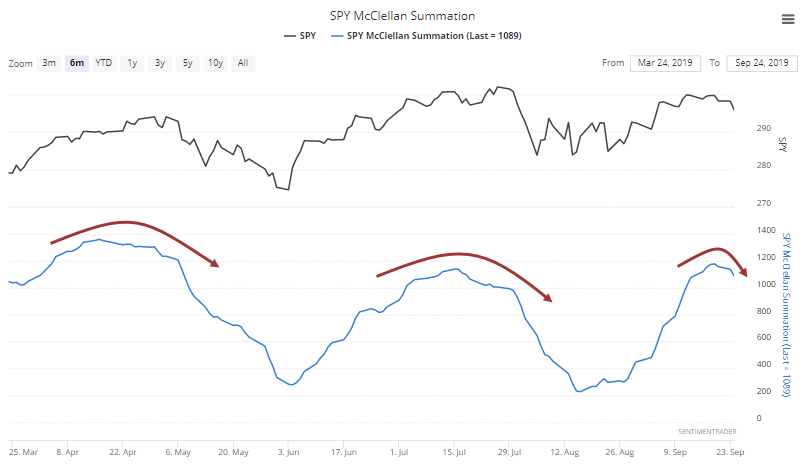
NYSE Bullish Percent Index
As Jason noted, the SPY McClellan Summation Index is rolling over from a very high level. While this might be seen as a worrisome sign, it typically wasn't because "strong momentum doesn't usually give up easily."
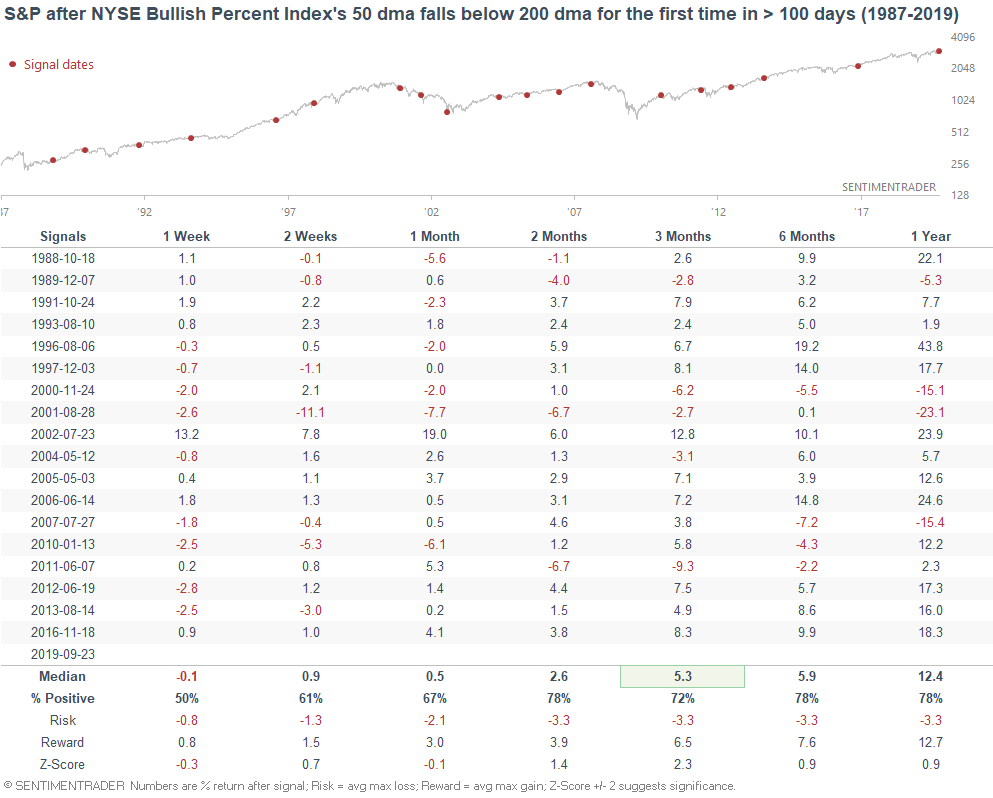
Similarly, the NYSE Bullish Percent Index (another breadth indicator) is starting to roll over, pushing its 50 day average below its 200 day average for the first time since March.
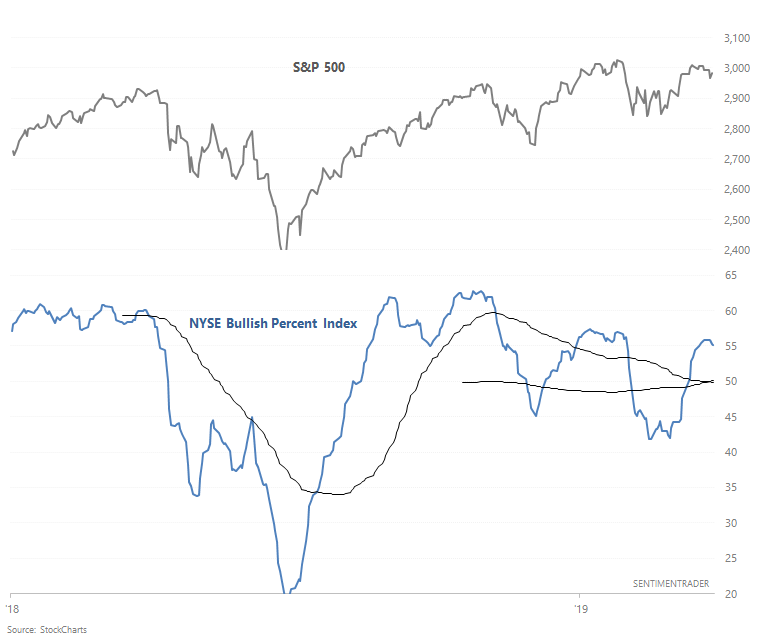
When the NYSE Bullish Percent Index first start to clearly trend downwards in the past, the S&P's 2-3 month forward returns were slightly more bullish than random.