Wednesday color - Utility surge impact on stocks/gold, breadth rollover, skittish signs, Egypt

Here's what's piquing my interest so far as stocks try to recover from yesterday's impeachment ding.
Another Ute Surge
Utility stocks once again were the heroes on Tuesday, providing a counter to overall weakness in stocks. As a result, there was yet another jump in those stocks hitting their highest price in at least the past 52 weeks.
It has proved to be a challenge for the sector to maintain gains after such broad buying interest like this.
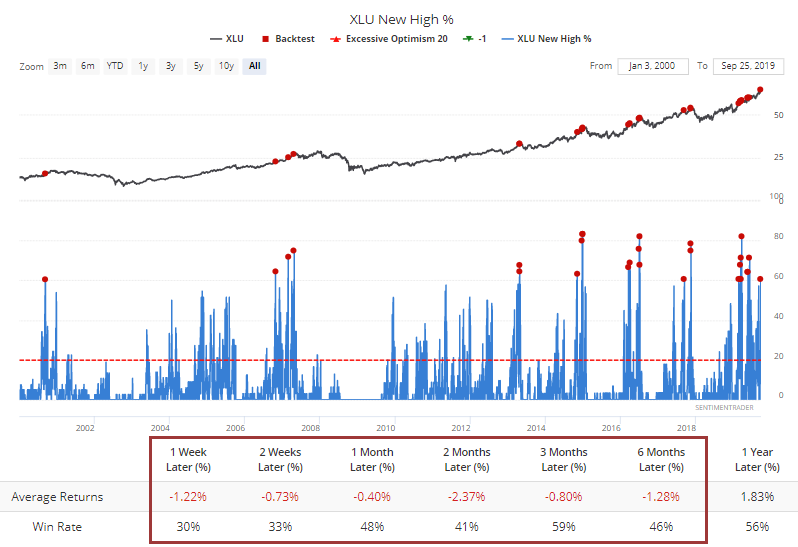
Zooming in on just the past year, the sector has been able to shrug off these readings better than it has in the past.
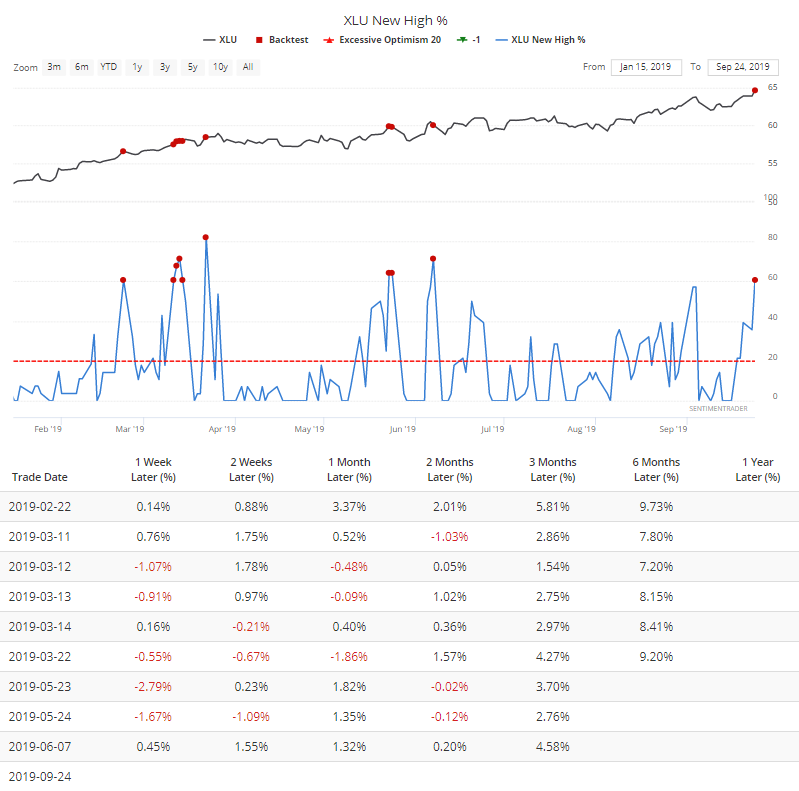
It's not just the jump in 52-week highs in the sector that's notable. Most of the metrics are showing a sharp increase in buying pressure. An aggregate breadth measure is now the 2nd-highest in the past year.
Since 1990, this too has usually meant the sector was about to take a short-term rest at least.
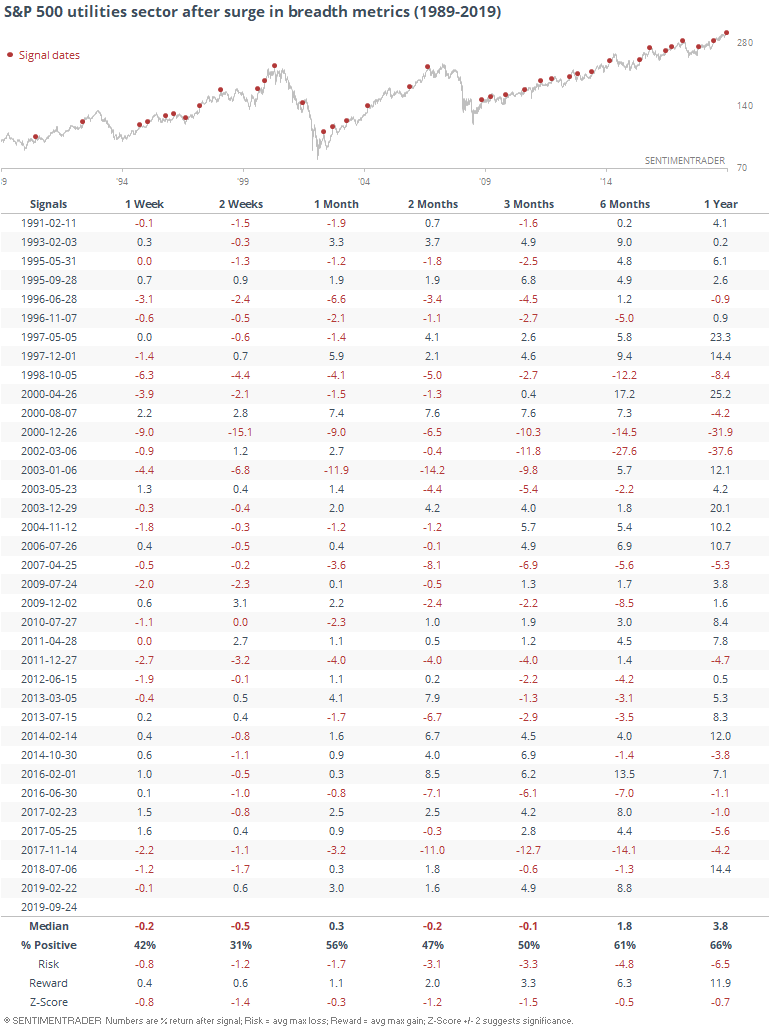
Out of the 36 signals, only 5 of them managed to show a positive return over every time from from 1-4 weeks later.
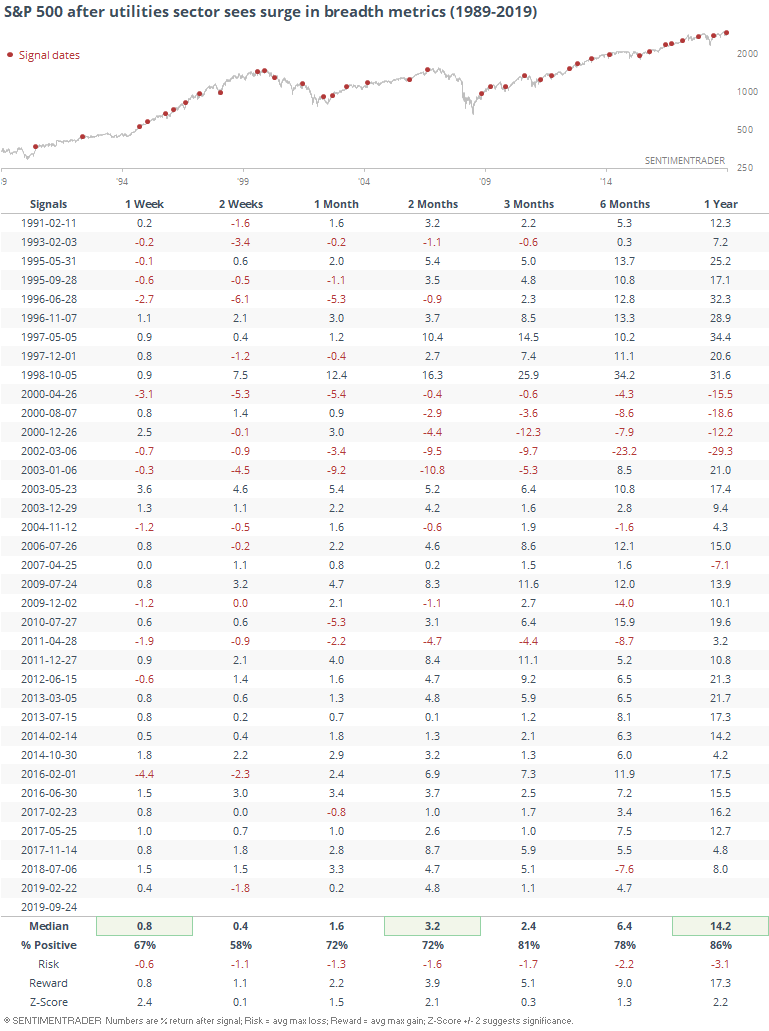
While it wasn't the best sign for the normally staid utilities sector, it was for the broader S&P 500 index itself.
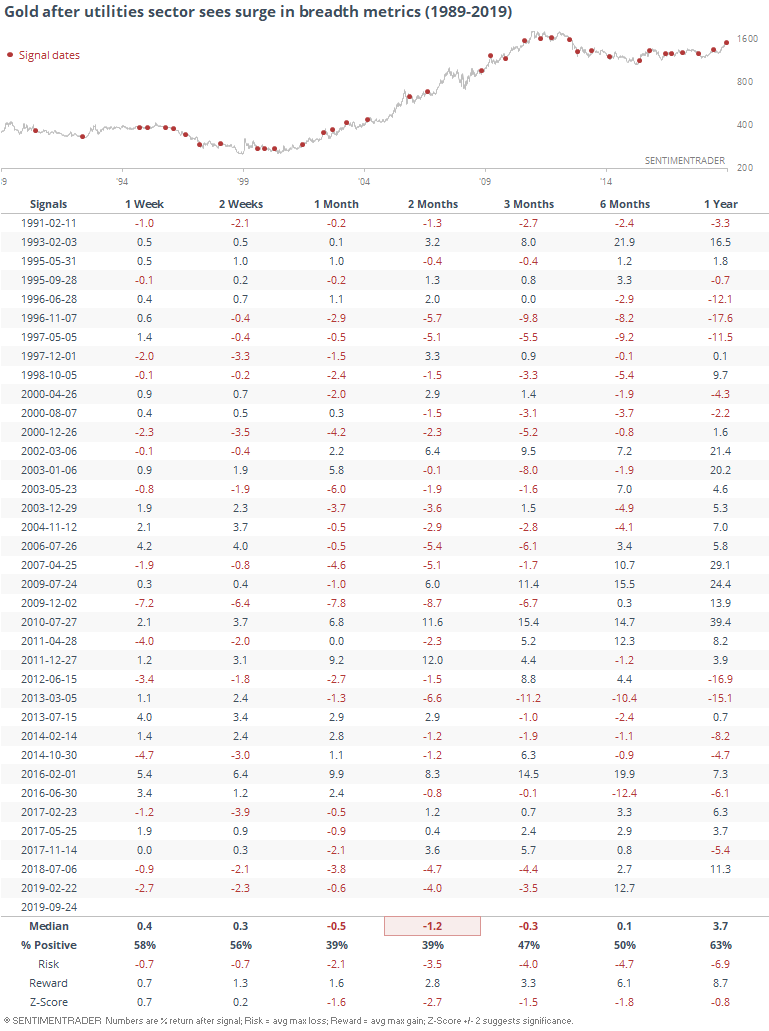
Because these moves in utilities typically had something to do with interest rates, gold also tended to be impacted. Going forward, it showed weak results over the next 1-3 months.
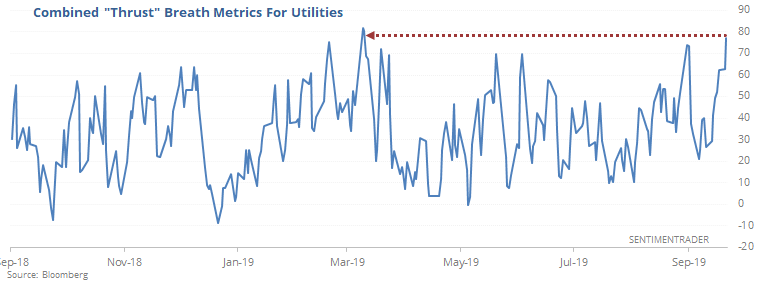
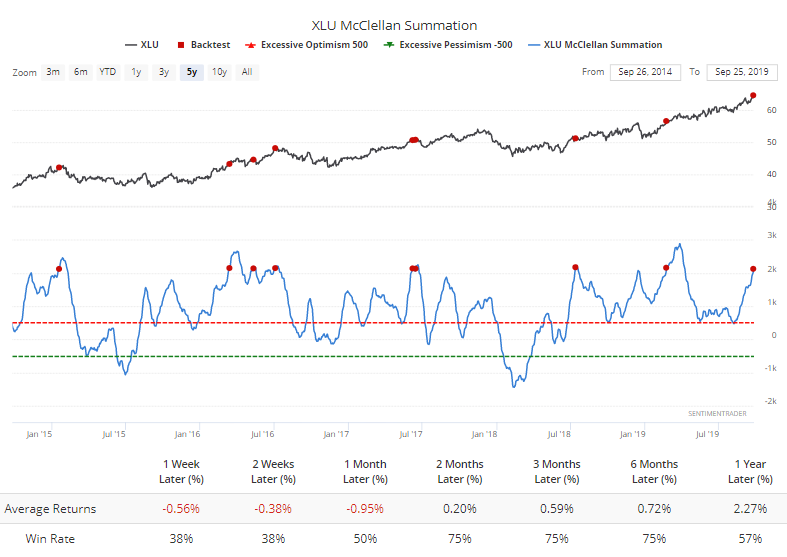
The underlying breadth momentum in utilities has been so impressive that the McClellan Summation Index for the sector is nearing one of its highest-ever levels.
Even during the sector's impressive run over the past 5 years, this has most often led to at least a breather.
Rolling Over
On the S&P 500, the Summation Index is curling down from a very high level.
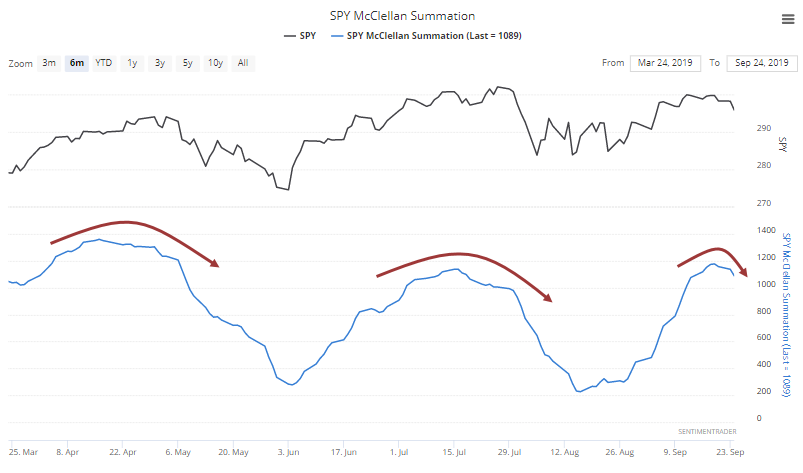
This often worries investors because momentum is starting to wane. But strong momentum doesn't usually give up easily.
From the Backtest Engine, we can see that when the S&P's Summation Index curls over and crosses below 1100, it typically led to gains, not losses.
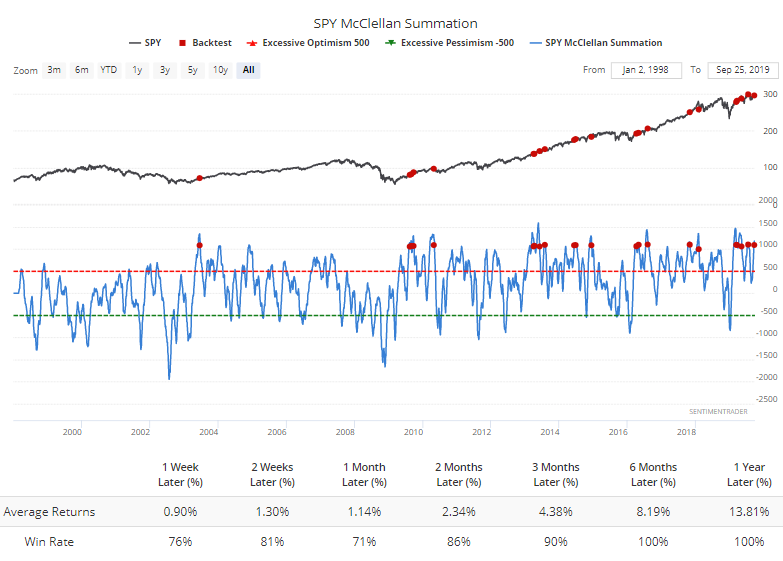
The last two led to modest losses over the next couple of weeks, but obviously the index rebounded quickly and made up those losses.
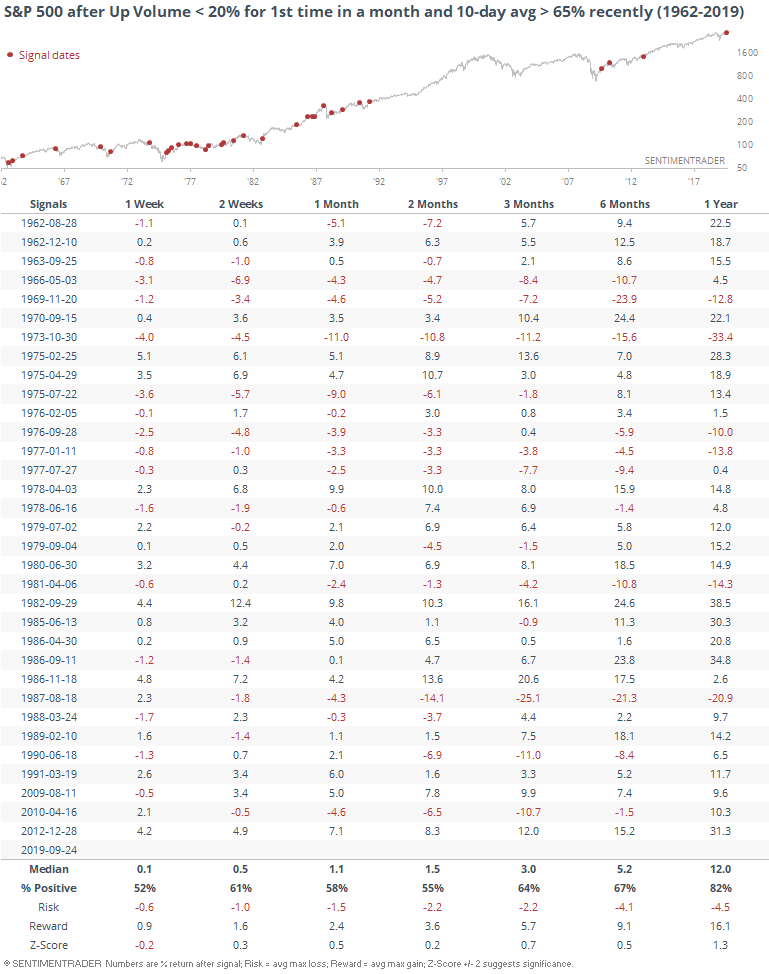
The selling pressure on Tuesday was enough to push the Up Volume Ratio to 20% or below for the first time in a month.
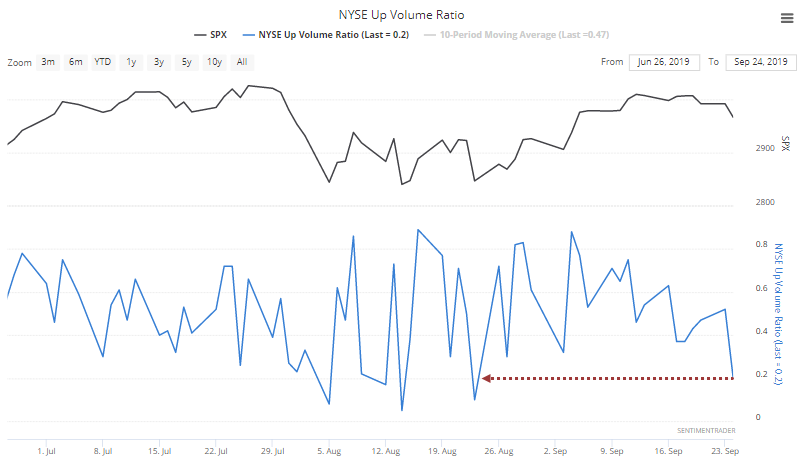
This is coming on the heels of what had been one of the biggest thrusts in breadth since the financial crisis, with the 10-day average of the ratio nearing 70%.
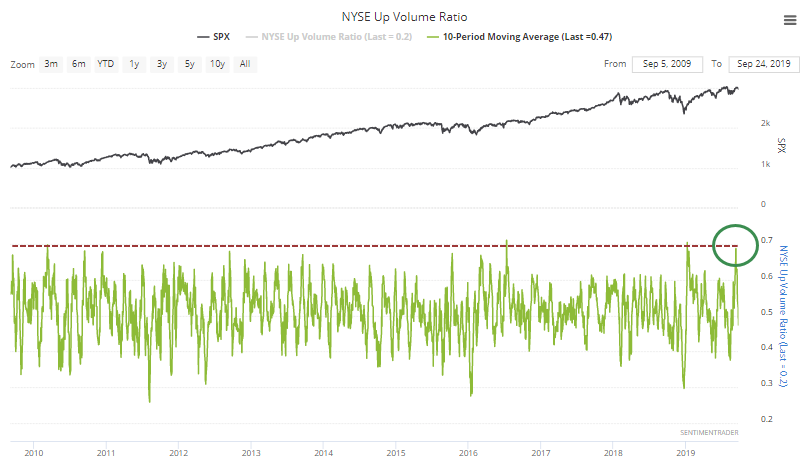
Other times it looked like this was rolling over after a burst of momentum, it didn't really pan out. Future returns for the S&P 500 were fine - not great, but also not poor. There were a few large losses, but also large gains.
Skittish
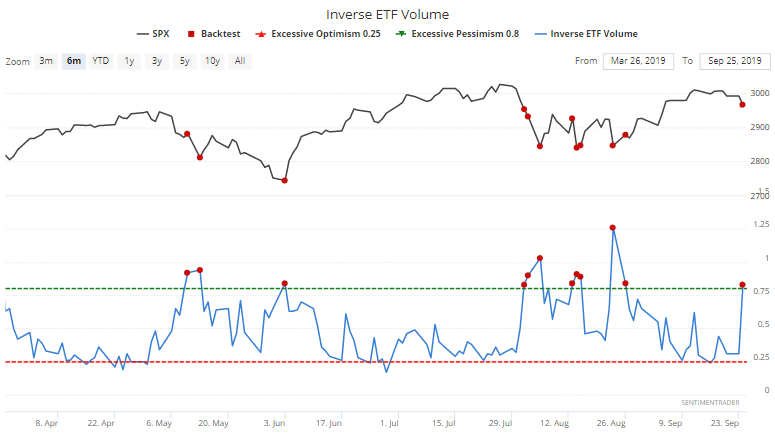
Despite what has been very modest losses, there are some signs of skittishness among traders already. Volume in inverse ETFs jumped to 0.8% of total volume, which is well below other extremes, but still high.
Rydex mutual fund timers have rushed to the safer funds that Rydex offers, abandoning the riskier high-beta ones.
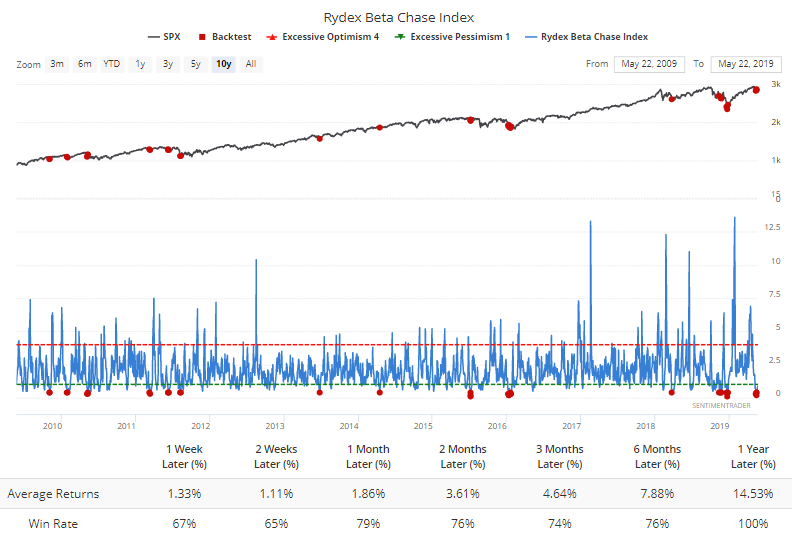
Returns were good, but of course the last 10 years have been a bull market. Still, they were much better than after times when Rydex traders were optimistic, with 5 times more focus on high-beta funds than low-beta ones.
Traders in S&P 100 options also seem to be betting on a decline, continuing their recent activity. The 50-day average of the OEX Put/Call Ratio is now the highest in history.
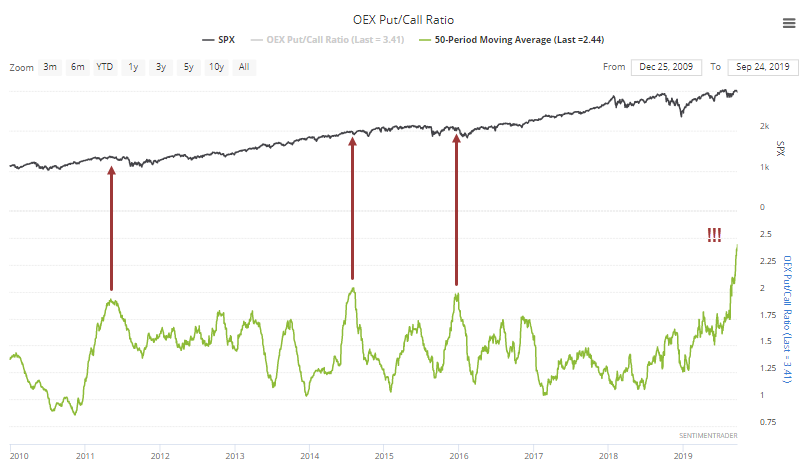
Up until about 20 years ago, the OEX used to be "the" options contract, the one with the most volume and tightest spreads due to massive volume. That has drastically changed in recent years, and now the contract is lucky to average more than a couple thousand contracts changing hands each day.
It was generally considered a "smart money" indicator, with a high put/call ratio being negative for stocks. That has become less reliable over the years, and combined with the exceptionally low volume, I'm not reading much into it.
Flow
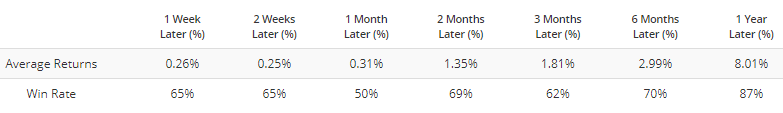
While those indicators are showing some skittishness, especially over the past couple of sessions, Lipper reports that over the past two weeks, ETF traders poured more than $33 billion into domestic funds. That's on par with the largest inflows on record.
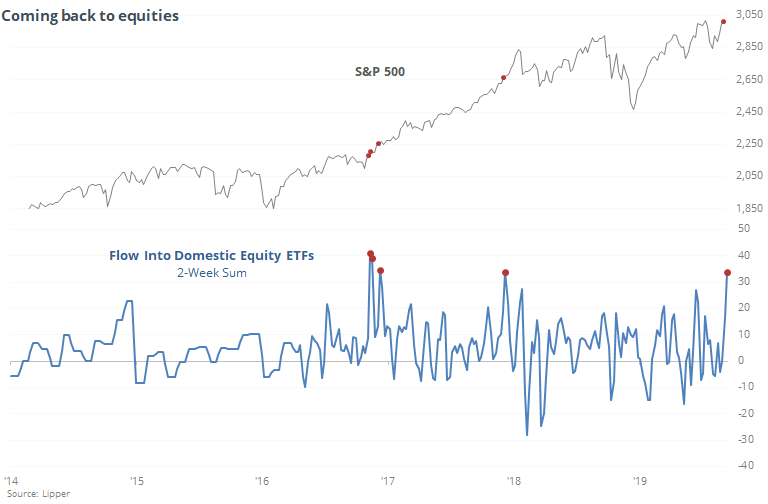
Like we've seen in other studies, though, this is not necessarily a contrary indicator. The only other weeks with more than $30 billion in inflows both led to strong gains in the weeks ahead.
Egypt
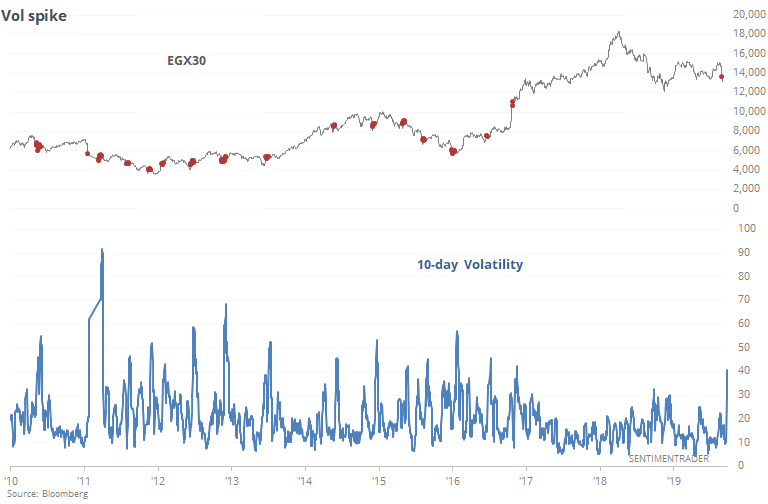
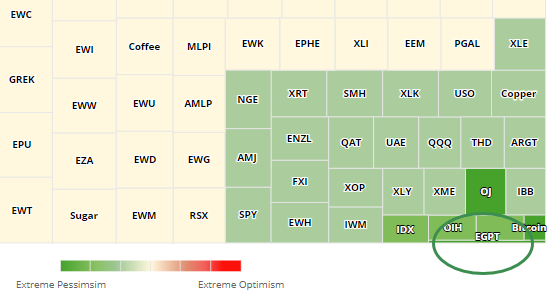
Bloomberg notes that protests in Egypt have hammered that market, and it's now one of the markets showing the least optimism according to the Heatmap.
The Optimism Index for EGPT fell below 5, one of the lowest in the past couple of years.
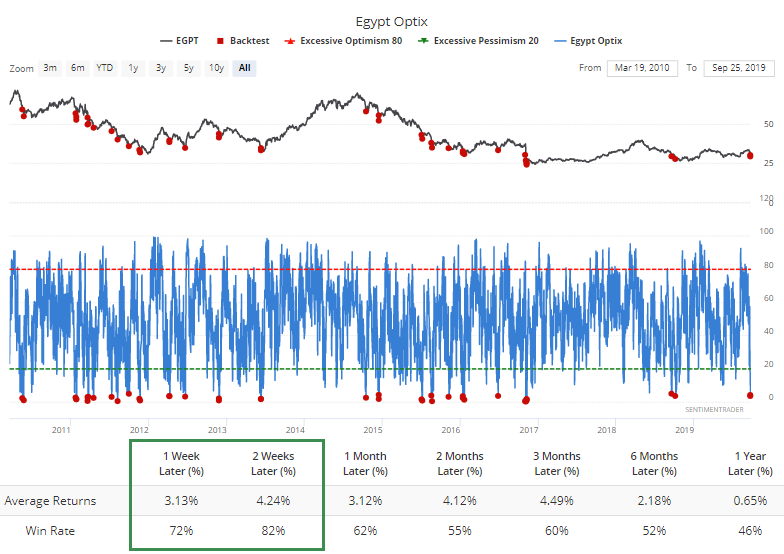
As noted by Bloomberg, the volatility in those shares has pushed 10-day volatility to the highest in two years.