
Market overview: lots of chop, no clear direction
The stock market continues to swing wildly each day on trade-related news. Here's my market outlook:
- Long term risk:reward doesn’t favor bulls. Valuations are high, but valuations can remain high for years before stocks crash.
- Fundamentals (6-12 months): still bullish because there is no significant U.S. macro deterioration, but this could change IF macro data deteriorates significantly over the next few months
- Technicals (3-6 months): neutral/bullish
- Technicals (1-2 months): no clear edge in either direction.
Fundamentals (6-12 months)
The economy and the stock market move in the same direction in the long term. Hence, leading economic indicators are also long term leading indicators for the stock market.
Overall, there is no significant U.S. economic deterioration right now. This is bullish for the stock market on a 6-12 month time frame. The main weak points in U.S. macro revolve around trade, manufacturing, and the yield curve. Moreover, soft data is worse than hard data. For more details and charts, please see my weekly fundamentals post.
What will happen to macro in the future? I don't know. Instead of trying to guess the future, the constant stream of macro data tells us how to react and allocate capital day-by-day depending on what's happening right now.
Here are some other long term and fundamental indicators we looked at this week:
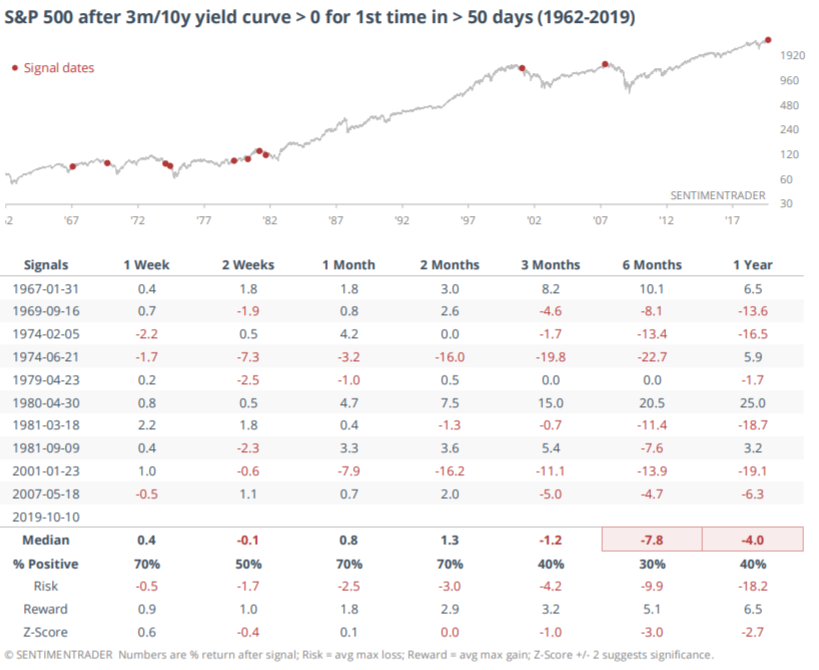
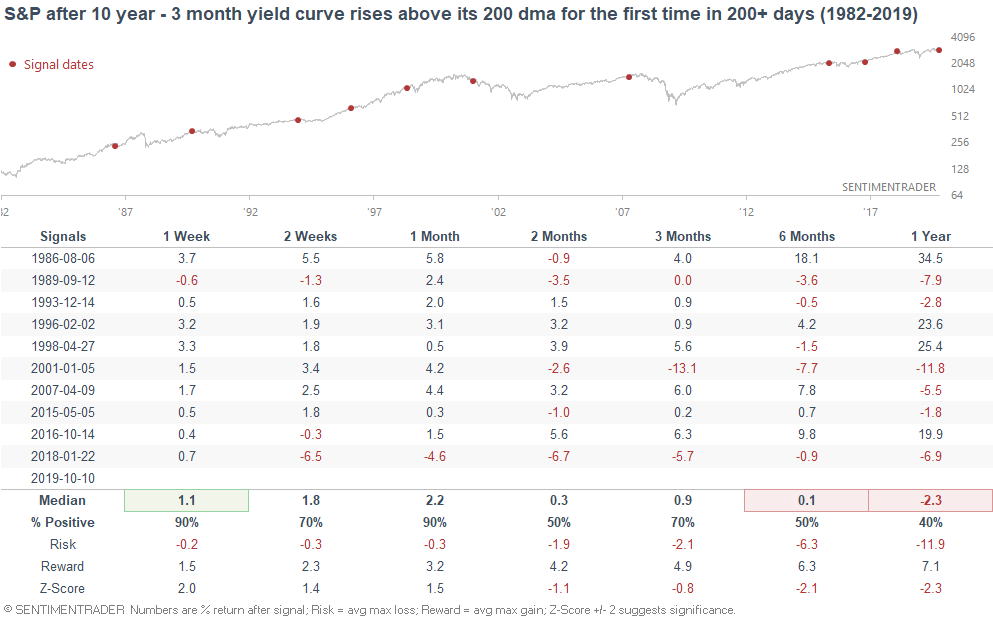
Yield curve
Jason and I noted in different ways that the previously inverted yield curve is starting to steepen and un-invert. Regardless of how you look at it, this isn't a terrific sign for stocks over the next 6-12 months. The yield curve remains a bearish factor for stocks.
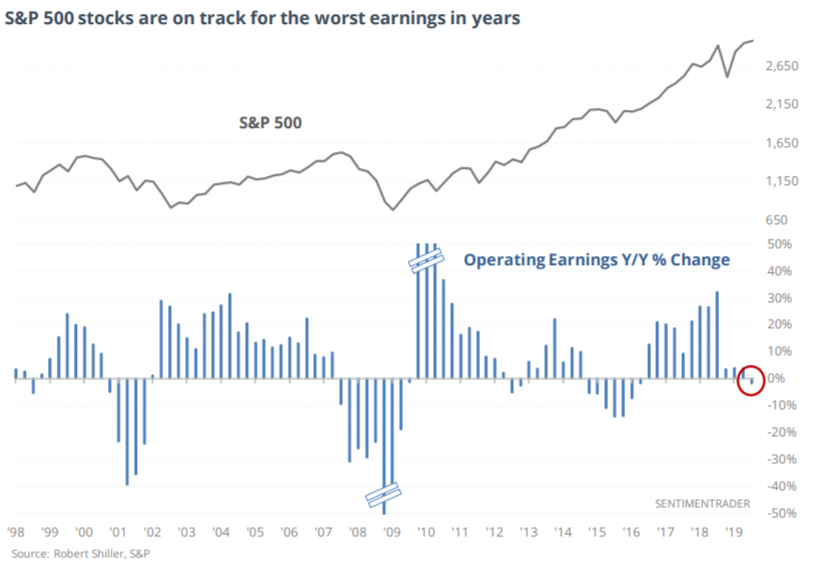
Earnings
Earnings growth is a neutral/bearish factor for stocks right now. As Jason demonstrated on Tuesday, the S&P's year-over-year change for operating earnings is expected to be negative, which is the worst in 3 years.
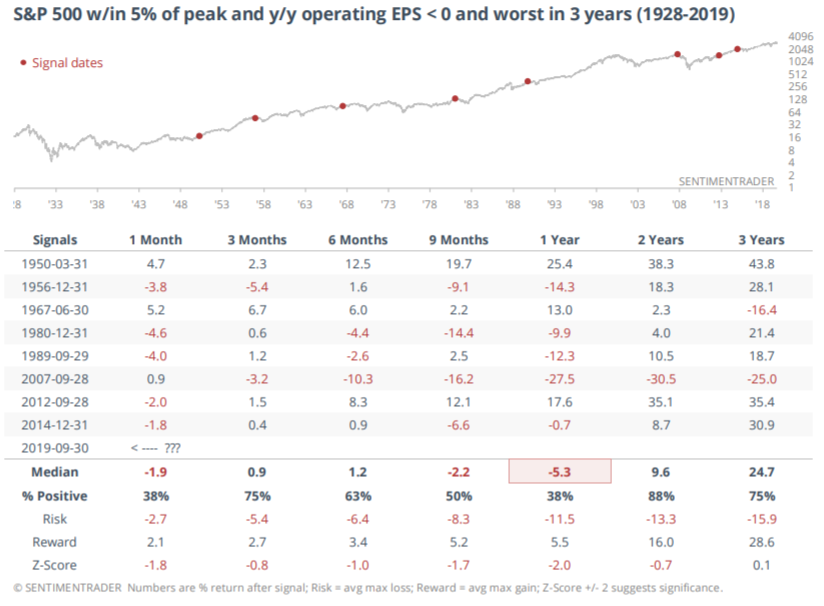
When earnings were this bad while the S&P was close to a high, the S&P's forward returns over the next year were worse than random. Sometimes this was followed by a massive crash (e.g. 2007), and sometimes this was a false alarm.
Unloading inventory
As Jason mentioned in an excellent piece on Monday, VC and PE funds are unloading quite a bit of their inventory (particularly the money-losing ones). And who could blame them? If I were in their shoes, I would do exactly the same. A 10 year bull market + potential risks on the horizon + high valuations for businesses that don't make money. Get out while the going is good.
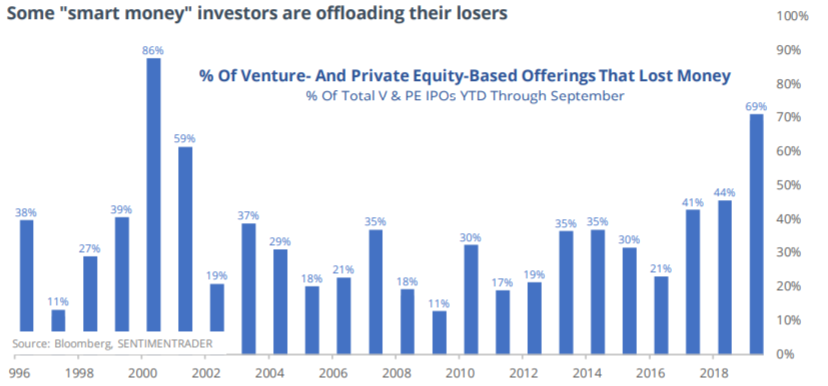
While today is not "just like 2000", this does represent the late-cycle nature of this bull market.
Technicals (3-6 months)
The majority of our stats suggest that the stock market's 3-6 month outlook is bullish, although there are some bearish stats as well. Let's start with the bullish stats, and then we'll look at the bearish ones.
Bullish:
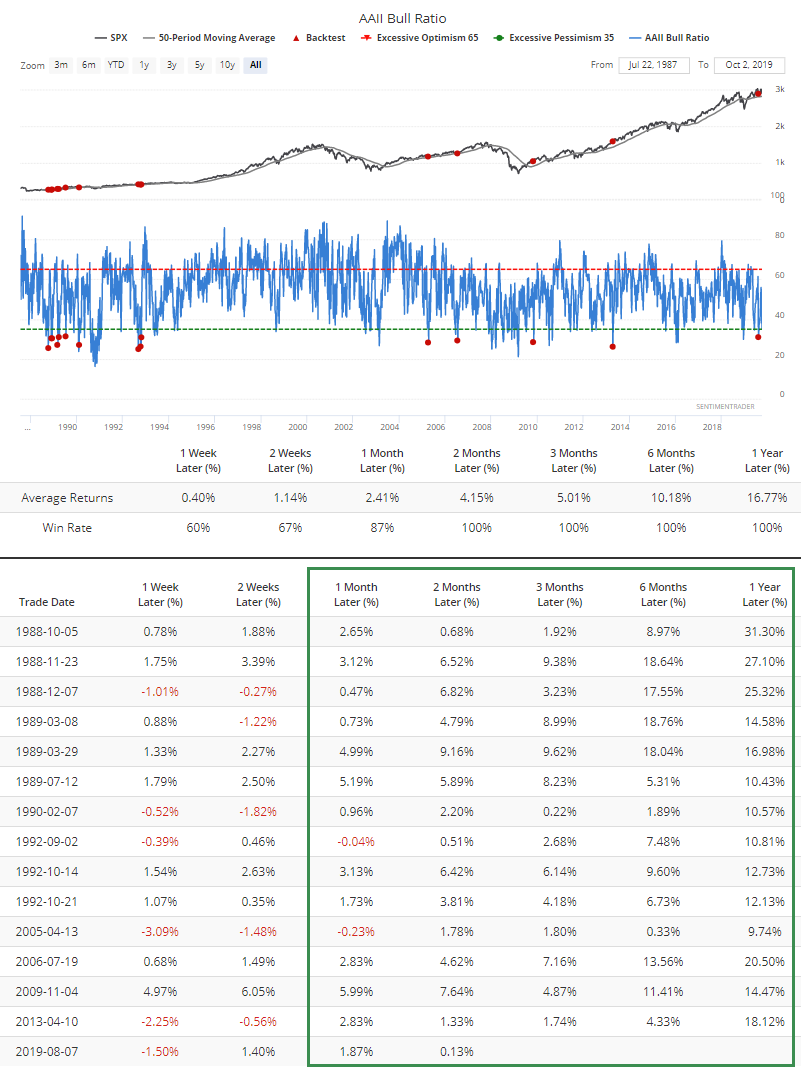
Sentiment
As Jason noted on Thursday, the AAII Bull ratio remains extremely low. Such low readings are typically bullish for stocks. With that being said, AAII is showing more pessimism than many other sentiment indicators. Perhaps this is due to data's source, as Jason said on Friday ("crabby old people").
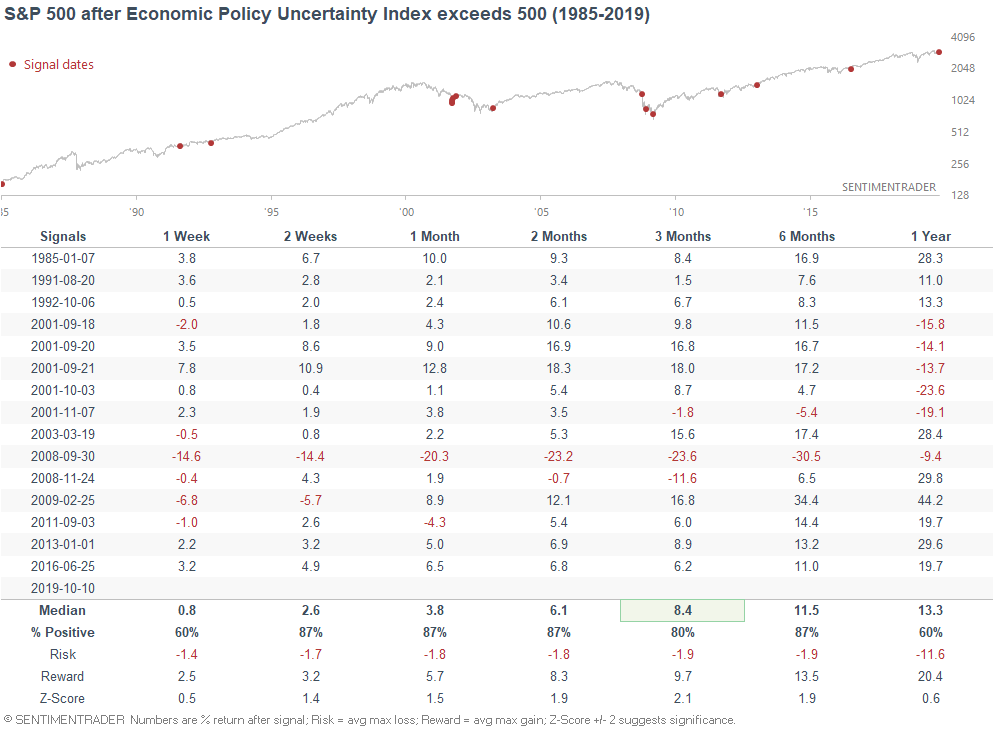
Meanwhile, U.S. economic policy uncertainty remains quite high, as I mentioned on Thursday:
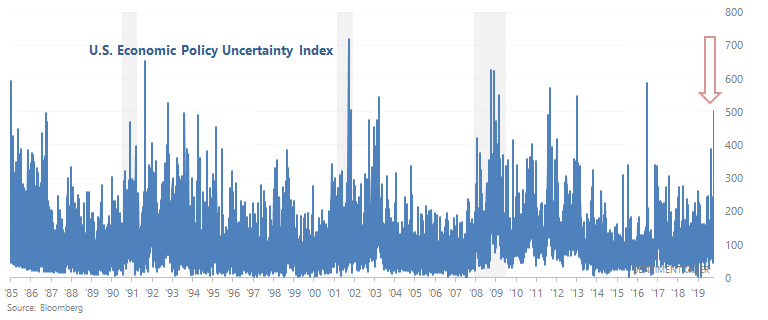
When the Economic Policy Uncertainty Index exceeded 500 in the past, the S&P's returns over the next 3-6 months were mostly bullish:
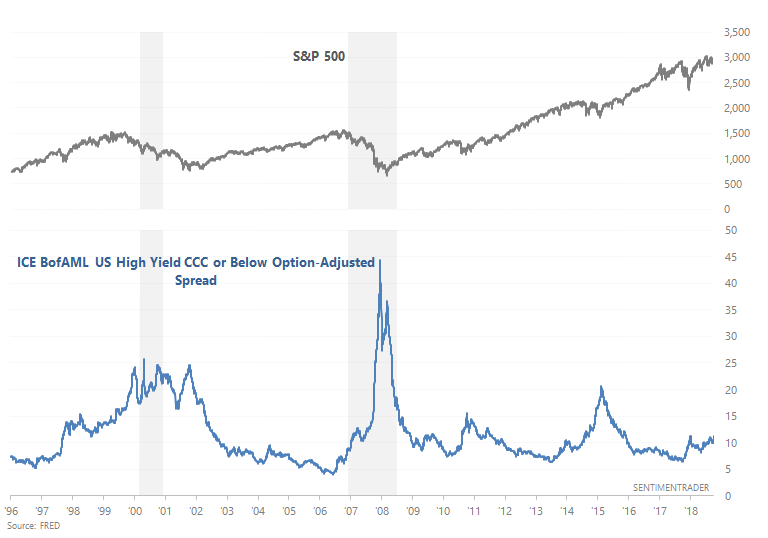
High yield spreads
As I mentioned on Tuesday, High yield spreads have been rising recently, making a new high relative to its high in December 2018 - January 2019:
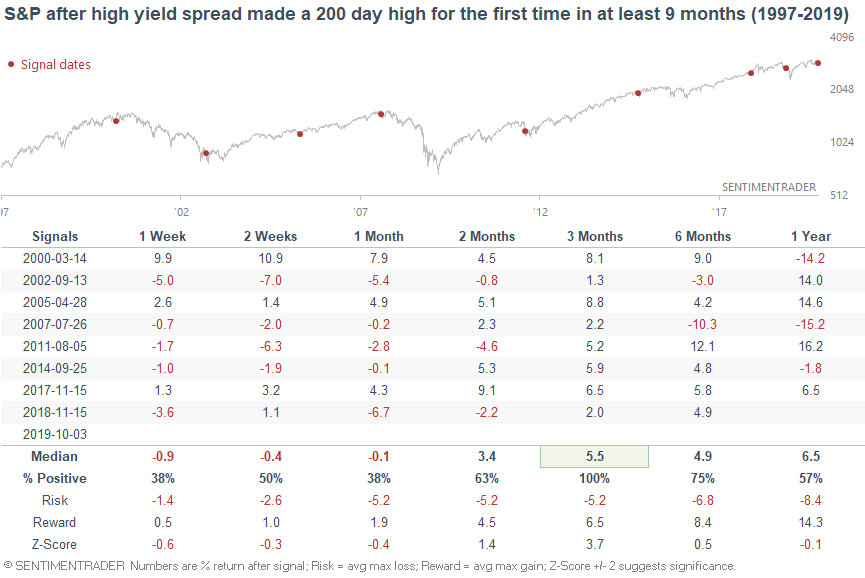
When the high yield spread broke out to a 200 day high in the past, the S&P's returns over the next 3 months were mostly bullish:
Neutral:
Breadth
There is a fairly sizable group of investors and traders who think that after a 1.5+ year consolidation, the stock market will surge (breakout). The main issue weighing down sentiment (directly or indirectly) is the trade war. With that being said, bullish traders keep trying to grasp onto something to reaffirm their case. So when positive trade-related news comes out, every issue is bought.
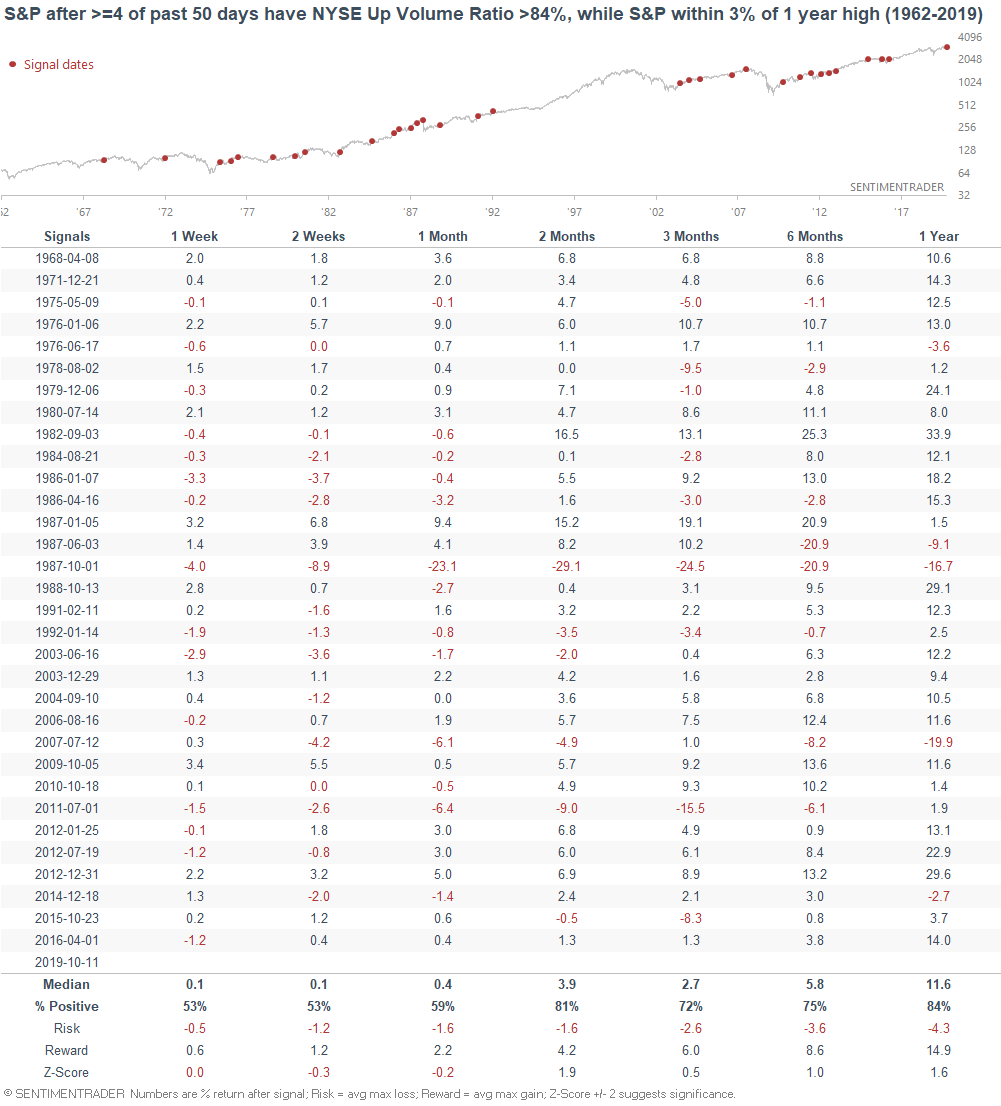
Friday saw 84% of volume flow into issues that went up. This isn't the first strong daily breadth reading. There were 3 other similar readings in August:
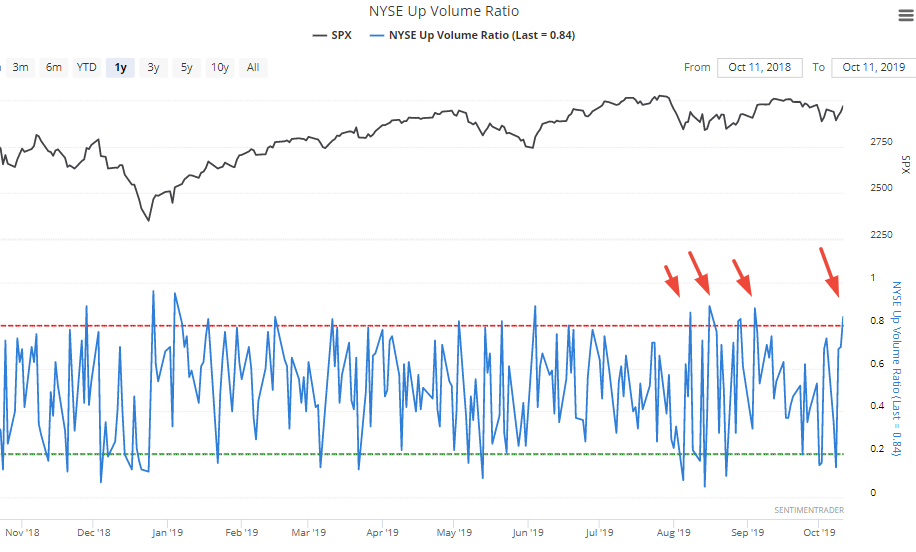
Over a span of less than 50 days, this is quite a few days with strong buying.
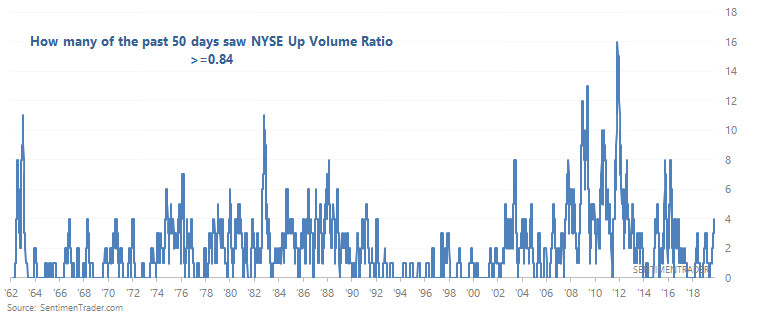
What's even more surprising is that this is occurring while the stock market is close to an all-time high. Many days with high Up Volume occur during bear markets, which are extremely volatile. When the stock market crashes -5% in one day, then rises +4% the next, then crashes -4%, then rises +3%, it's easy to get a lot of days with a high Up Volume ratio.
So when there were at least 4 days with the Up Volume Ratio >84% while the S&P is within 3% of a 1 year high, the S&P's returns over the next 2 months were mostly bullish:
We can look at breadth from another less-bullish perspective.
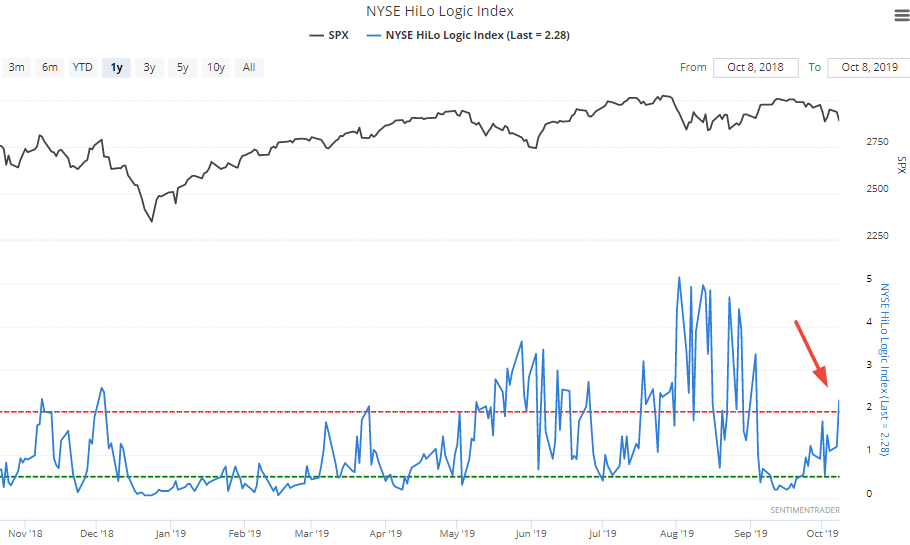
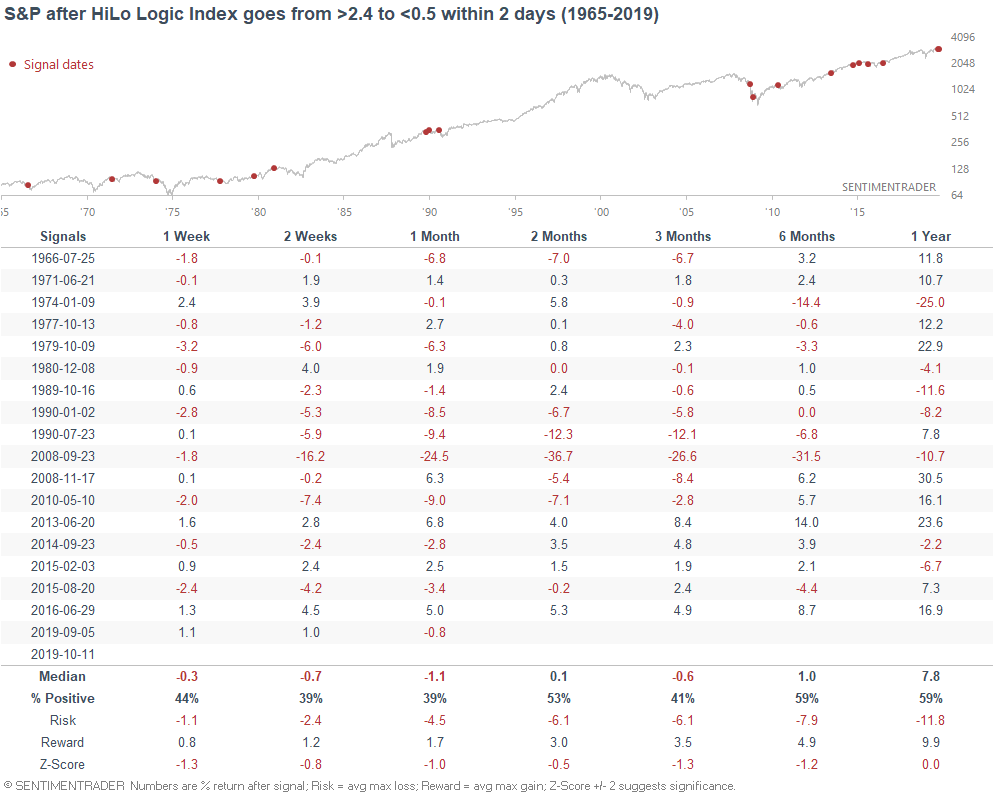
As I highlighted on Tuesday, our HiLo Logic Index was rapidly rising, which isn't the best for stocks over the next 6 months:
*A high HiLo Logic Index represents a split market, whereas a low HiLo Logic Index represents a one-sided market.
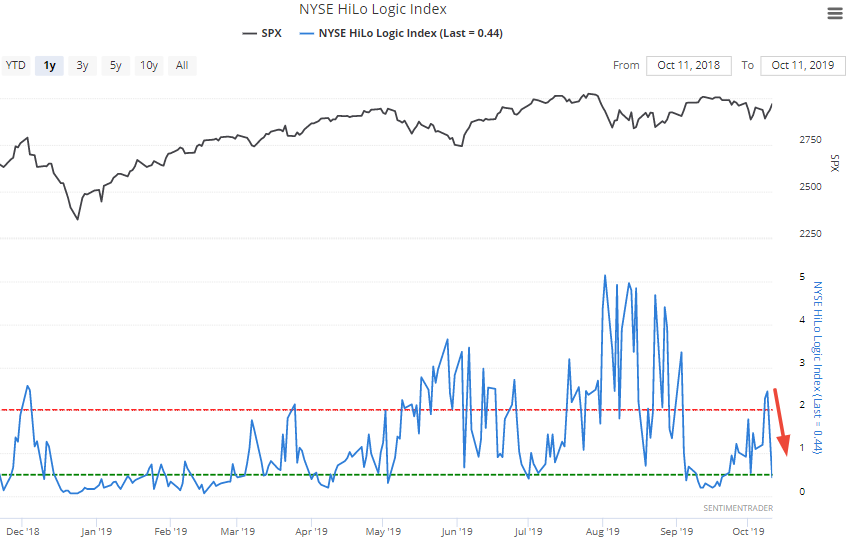
With stocks surging on Thursday and Friday, the HiLo Logic Index tanked:
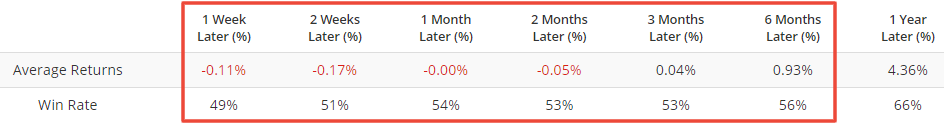
One would think that such a rapid drop in the HiLo Logic Index (immediately going from a split market to a one-sided market) was a positive for stocks, but that hasn't always been the case for stocks over the next month:
Overall, breadth is a neutral factor for stocks now.
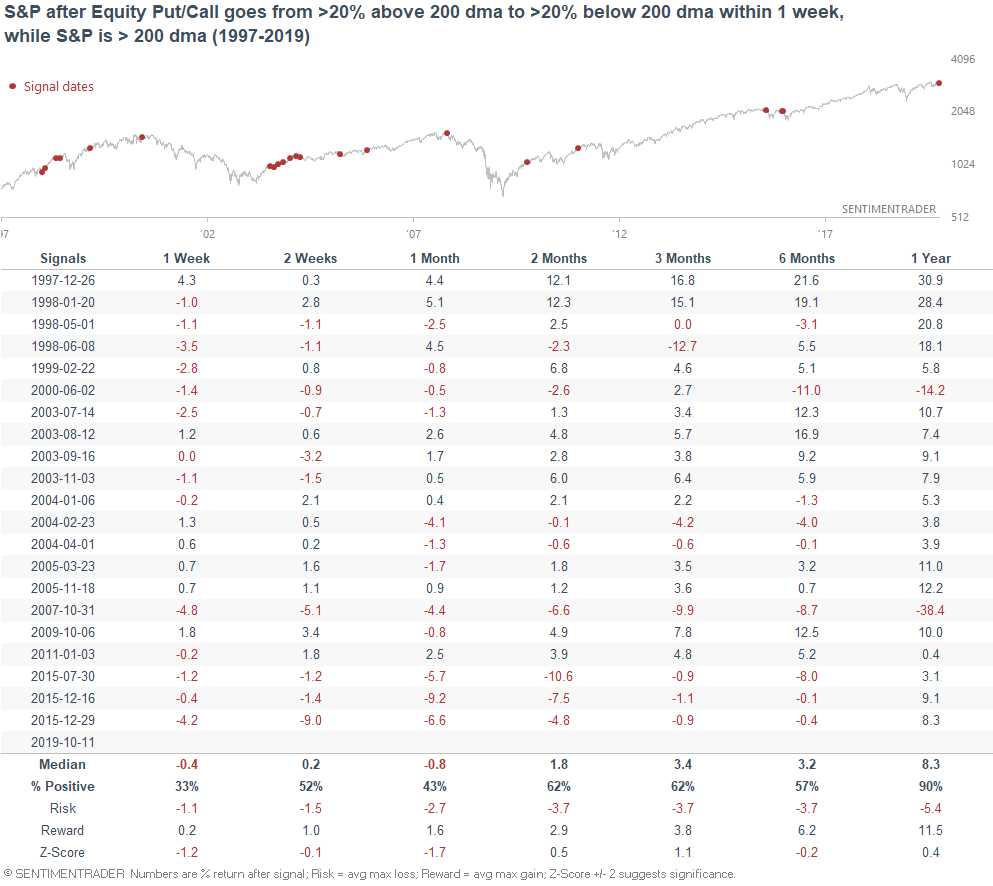
Equity Put/Call
With stocks swinging wildly this week (but going up towards the end of the week), the Equity Put/Call ratio went from one of the highest readings this year to one of the lowest, all in just one week:
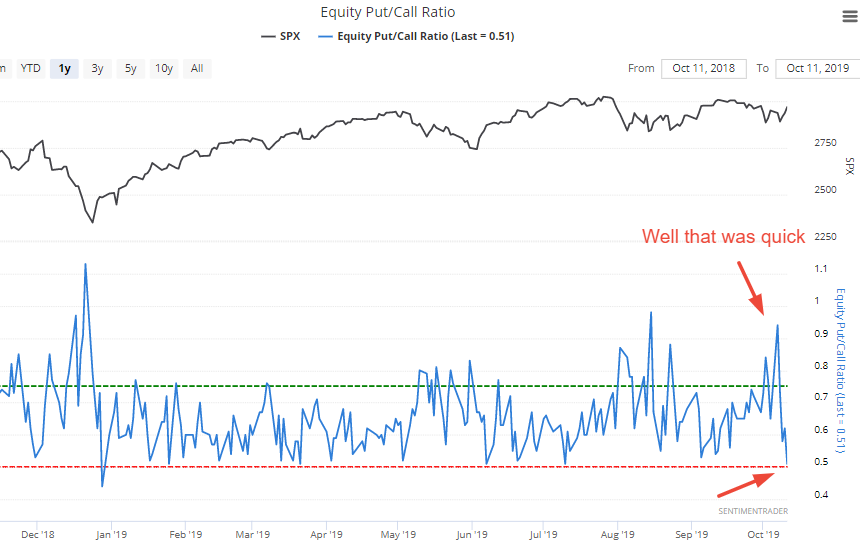
When this happened while the S&P was in an uptrend, the S&P's returns over the next month were worse than random:
Basic trends
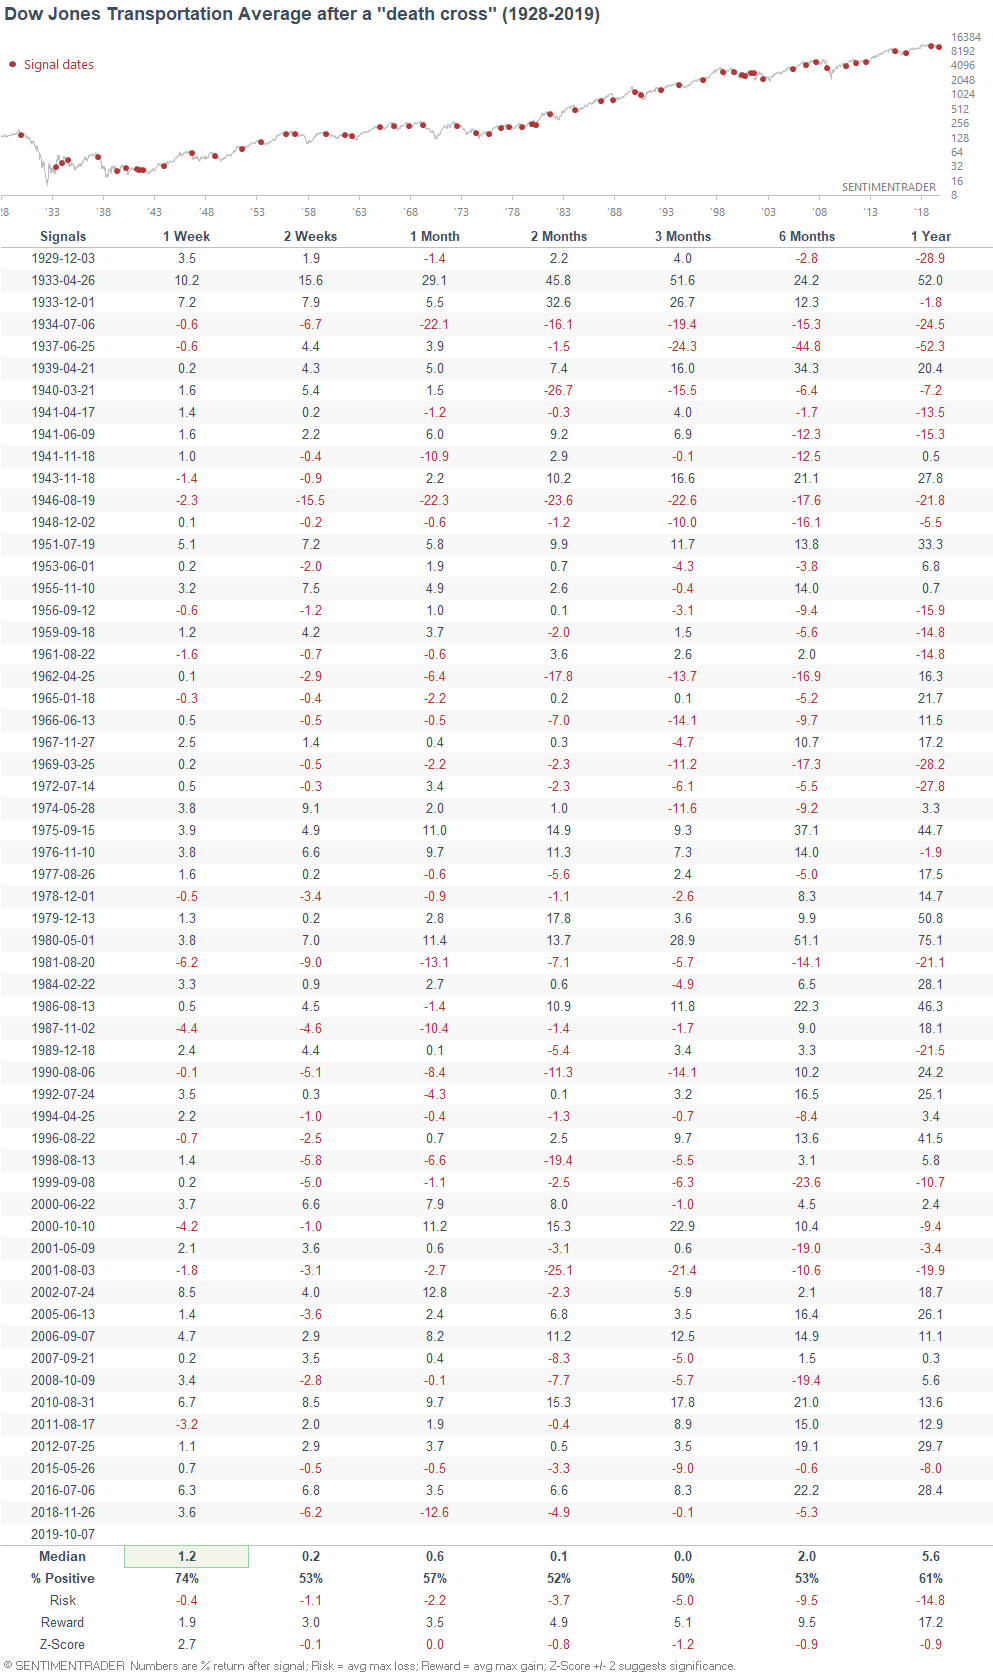
From a basic trend following point of view, the Dow Jones Transportation Average's 50 dma fell below its 200 dma on Monday:
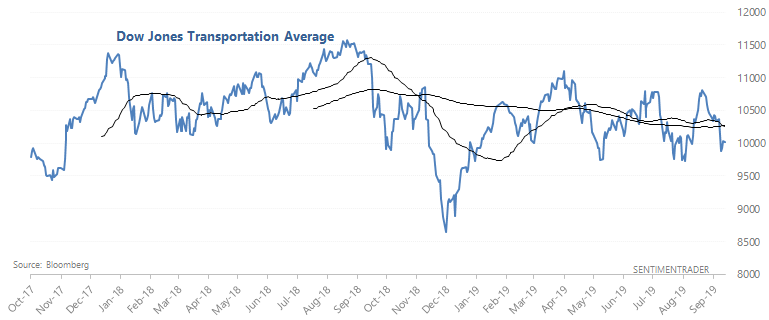
When this happened in the past, the Dow Jones Transportation Average's forward returns weren't necessarily bearish, but were worse than random. This is standard for traditional price-only trend following strategies: they don't significantly beat buy and hold in the long run, but they do help traders avoid the worst bear markets.
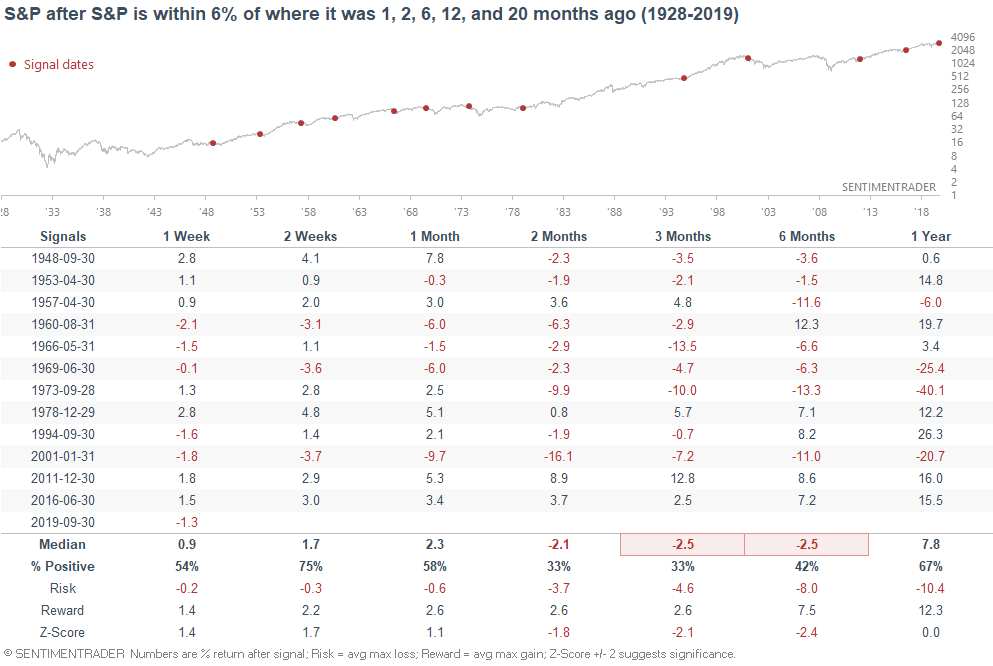
Meanwhile, the S&P 500 has essentially gone nowhere over the past 1, 2, 6, 12, and 20 months:
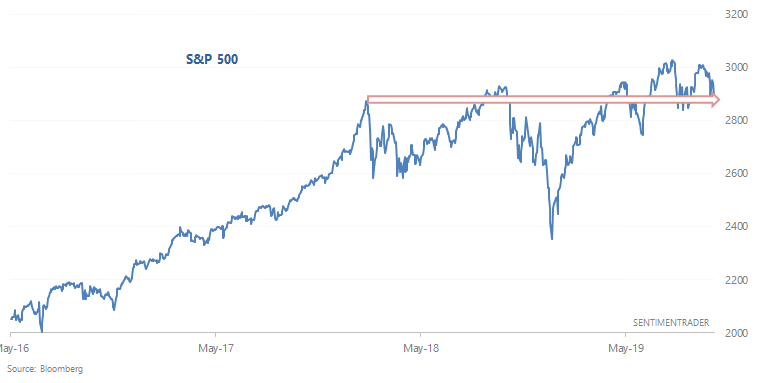
As I said on Wednesday, this was bearish for stocks over the next 3-6 months:
To recap
- Long term risk:reward doesn’t favor bulls.
- Fundamentals (6-12 months): still bullish because there is no significant U.S. macro deterioration.
- Technicals (3-6 months): neutral/bullish
Got any questions/comments? Feel free to email me at [email protected]