
What I'm looking at - economic policy, NAAIM vs AAII, yield curve
With the stock market still gyrating on trade news, here's what I'm looking at:
Trade policy
If there's one word to describe headlines and the stock market's intraday swings over the past few days, it's "wild". As in nobody has an idea what's going on (myself included) on the trade front. From Bloomberg:
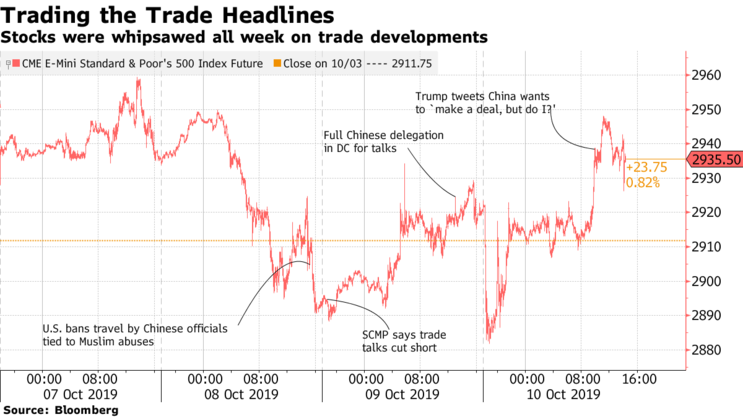
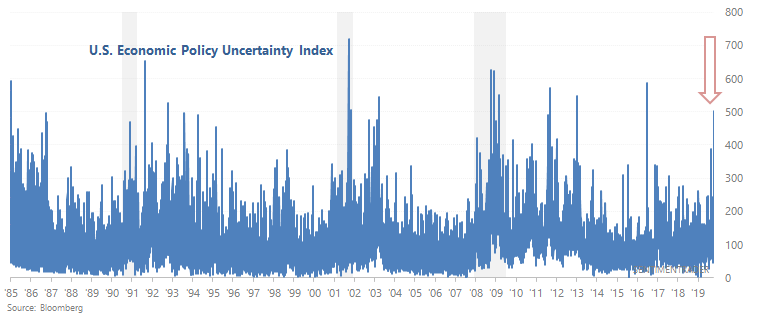
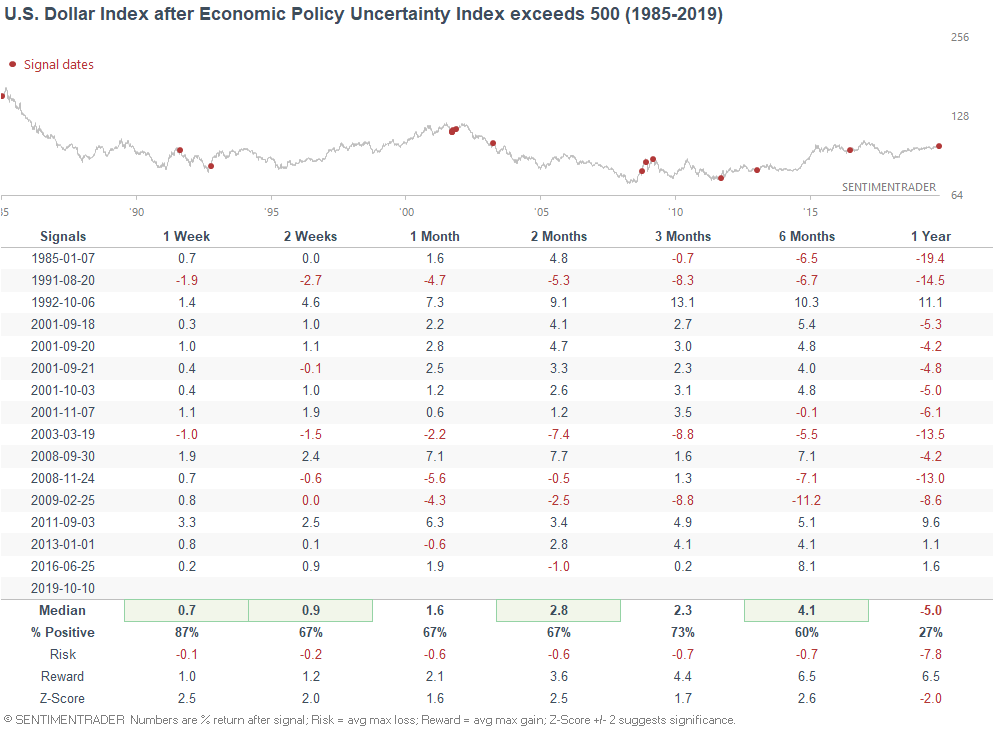
In my opinion, trading the news in this environment is suicide. (As a rule of thumb, trading the news is not a good idea. It's hard enough to predict the news, and even harder to predict the market's reaction to the news). One moment "trade talks are going well", the next moment "trade talks turned sour", then trade talks "turned better again". Perhaps this is why the U.S. Economic Policy Uncertainty Index has spiked to the highest level since Brexit in 2016:
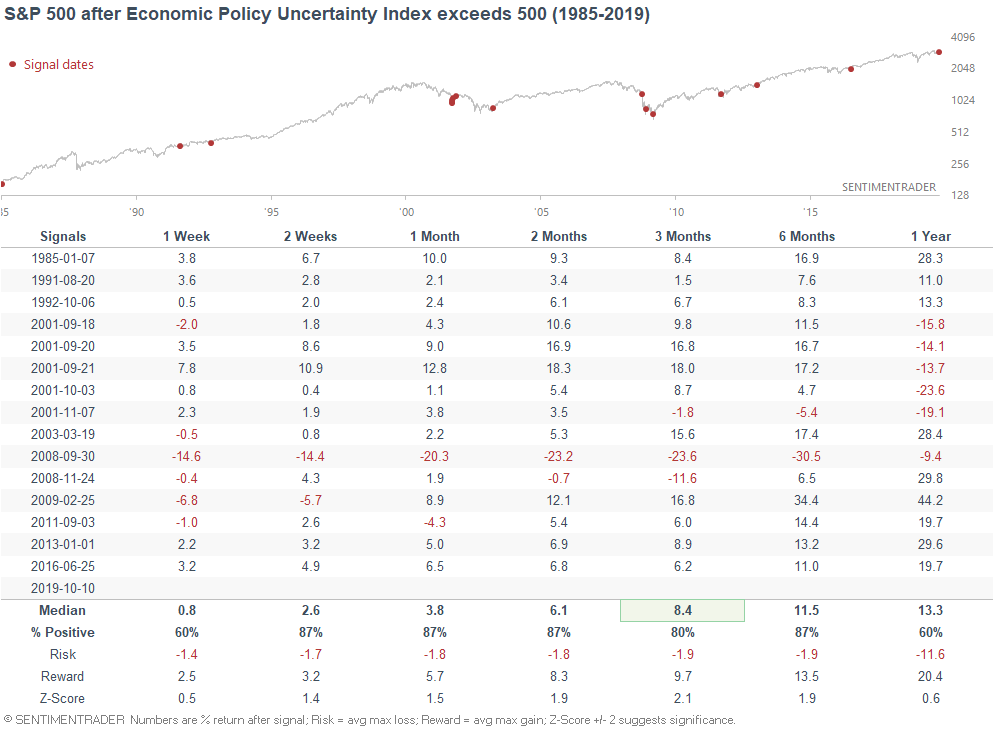
When the Economic Policy Uncertainty Index exceeded 500 in the past, the S&P's returns over the next 3-6 months were mostly bullish. The only big failures occurred 2008, just as the stock market and global economy were about to fall off a cliff.
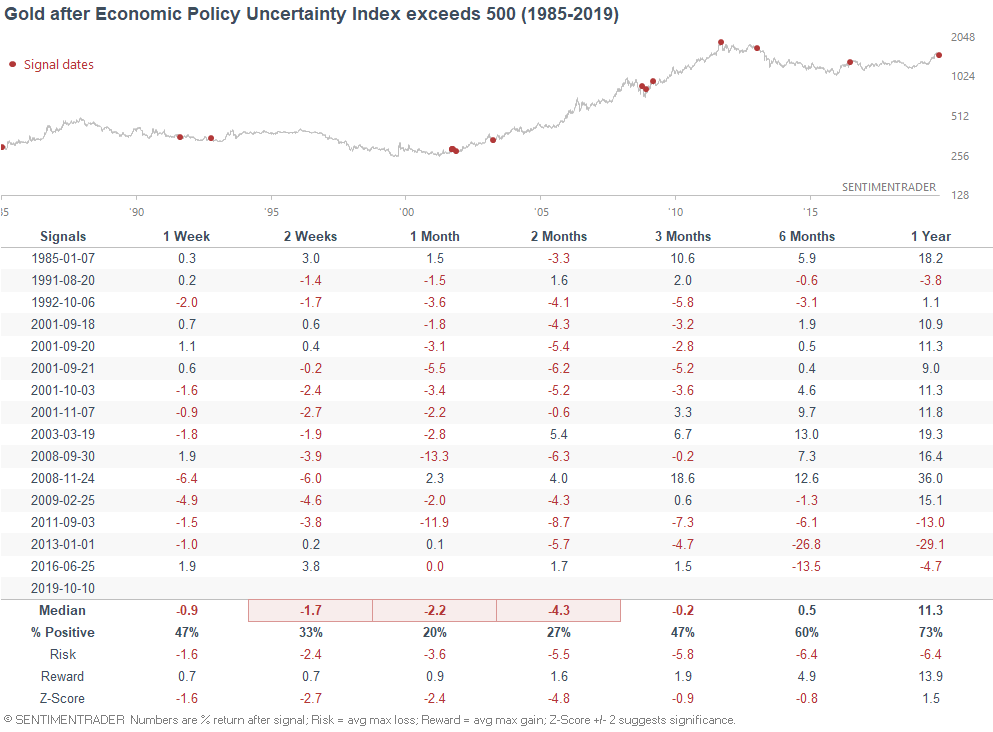
Gold did not do well over the next few weeks and months...
... while the U.S. Dollar Index did well.
NAAIM vs AAII
Jason demonstrated that sentiment according to AAII is very low, which is a bullish sign. But while mom and pop investors are quite pessimistic (at least according to AAII), active managers are more undecided. The NAAIM Exposure Index is somewhat low, but not nearly as low as AAII Bullish %:
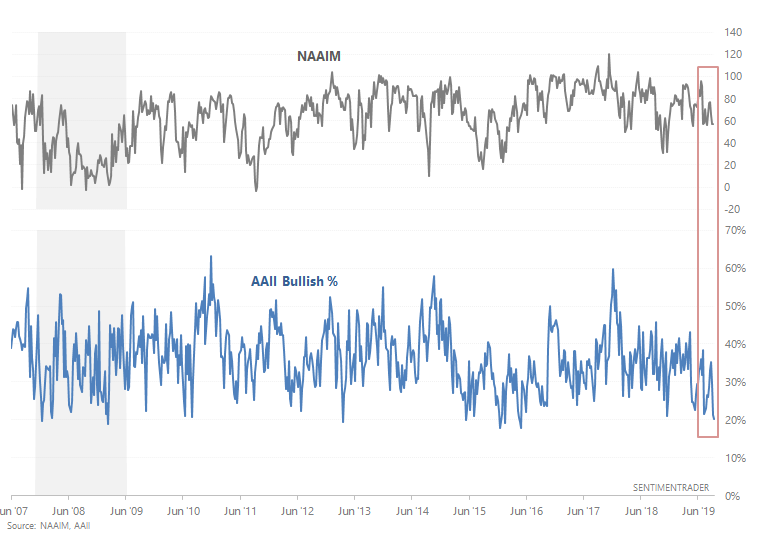
AAII Bullish % is approximately -36% below its 1 year average, while NAAIM is approximately -17% below its 1 year average. When mom and pop diverged from active managers in the past, the S&P's forward returns were mixed/bearish.
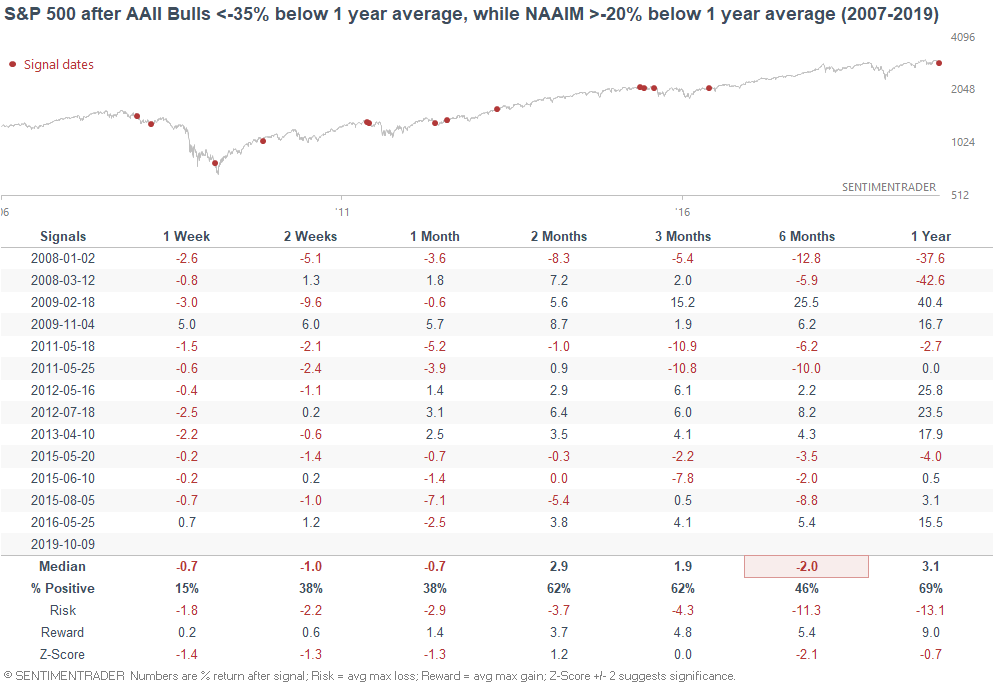
This typically occurred around period of heightened anxiety. Sometimes these fears turned out to be false alarms, and sometimes they turned into something that was very real (e.g. 2007, 2011, 2015).
Overall, sentiment is a mixed bag right now. AAII is very extreme, but it isn't the best sentiment indicator due to its small sample size. With that being said, there's no doubt that the trade war and global economic slowdown are weighing on sentiment. You can see this even in the economic data, in which soft data is much worse than hard data.
Yield curve steepening?
The 10 year - 3 month Treasury yield curve continuously flattened from mid-2018 to September, fueled by a much faster decline in the 10 year yield than the 3 month yield. Now that the 10 year yield is holding steady while the 3 month yield continues to fall, the yield curve is starting to steepen:
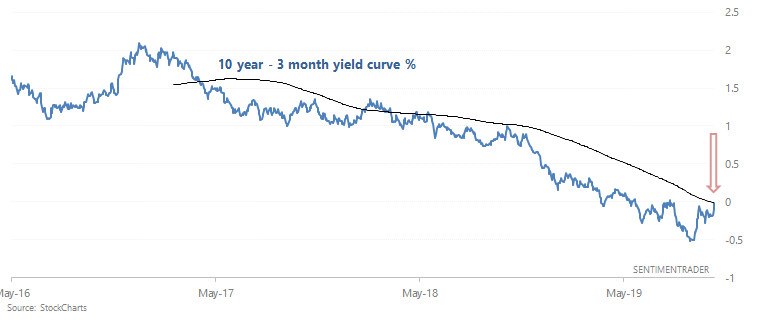
This potentially marks the end to one of the longest yield curve flattening streaks over the past 35+ years.
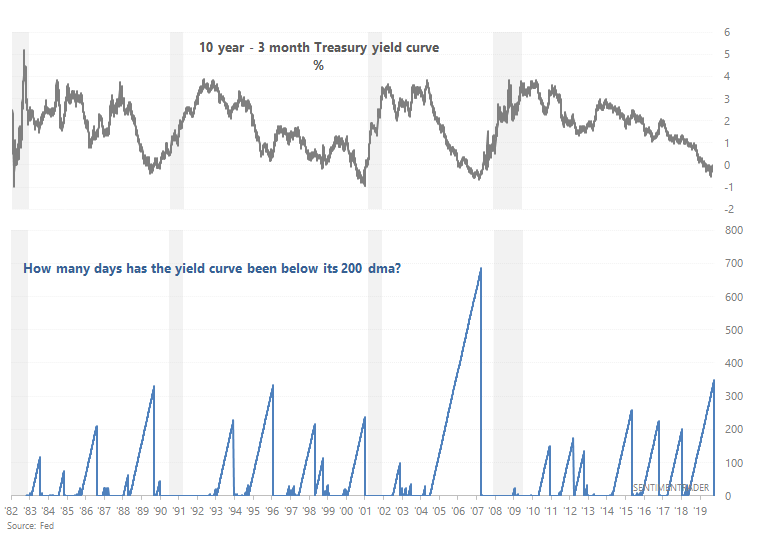
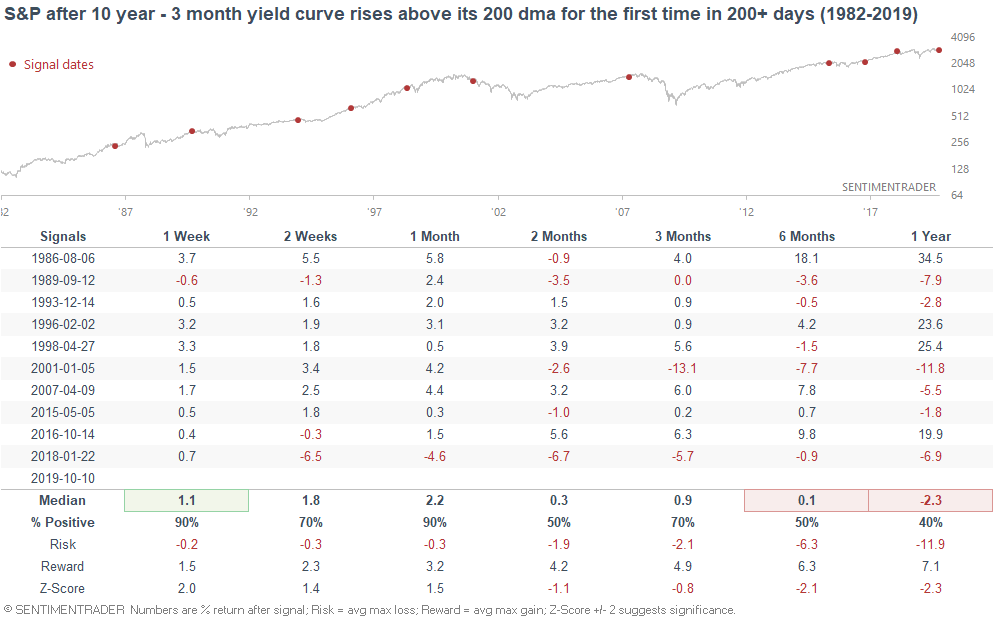
When the yield curve steepened for the first time in 200+ days in the past, the S&P's 6-12 month forward returns were more bearish than random...
And if we isolate for the cases in which the yield curve steepened for the first time in a long time, while it was inverted...
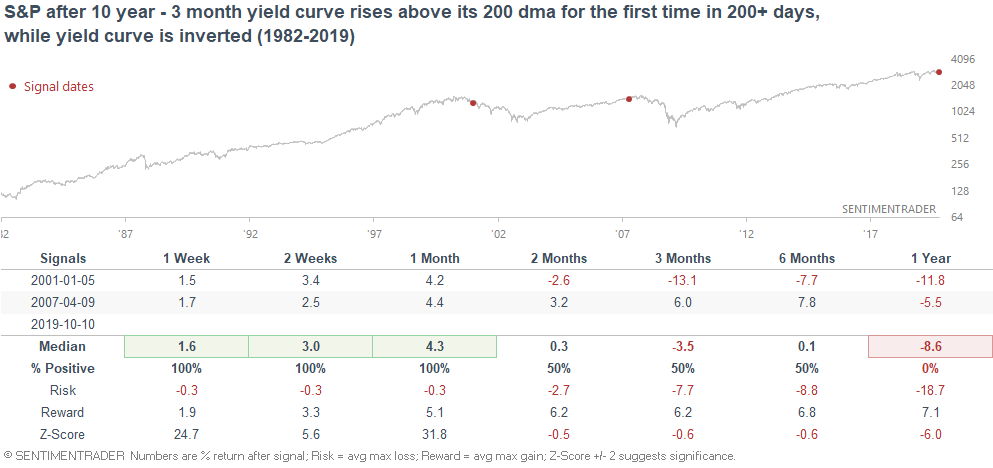
... 2001 and 2007.
Steepening yield curves are generally worse than yield curve inversions. Yield curve inversions tend to happen before bull markets and economic expansions end, whereas steepening yield curves tend to happen during a recession when the Fed consecutively cuts short term rates.
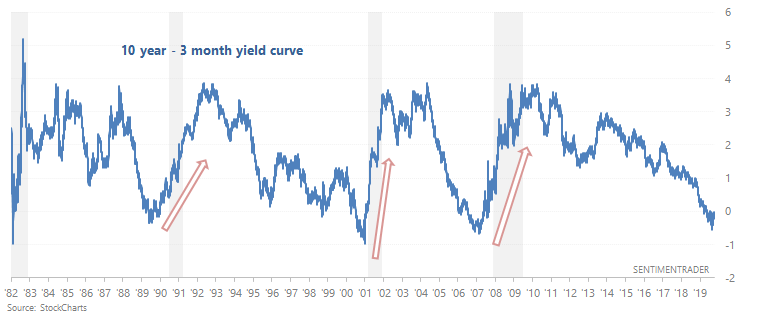
This is just a minor development for now, but watch out IF the yield curve continues to steepen. With that being said, the yield curve is merely one of many macro factors to consider. It isn't an end-all-and-be-all. Even indicators with perfect historical track records can fail for the first time.
If you have questions/comments, please email me at [email protected]