
What I'm looking at - S&P and MSCI trailing earnings, high yield spreads, Sweden PMI, Dow Transports
With Q3 earnings season just around the corner, here's what I'm looking at:
Earnings recession?
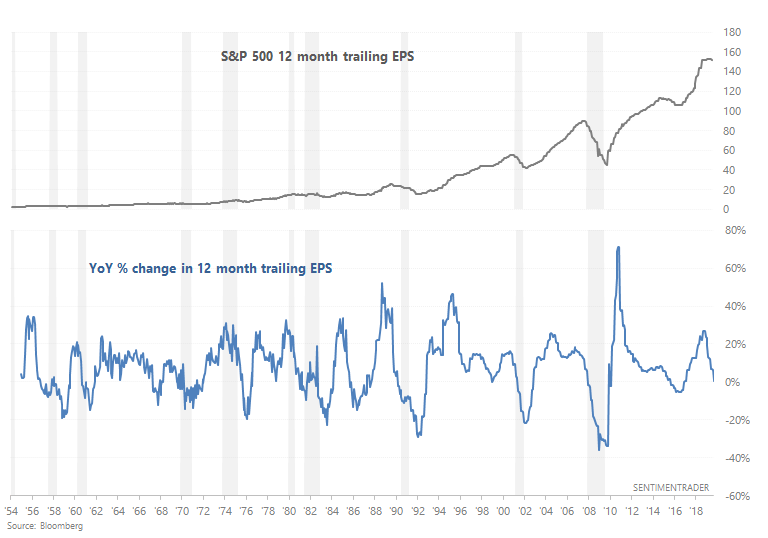
Earnings growth is weak. Factset estimates that the earnings decline for Q3 2019 will be -4.1%, marking this as the 3rd straight quarter of YoY earnings declines since the earnings recession of 2015-2016.
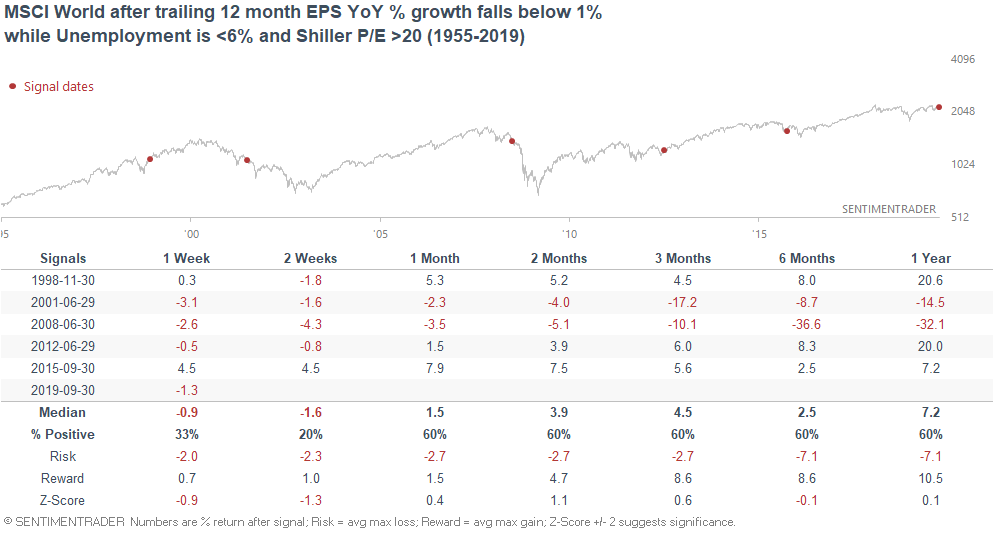
Looking at a longer term chart, we can see that the YoY % change in 12 month trailing EPS has fallen to 0.5%:
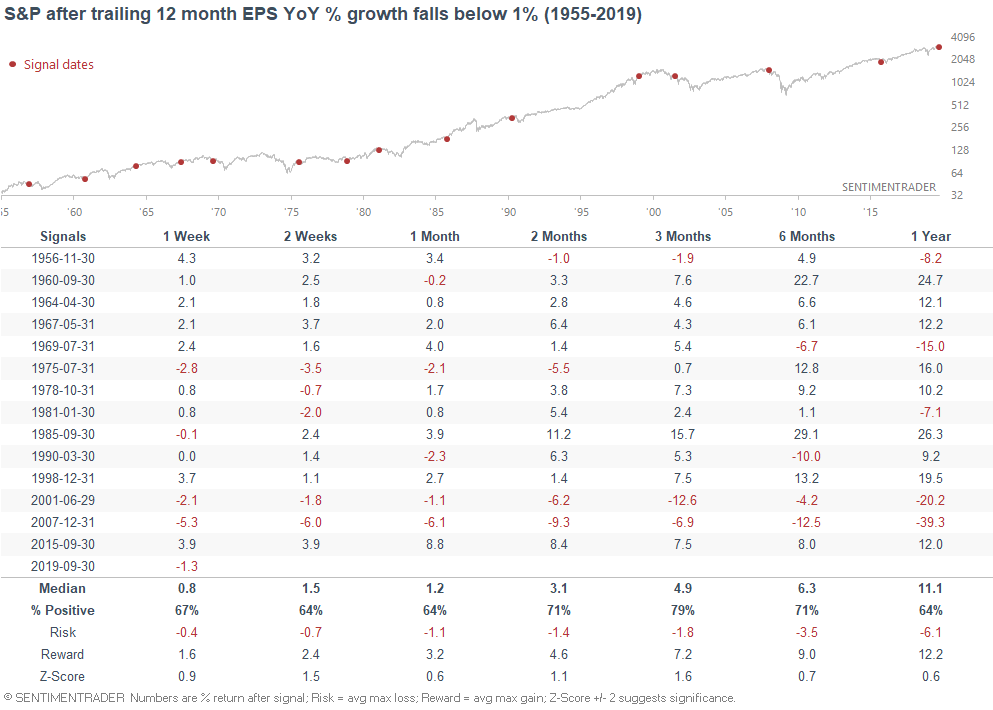
When this happened from 1990-present, there was really only 1 false bearish signal (1998). The other signals (1990, 2001, 2007, 2015) were followed by real economic slowdowns and stock market crashes. But prior to that, this wasn't a consistently bearish sign for the stock market on any time frame.
*EPS didn't fall significantly during the 1973-1974 bear market and recession, even when adjusted for inflation. This is what made the 1973-1974 bear market and recession so hard to predict for many at the time.
With these kinds of stats, people usually say "valuations have never been this high before" or "the economic expansion cycle has never been this long before". If we isolated for cases in which Unemployment is under 6% and the Shiller P/E ratio is above 20:
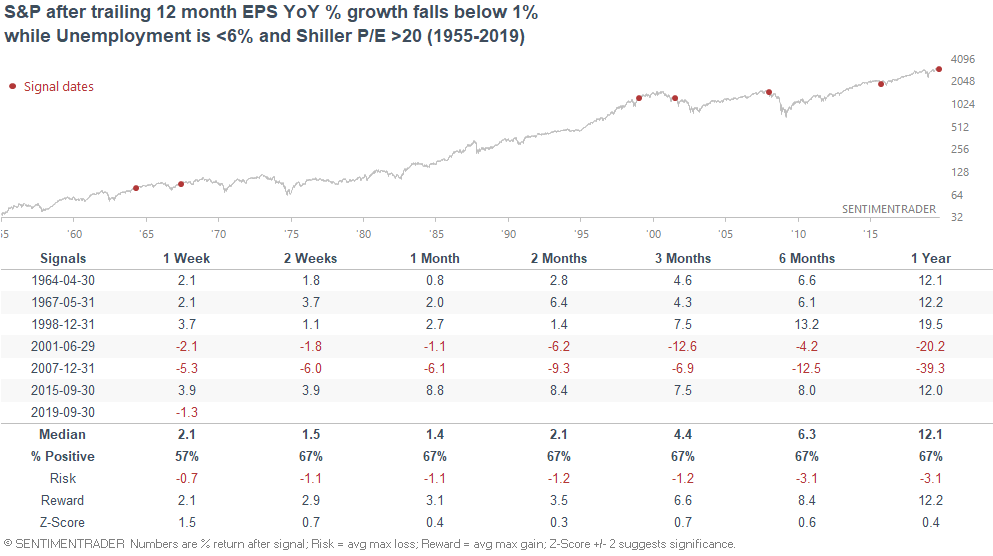
Forward returns deteriorate, but not necessarily immediately. Sometimes the bull market rallied another 1-2 years before the stock market crashed (see 1964, 1967, and 1998).
MSCI World Index
Similarly, the MSCI World Index's 12 month trailing EPS has fallen more than -4% over the past 12 months:
*The MSCI World Index includes 23 developed markets, with U.S. equities constituting 63% of this index. This suggests that ex-U.S. corporate earnings are worse than U.S. corporate earnings, which aligns with the fact that ex-U.S. economic growth is worse than U.S. economic growth.
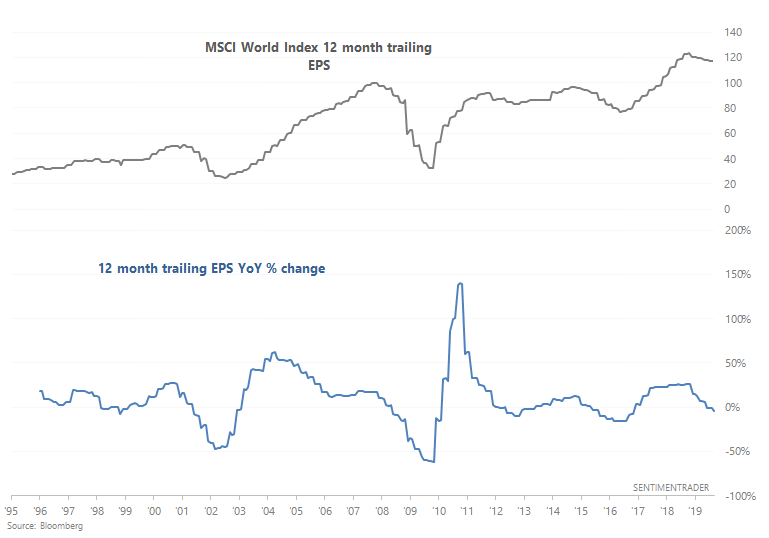
When this happened in the past, the MSCI World Index's forward returns were random. Sometimes this morphed into a bear market and recession, and sometimes this was a false alarm:
High yield spreads
High yield spreads are rising, and recently made a new high relative to its high in December/January:
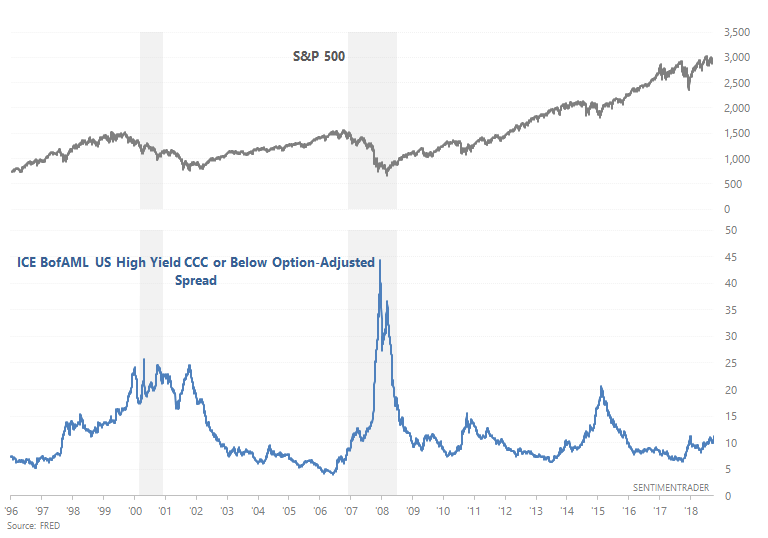
The fact that high yield spreads made a new low just before stocks crashed in Q4 2018 made me believe in late-2018 that September 2018 wasn't the top. In the past, the high yield spread trended higher before recessions and bear markets began. (Similarly, other bond market indicators like the yield curve can give you a rough sense of where we are in the business cycle).
When the high yield spread broke out to a 200 day high in the past, the S&P's returns over the next year were random. This preceded the 2000 and 2007 bull market tops, and gave advance warning of the 2018 and 2015 selloffs.
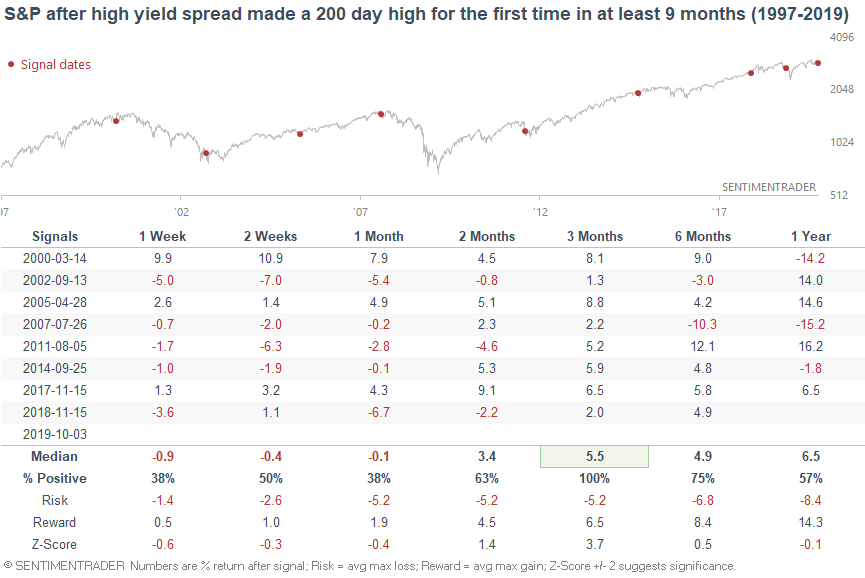
But interestingly enough, this always led to a rally over the next 3 months, even during the bear market cases.
Sweden PMI
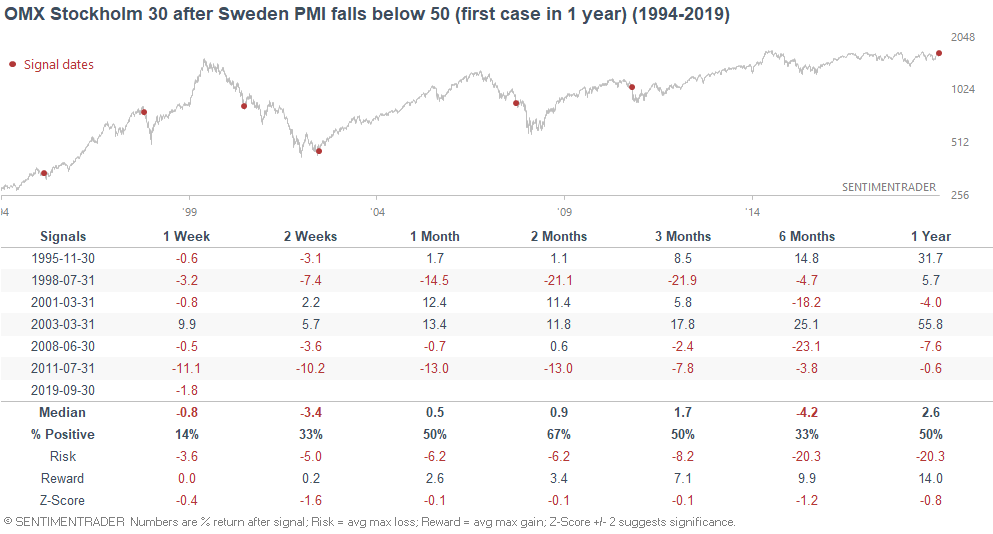
As several macro desks have noted (h/t The Market Ear), Sweden's PMI tanked. The PMI is now under 50 (contraction), and this is one of the largest 1 month drops:
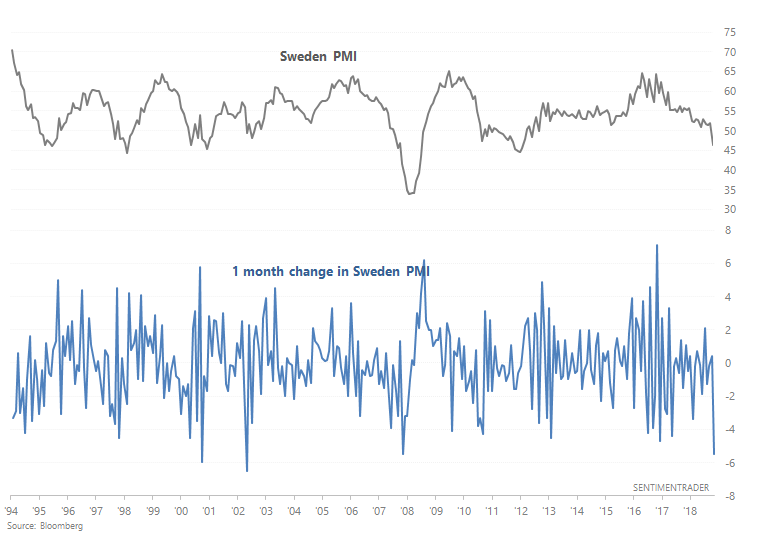
Although the figure came in much lower than expected, it's not hard to see why this figure was so weak. The Eurozone as a whole is weak, and half of Swedish GDP comes from exports.
When Sweden's PMI fell below 50 in the past, the Stockholm 30's forward returns were more bearish than random:
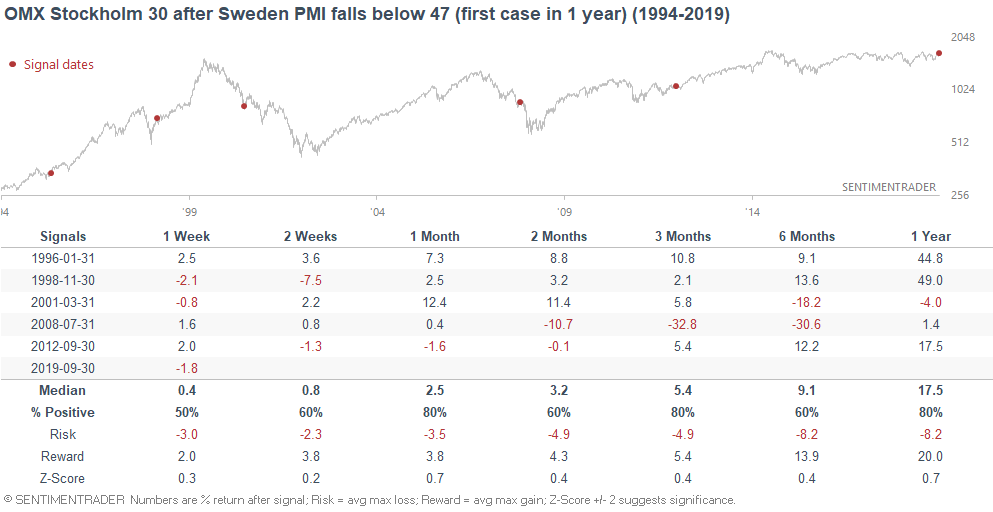
But if we look at the cases in which Sweden's PMI fell below 47 (matching today, also reducing sample size), the Stockholm 30's forward returns are no longer worse than average.
And lastly, if we look at every case in which Sweden's PMI fell at least -4 in one month...
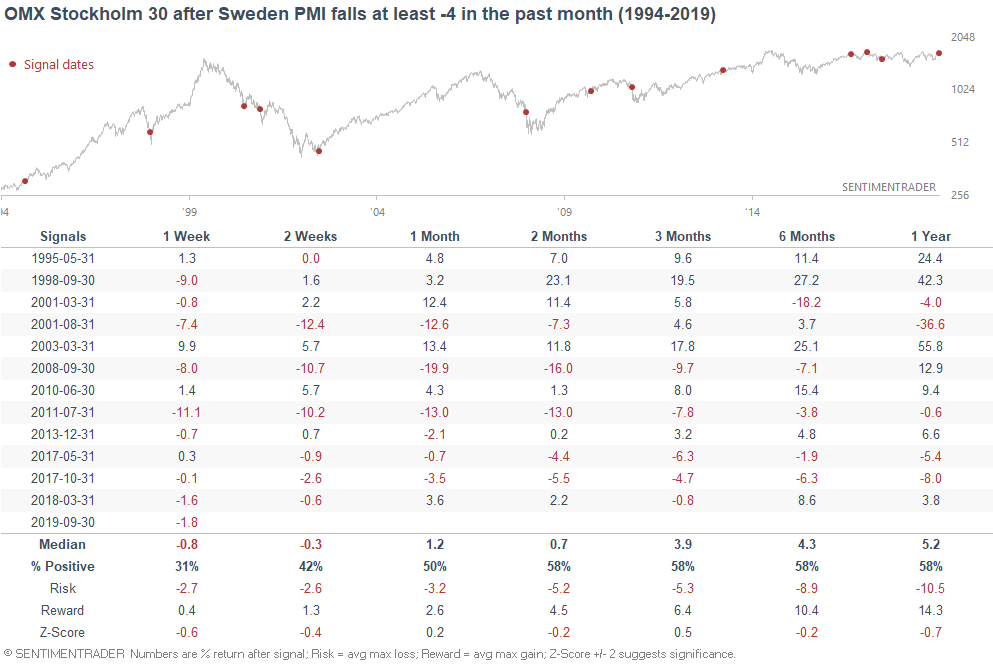
... the Stockholm 30's forward returns are no different from random.
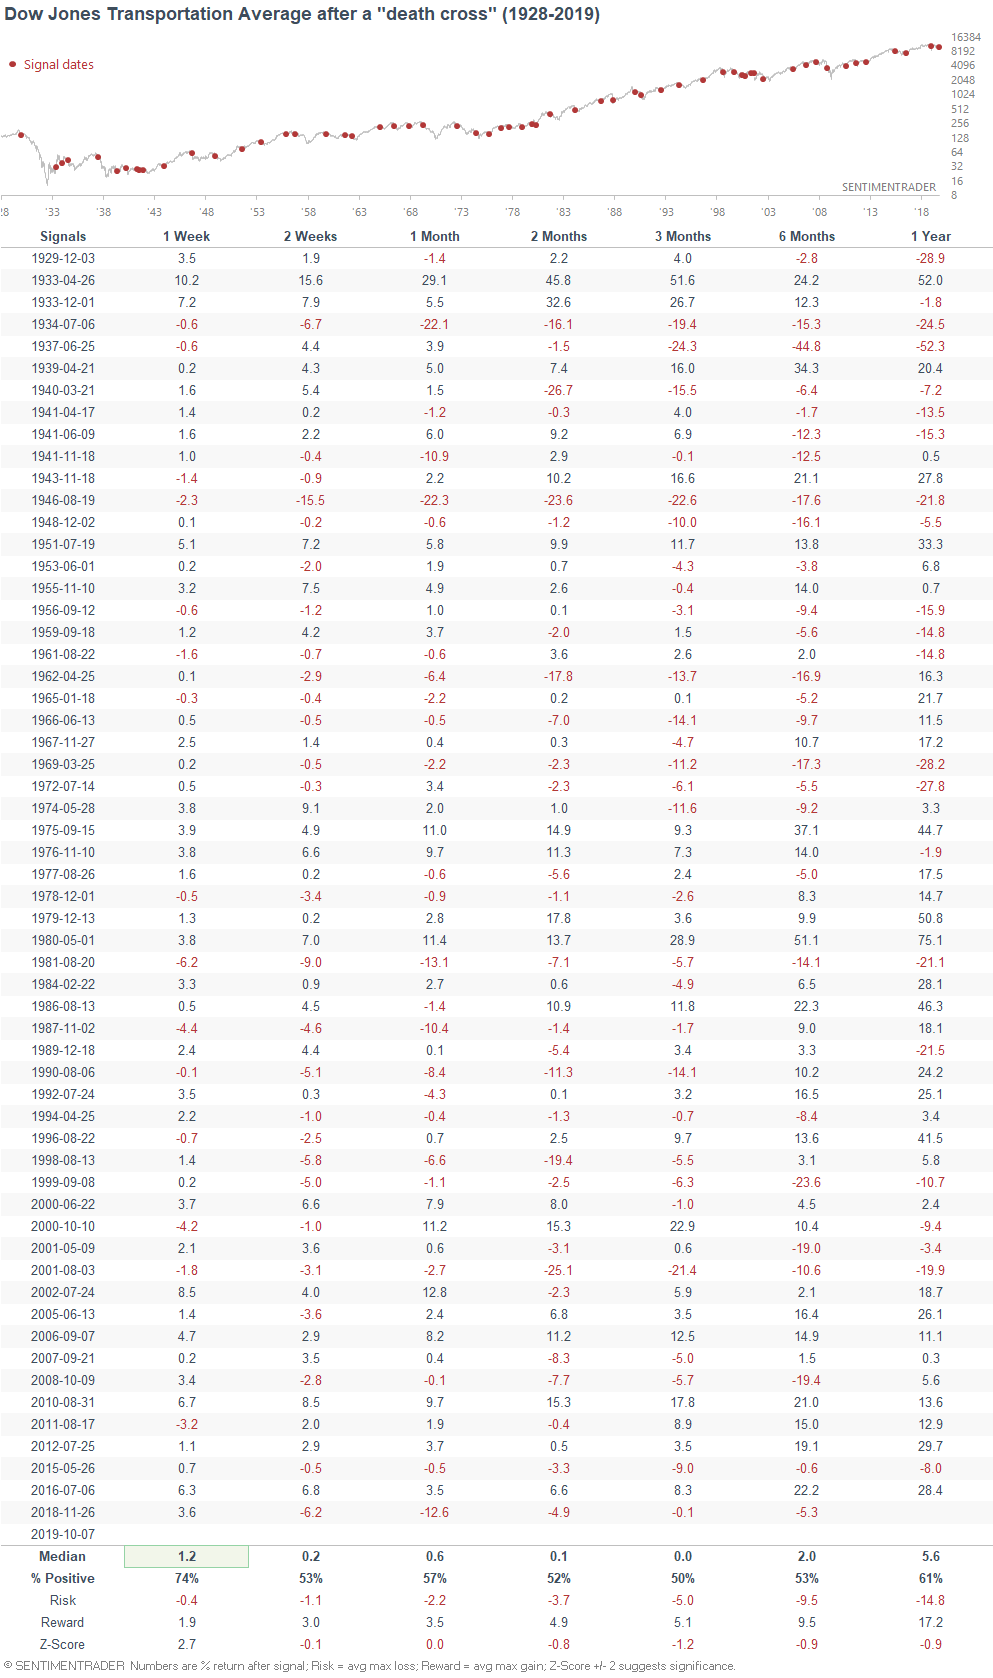
Dow Jones Transportation Average
And lastly, the Dow Jones Transportation Average has made a "death cross" whereby its 50 dma fell below its 200 dma:
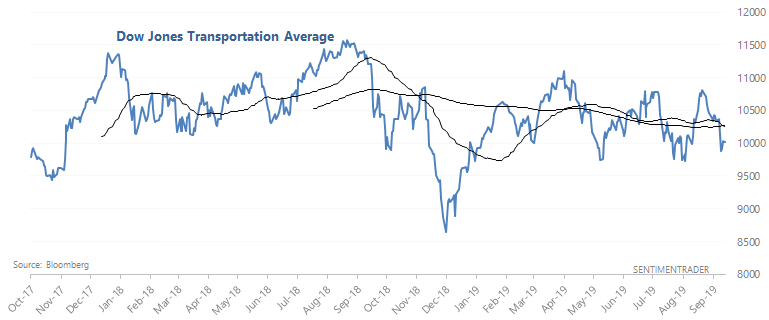
When this happened in the past, the Dow Jones Transportation Average's forward returns weren't necessarily bearish, but were certainly worse than random (see "Risk" and "Z-score"). This is standard for traditional price-only trend following strategies: they don't significantly beat buy and hold in the long run, but they do help traders avoid the worst bear markets.
If you have any questions or comments, feel free to email me at [email protected]