
A In-Depth Look at the Sentimentrader's New TCTM Risk Warning Model - Part II

Key points
- This report is Part II of our deep dive into the TCTM Risk-Warning Model, a key component of our broader TCTM framework.
- We deconstruct the logic and performance of the model's components related to S&P 500 internals, Financial sector weakness, cyclical divergences, and broad sentiment.
- The composite model's logic is explained, which combines all 10 components into a single risk-off signal when 30% or more are active.
- Individually, these components show a history of preceding weak or subpar market returns, validating the model's "risk-off" design.
Risk-Warning Model Components
Identifying the primary market trend is one of the most critical tasks for any trader or investor. The Tactical Composite Trend Model (TCTM) is the culmination of decades of professional trading and financial market research, designed to aid in this process. The TCTM utilizes a weight-of-the-evidence approach, combining seven key time-tested components to identify major market turning points. This report will focus on one of those key components: the Sentimentrader's New TCTM Risk-Warning Model (S-TCTM).
The Risk-Warning Model contains ten algorithms designed to identify historical instances of declining market participation and excessive optimism. Historically, weak internal trends and overly optimistic sentiment often act as early warning signals for a potential trend change. In this new TCTM Risk-Warning Model, we have adjusted and optimized these ten component algorithms, which we will introduce in the following sections.
Please note that we are still in the process of developing the TCTM program for the website. Currently, we will continue to update subscribers with any new developments.
Component Descriptions
- New 52-Week High Low Ratio
- 52-Week Low with Percent above 200-Day
- High Low Logic NYSE with Spike
- Advance-Decline Line Divergence
- New Lows Spike SPX
- High Low Logic SPX with Spike
- Financial Relative Strength
- Financial Absolute Lows
- Cyclical Group Spread
- Sentiment Comp
Risk-Warning Model Signal Criteria
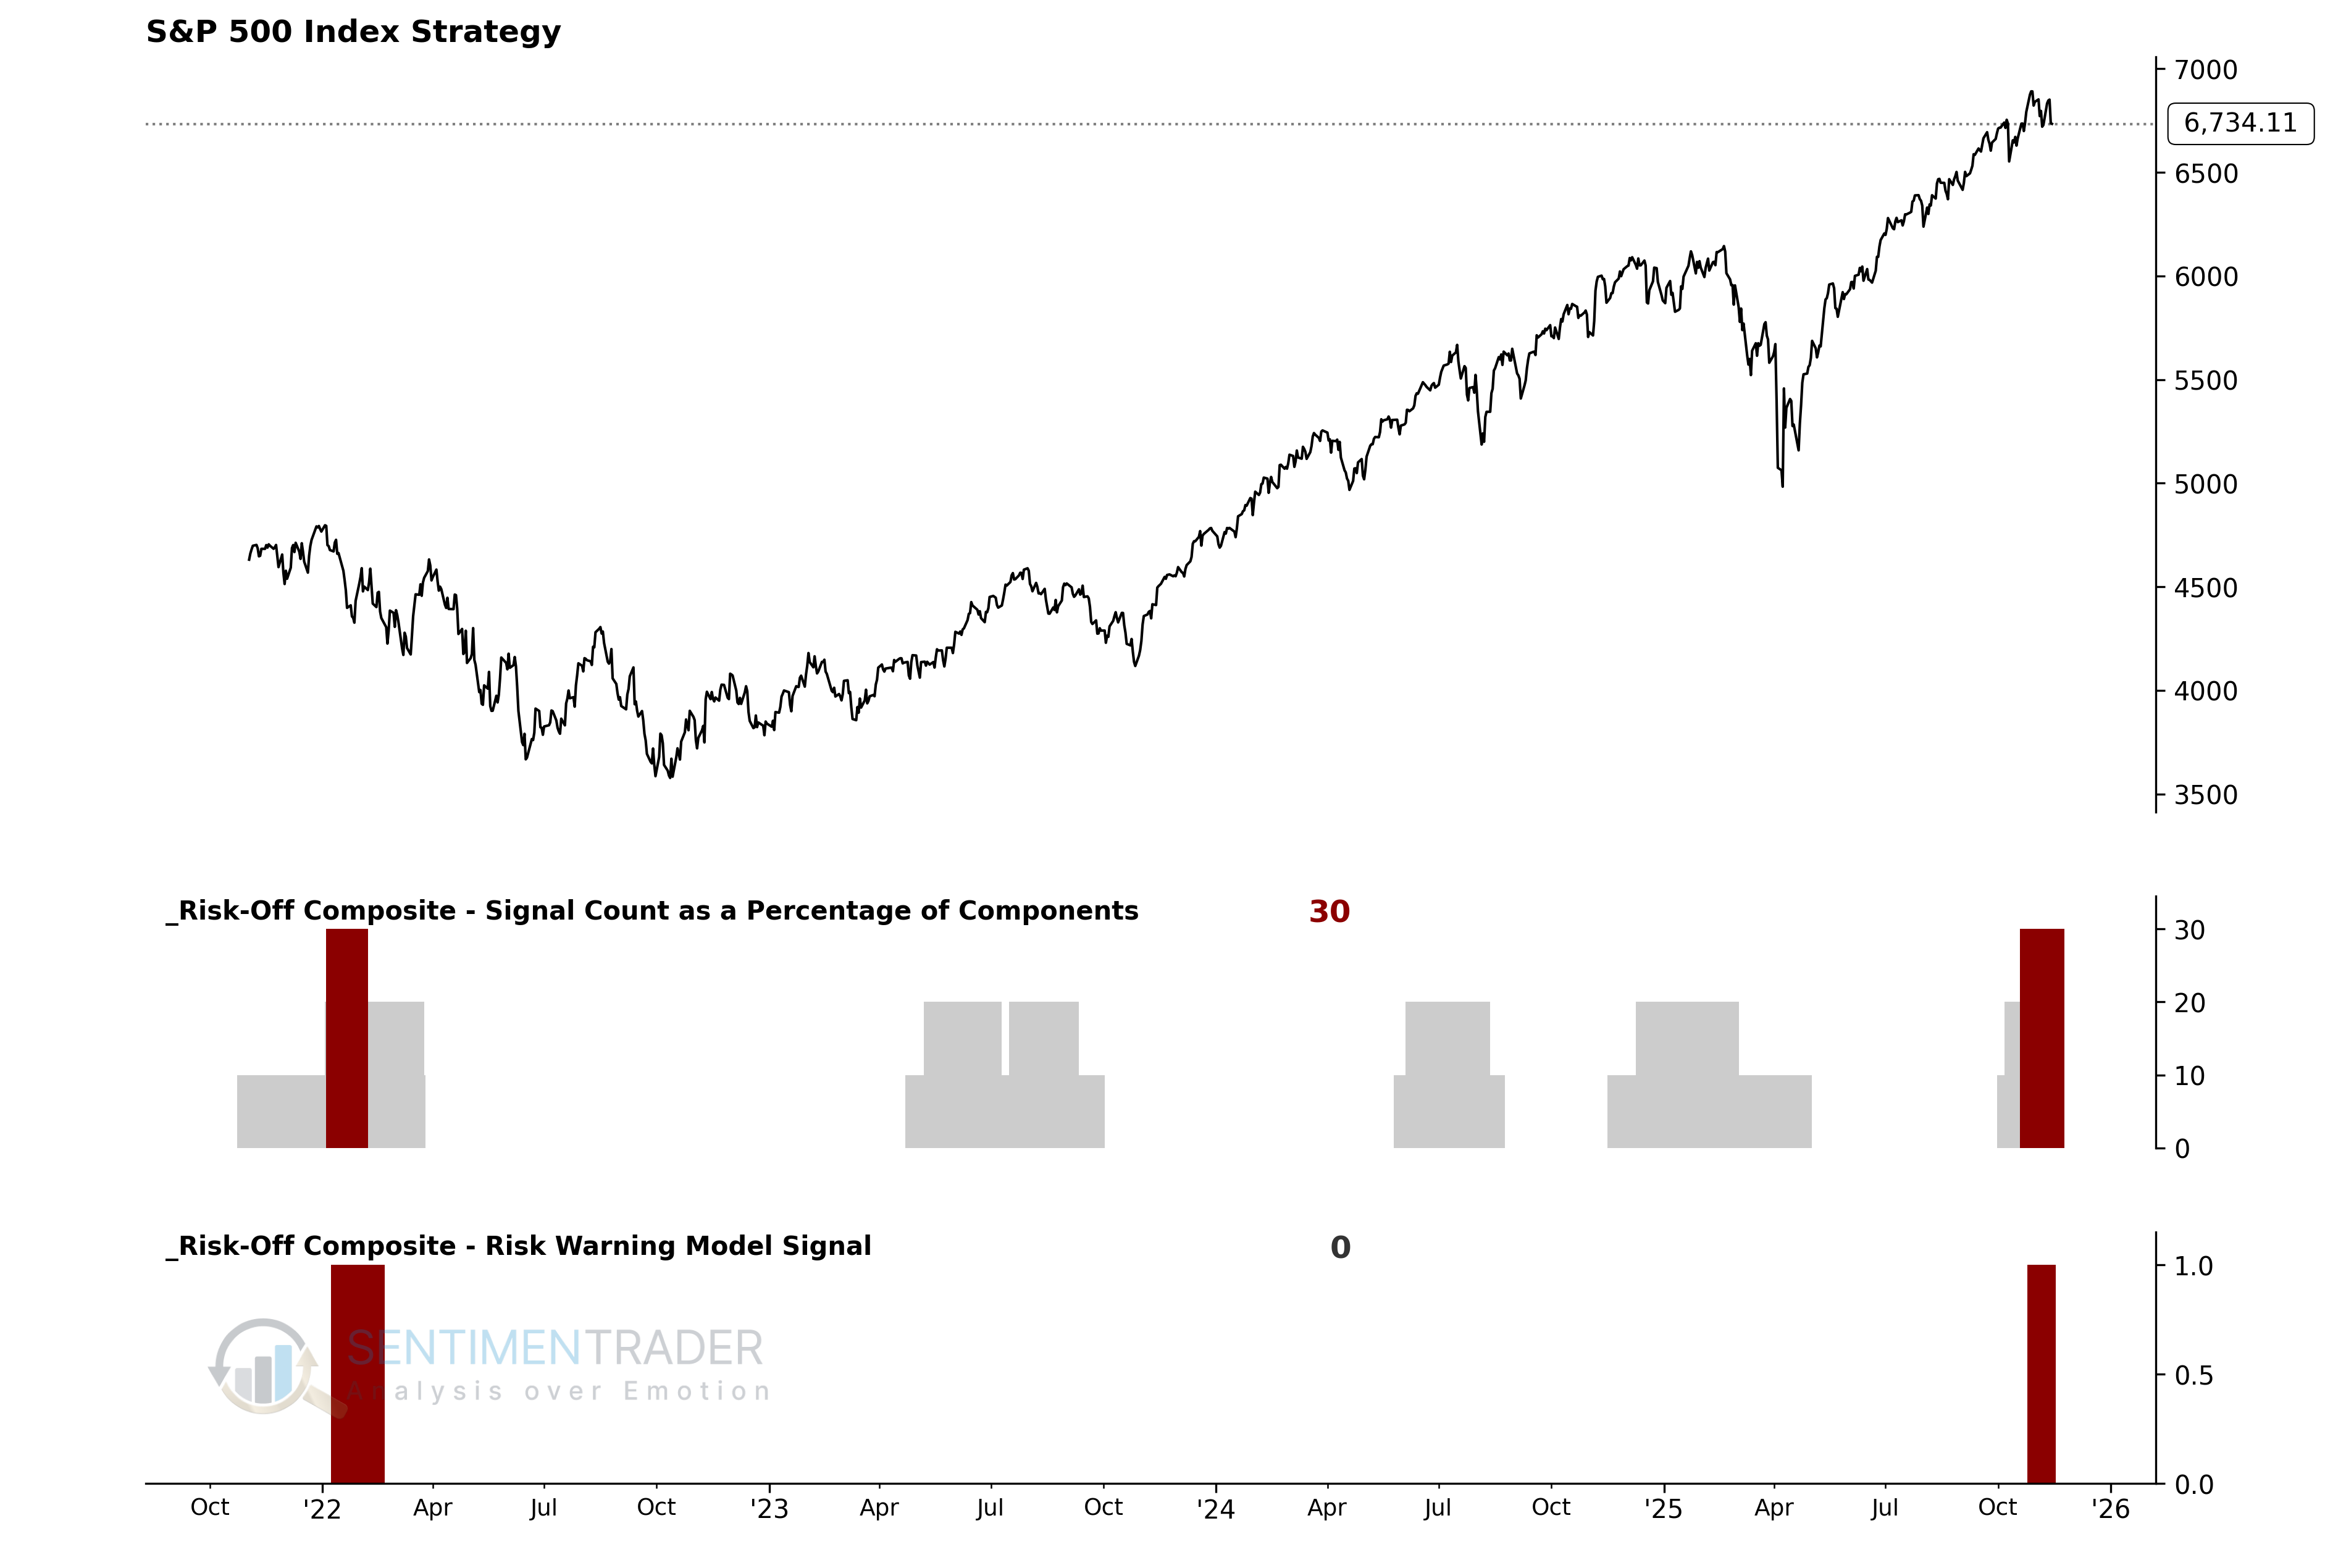
- Condition 1 = Composite Signal Count >= 30%.
- Condition 2 = If Condition 1 is met, begin counting days from the true count.
- Condition 3 = If Days Since True Count <= 20, AND the 5-day Rate of Change for the S&P 500 is -1% or higher, a risk-off signal is issued.
- Condition 4 = The composite count resets below 20%. This reset filters out repetitive signals.
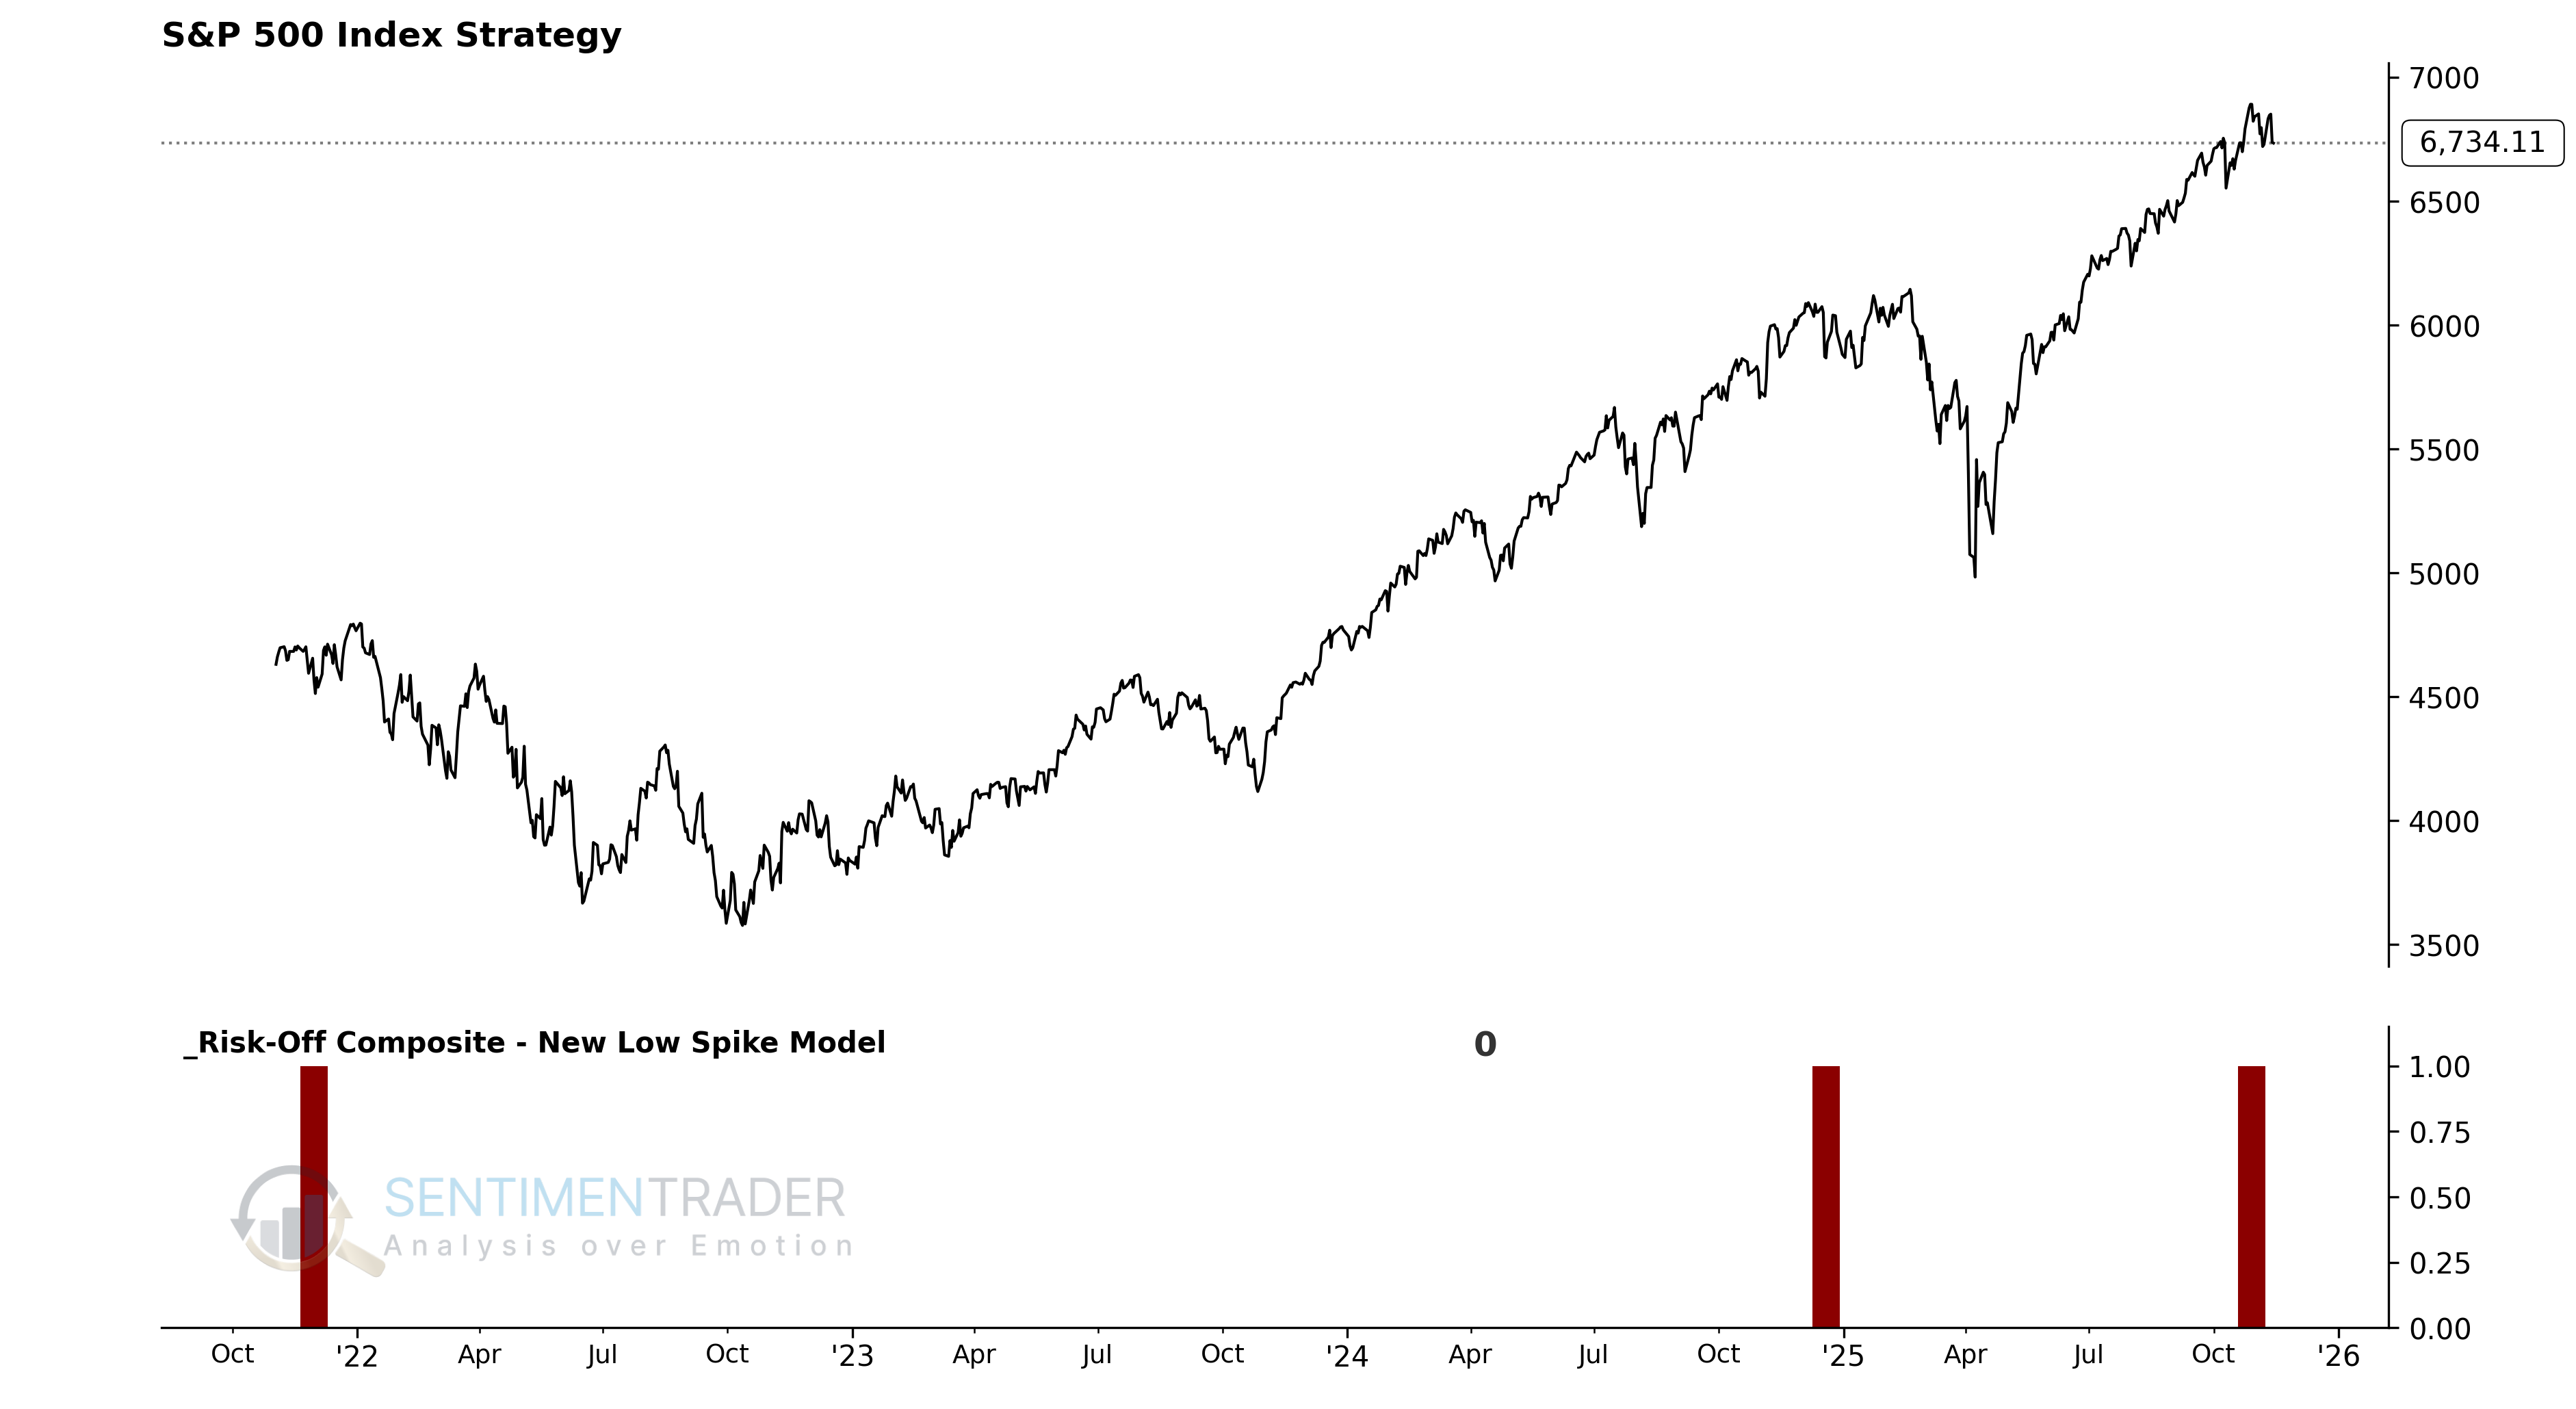
As the chart below illustrates, these individual components are combined into a single composite indicator-the Risk-Warning Model-which uses a 0 or 1 value to issue alerts. Currently, the model shows a reading of 0, indicating no warning signal is active.
Edit: The latest version has fixed parameter errors in the Cyclical Group Spread and Sentiment Composite Risk-Off Model. They are now functioning correctly within the Risk-Warning Model.
Utilizing the S-TCTM Risk Warning Model
We can define the market environment as "favorable" or "unfavorable" based on the model's interpretation, without subjective interpretation. In other words:
- When the risk warning model goes from 0 to 1, the dominant trend is considered unfavorable for the stock.
With this framework, we can build a systematic trend-following strategy and see how this approach performs historically.
Using the BacktestEdge engine, we can set entry and exit criteria to track the model's signals. The setup process is very simple:
When the S-TCTM Risk Warning model goes from 0 to 1, i.e., we set the entry criteria and establish a long position when the trend is unfavorable. For related backtest, click here.
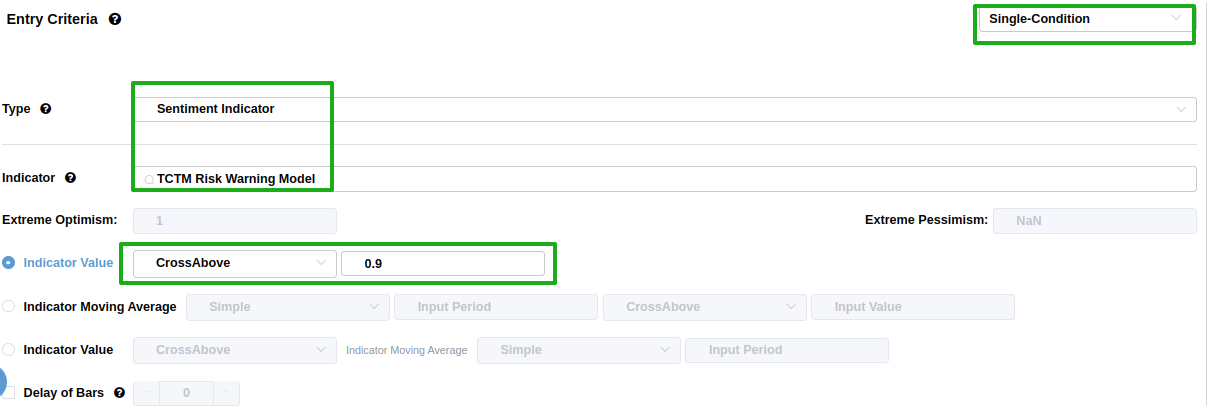
Exits we can skip without setting, as we are more interested in the performance of the signal after it is issued.
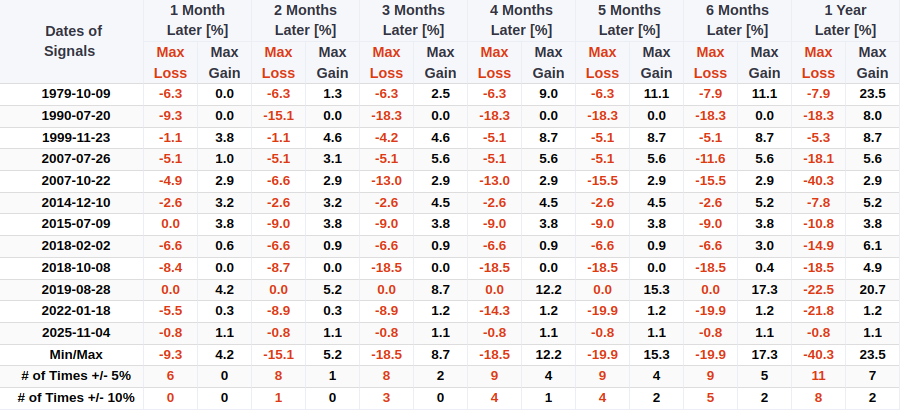
As shown in the figure, performance was weak over the 1-6 month timeframe.
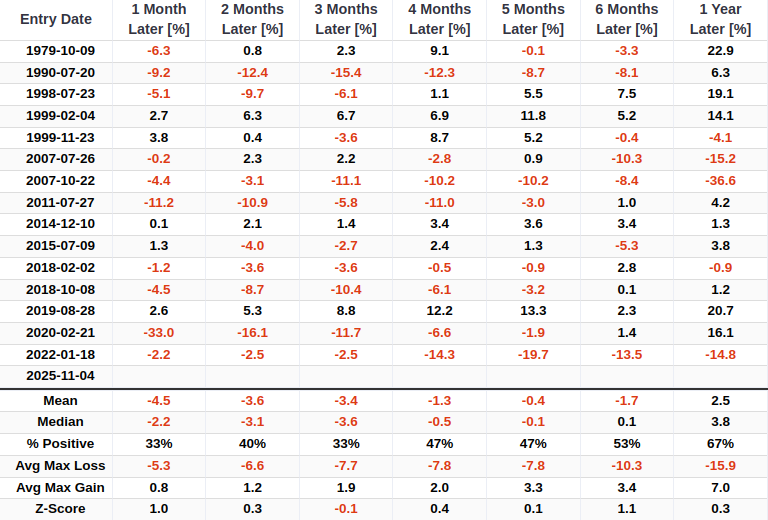
The absolute value of the maximum loss during each cycle far exceeds the maximum profit, with extreme losses significantly outpacing extreme gains. Moreover, risk continues to escalate throughout the holding period.
Component Deep Dive (Part II)
The New Low Spike Model utilizes the percentage of S&P 500 members registering a new 252-day low.
Signal Criteria
- Condition 1 = The percentage of S&P 500 members with a 252-day low crosses above 7.7%.
- Condition 2 = The S&P 500 is less than 5% from its 252-day high.
- Condition 3 = The percentage of S&P 500 252-day lows resets below 0.5%. This reset filters out repetitive signals.
- If Conditions 1-3 are met, a risk-off signal is issued.
Current Day Chart
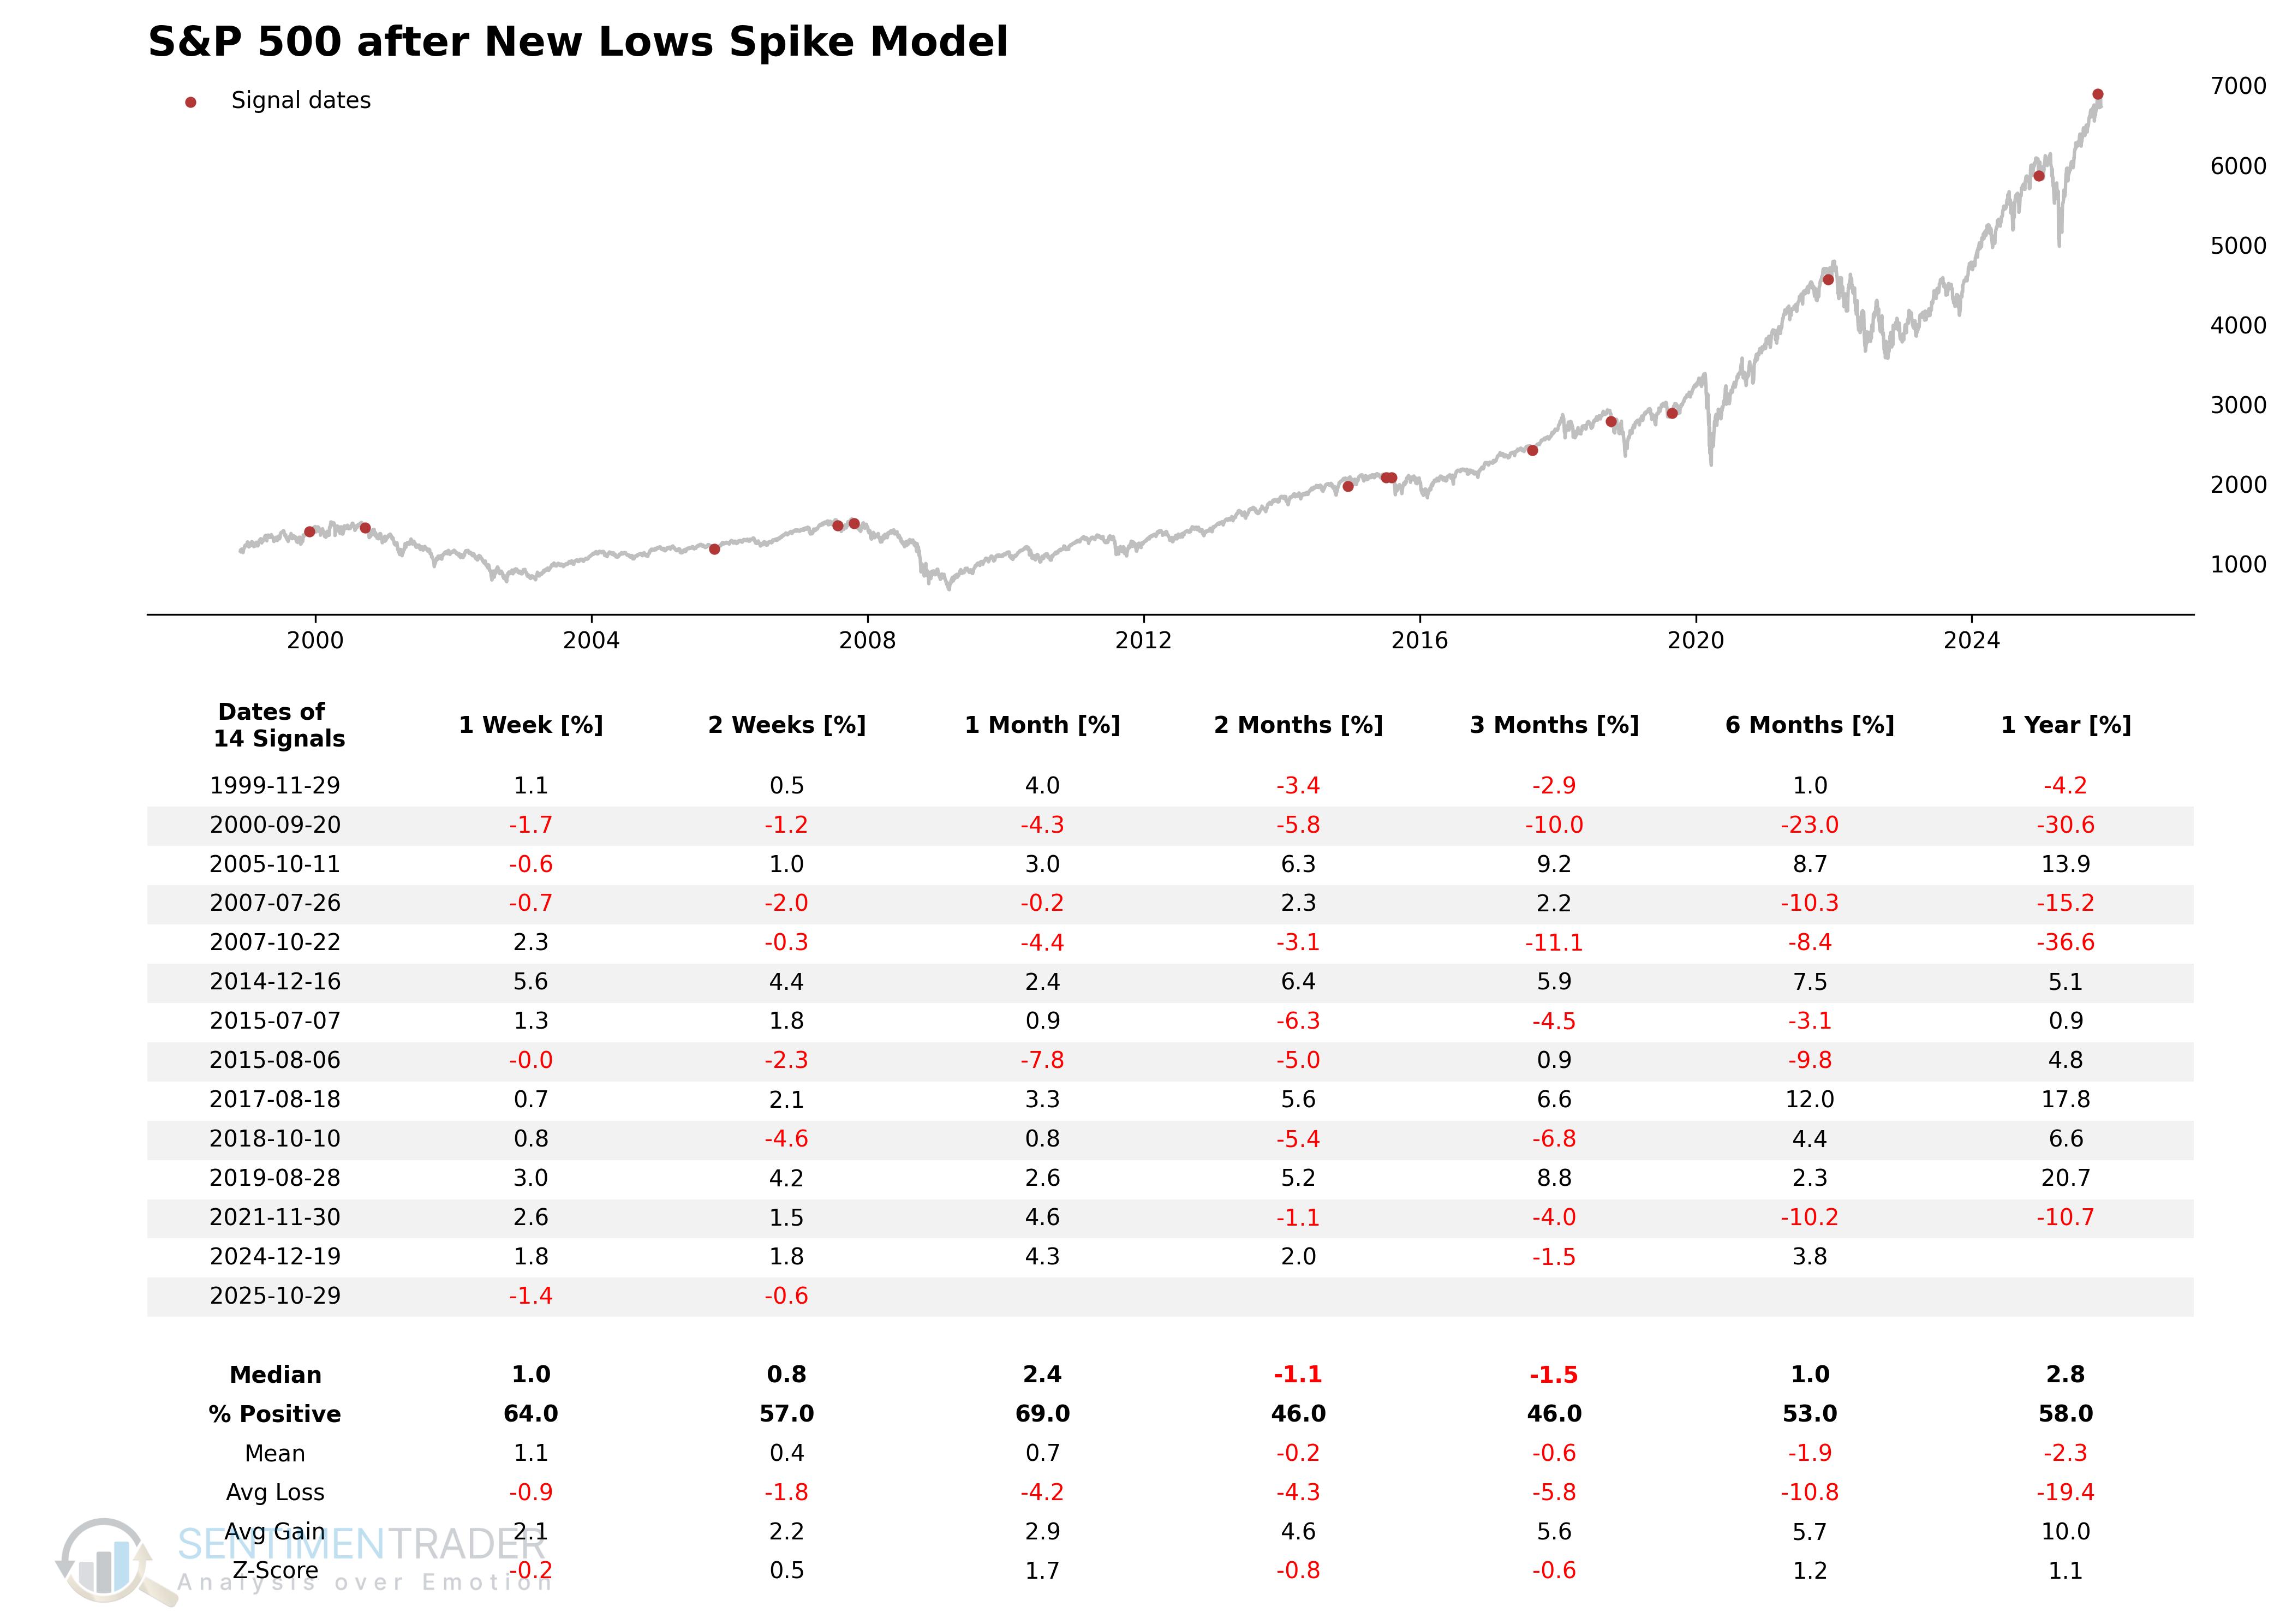
Signal Performance
As seen, performance was weak in the two and three-month time frames.
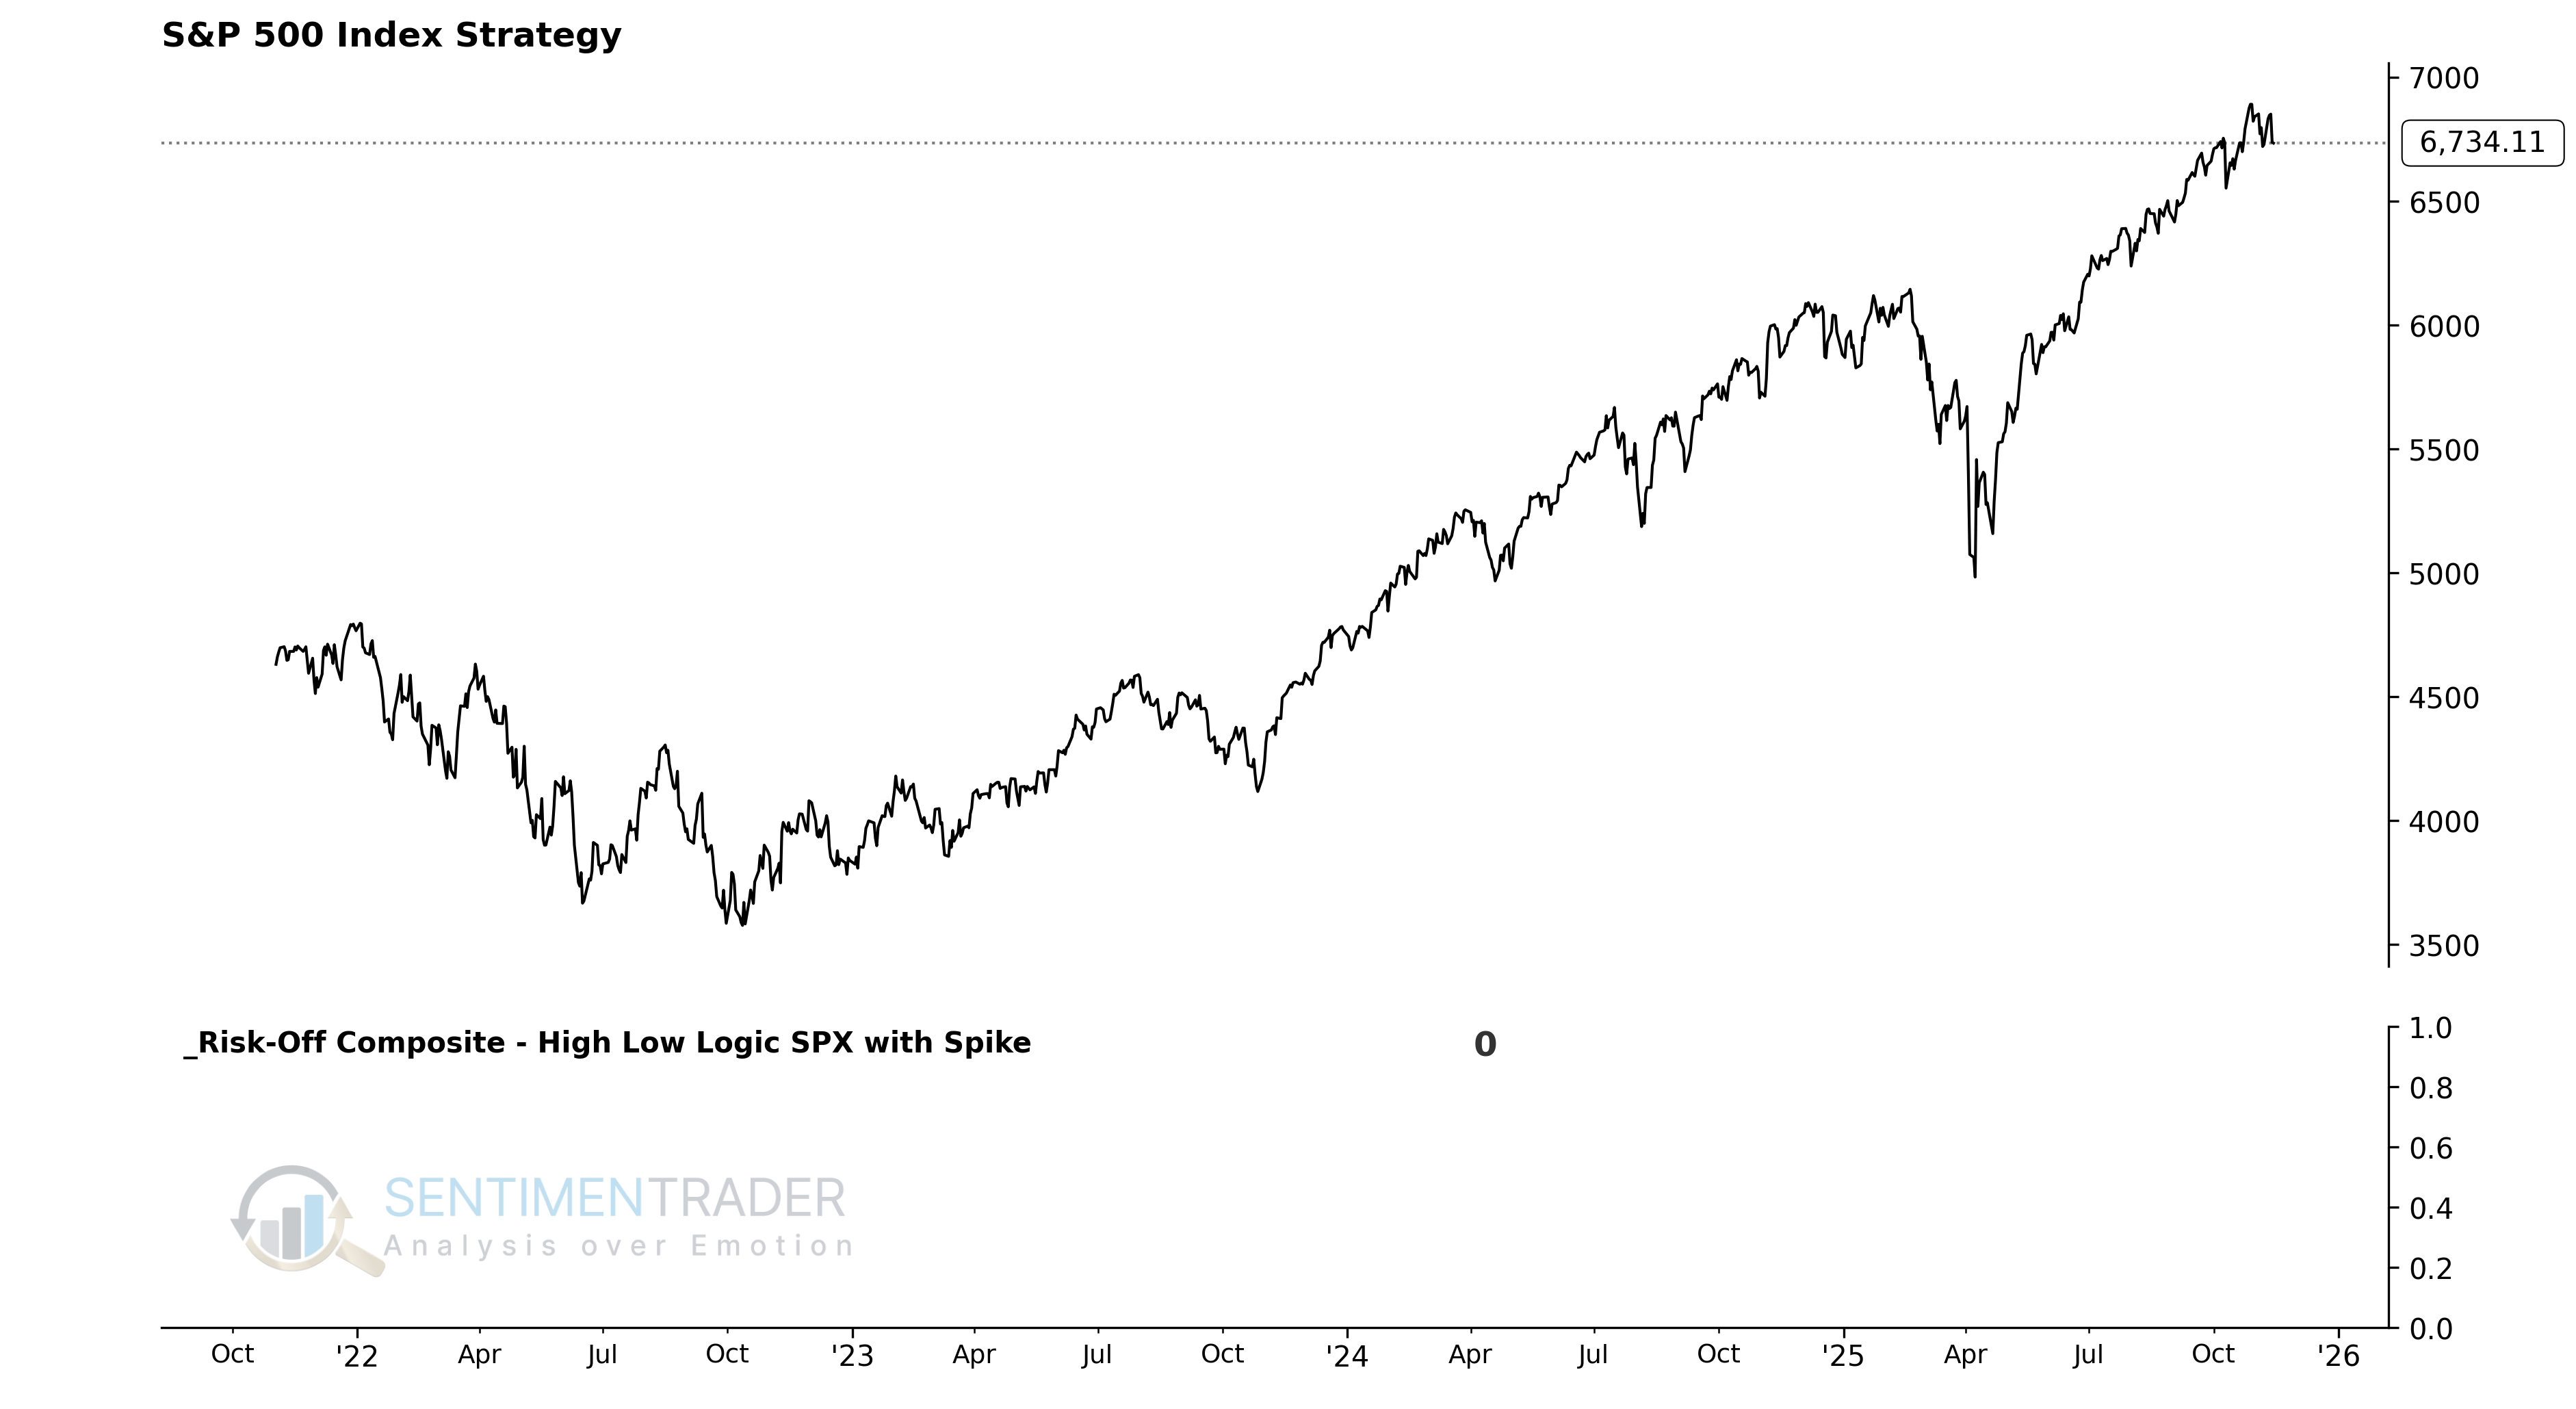
The High Low Logic Index, created by Norman Fosback, is a classic market breadth indicator designed to identify market environments where a large number of stocks are making 52-week highs and lows simultaneously. Similar to the NYSE version, this S&P 500 version uses a spike in the percentage of new lows as a trigger once the index exceeds a warning level. However, the S&P 500 version uses the original 50-day exponential moving average, whereas our NYSE version uses a 40-day MA.
Signal Criteria
- Condition 1 = High Low Logic Index >= 1.8%.
- Condition 2 = Percentage of S&P 500 252-day lows >= 4.5%.
- Condition 3 = S&P 500 is <= 5.0% from its 252-day high.
- Condition 4 = The High Low Logic Index resets below 1.4%. This reset filters out repetitive signals.
- If Conditions 1-4 are met, a risk-off signal is issued.
Current Day Chart
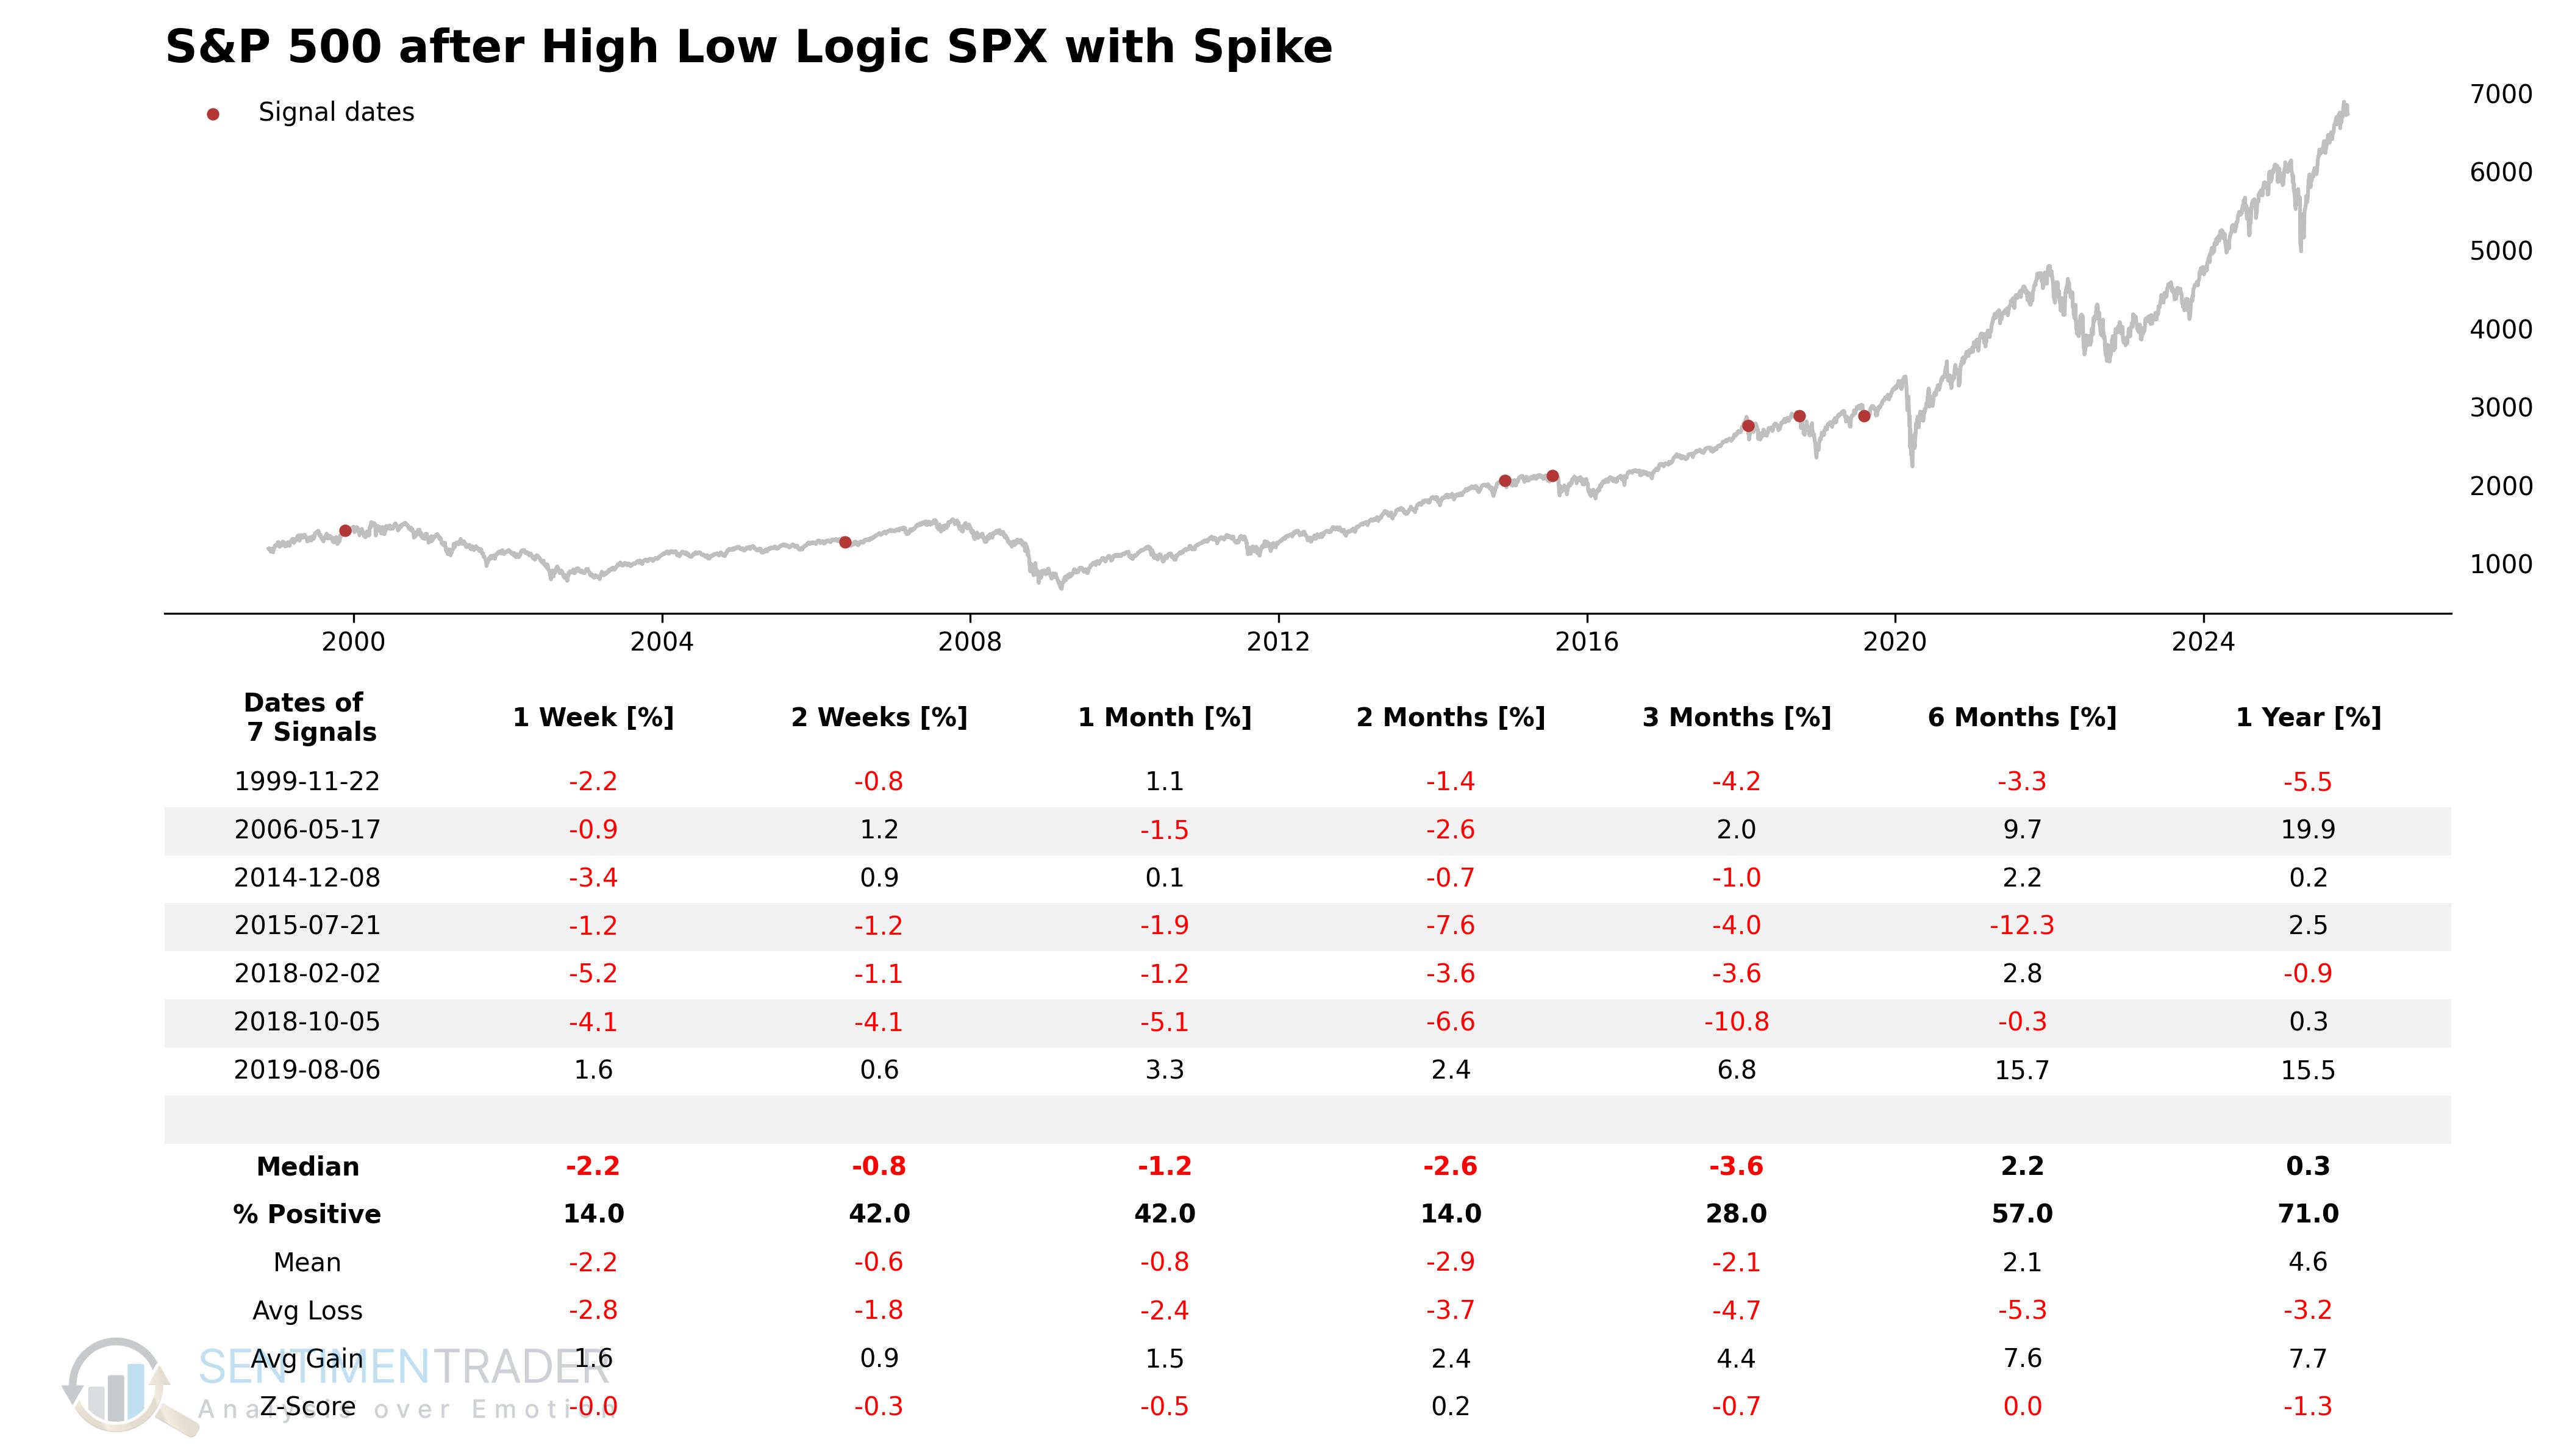
Signal Performance
As one can see, performance is weak across all timeframes, especially in the 0-3 month window.
The Financials Relative Strength Low Count Model is designed to identify historical instances where the Financials sector is severely underperforming the broad market.
Signal Criteria
- Condition 1 = The 252-day relative low count for either the cap-weighted or equal-weighted Financials sector vs. the S&P 500 is >= 10. (i.e., Financials are at a relative low).
- Condition 2 = The current 252-day relative low count is > the count from 10 days ago (i.e., the count is rising).
- Condition 3 = S&P 500 is <= 3.5% from its 252-day high.
- Condition 4 = The loss of the financial sector (either the cap-weighted or equal-weighted Financials sector) over 252 days is ≥5.0%.
- If Conditions 1-4 are true, reduce market exposure.
Current Day Chart
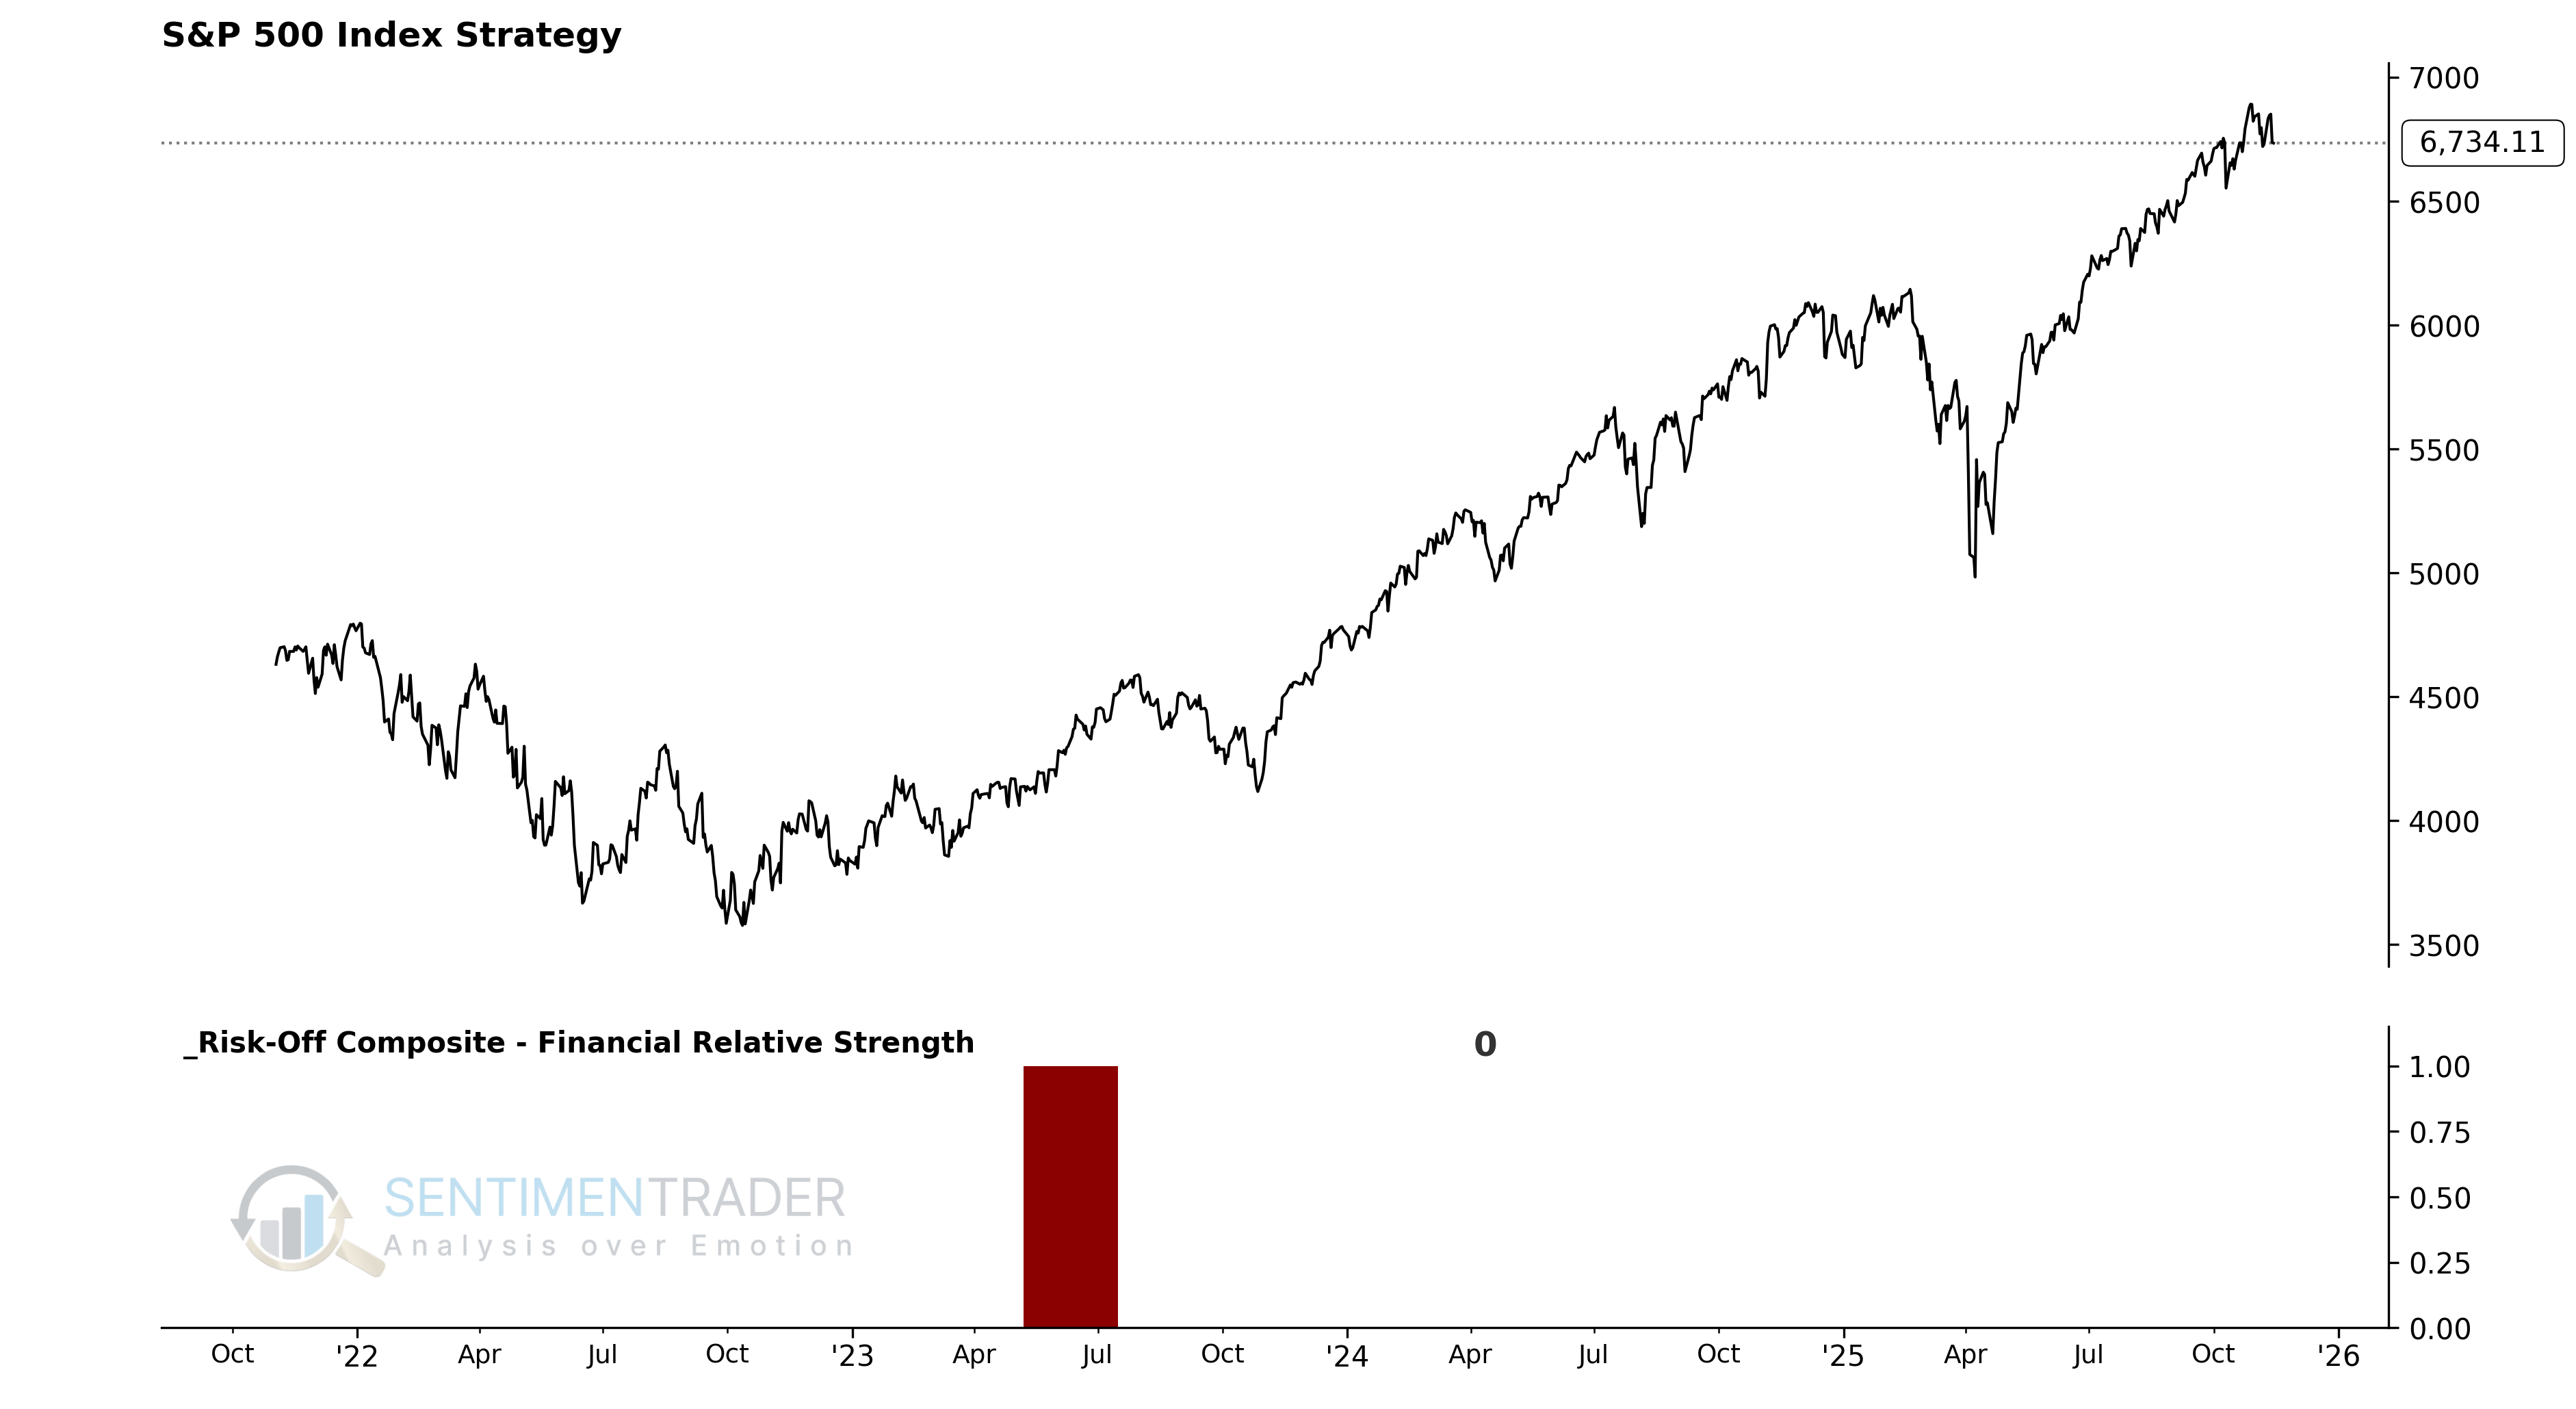
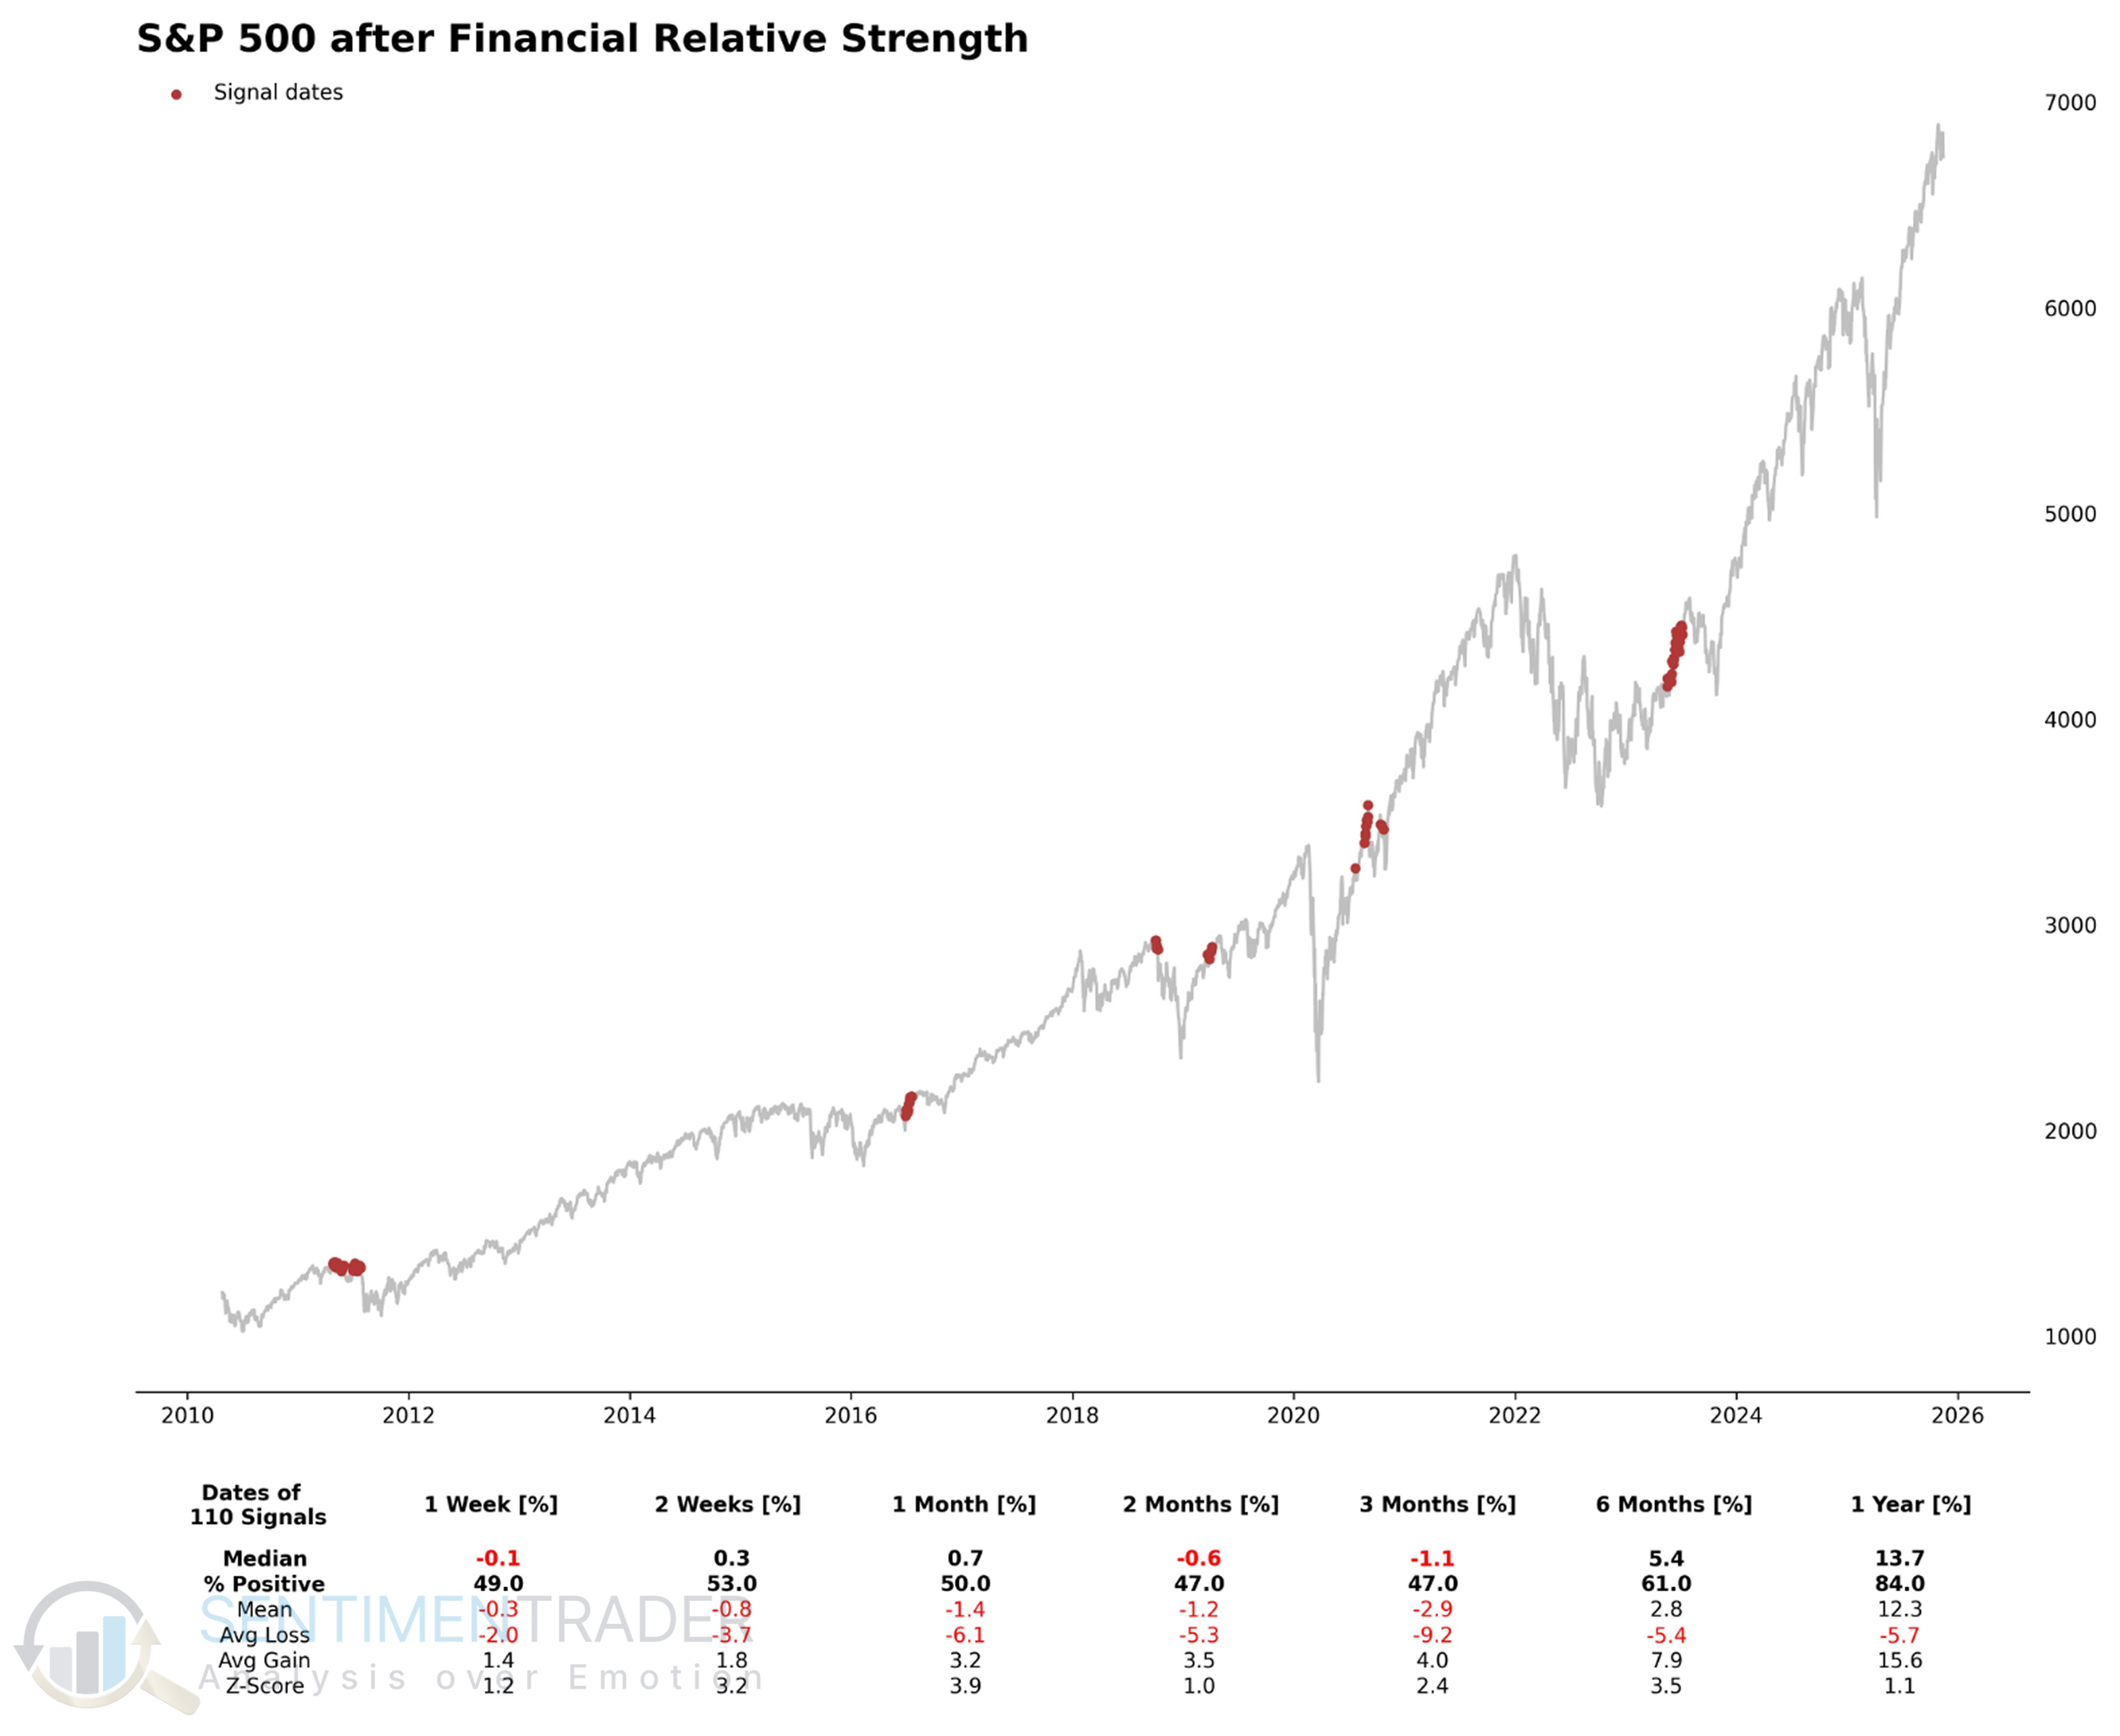
Signal Performance
As can be seen, performance has been poor across all time periods, with the exception of the one-year outlook.
The Financial Absolute Lows model is designed to identify when a high proportion of lows within the S&P 500 are coming from the Financials sector, and when the percentage of lows within the Financial sector itself is high.
Signal Criteria
- Condition 1 = The percentage of S&P 500 63-day lows that are Financials members is >= 38%. (i.e., Financials dominate the new low list).
- Condition 2 = The percentage of S&P 500 Financials members making a 63-day low is >= 12.0%. (i.e., weakness is broad within the sector).
- Condition 3 = S&P 500 is <= 3.0% from its 500-day high.
- If Conditions 1-3 are true, reduce market exposure.
Current Day Chart
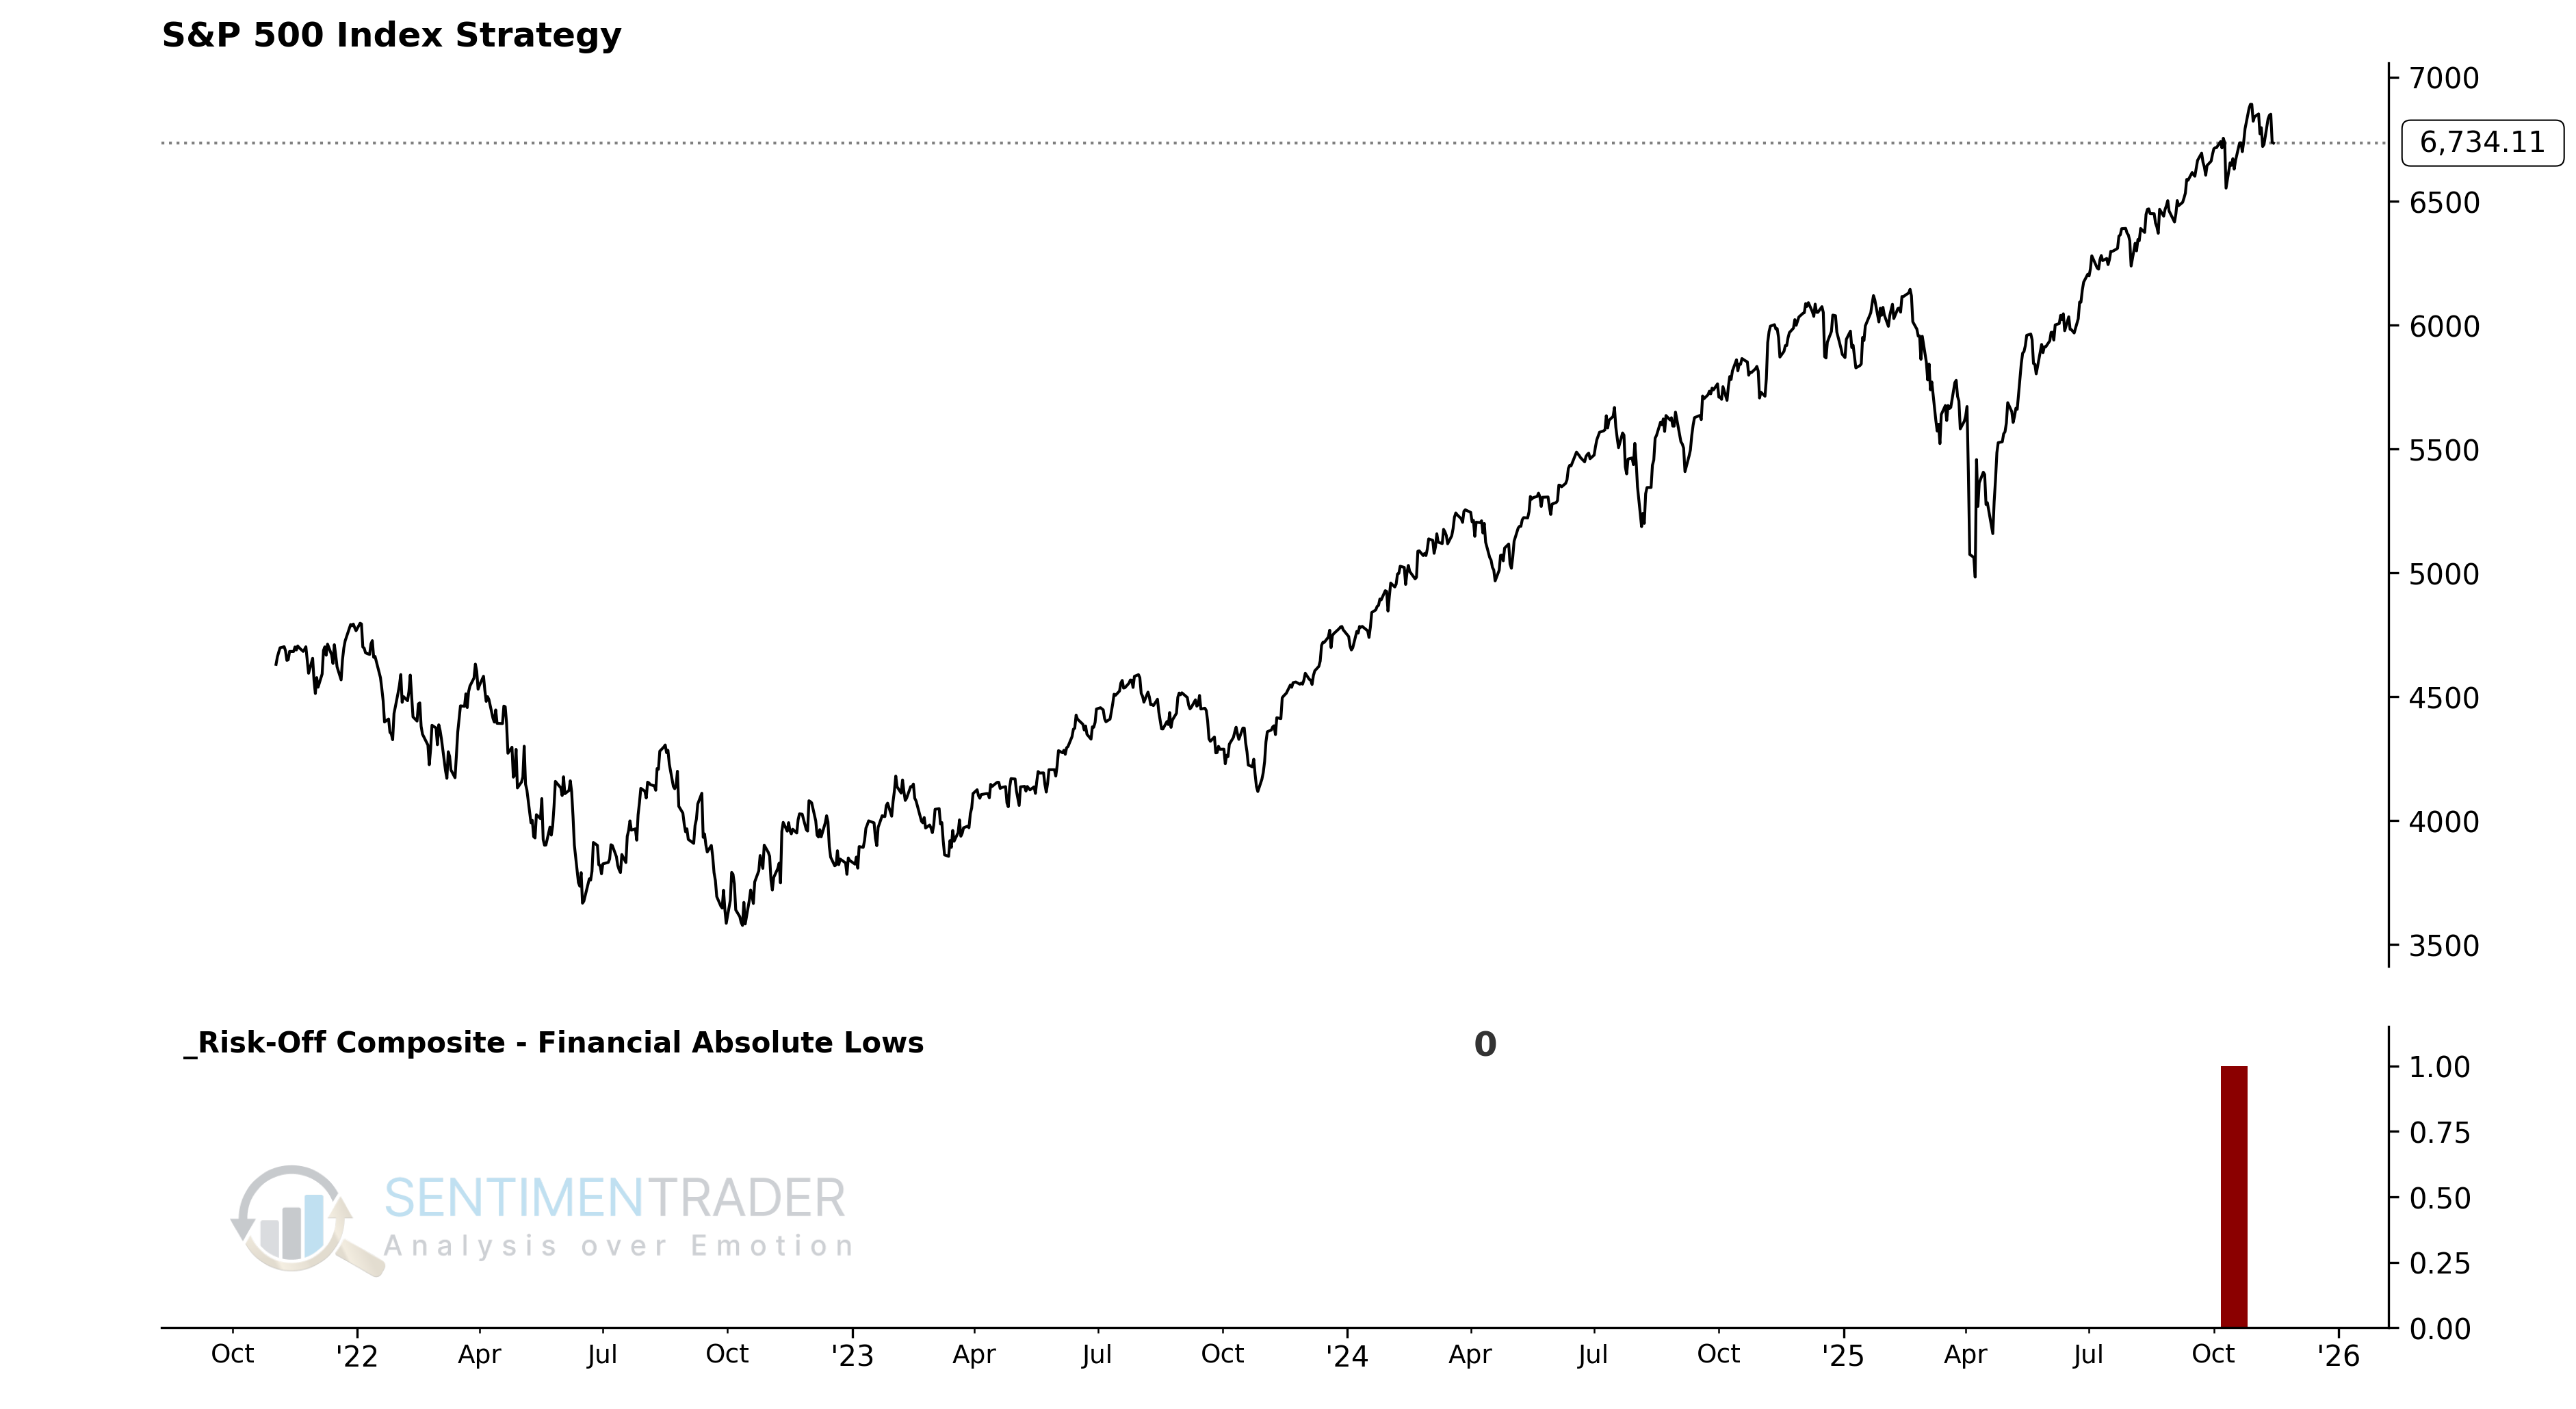
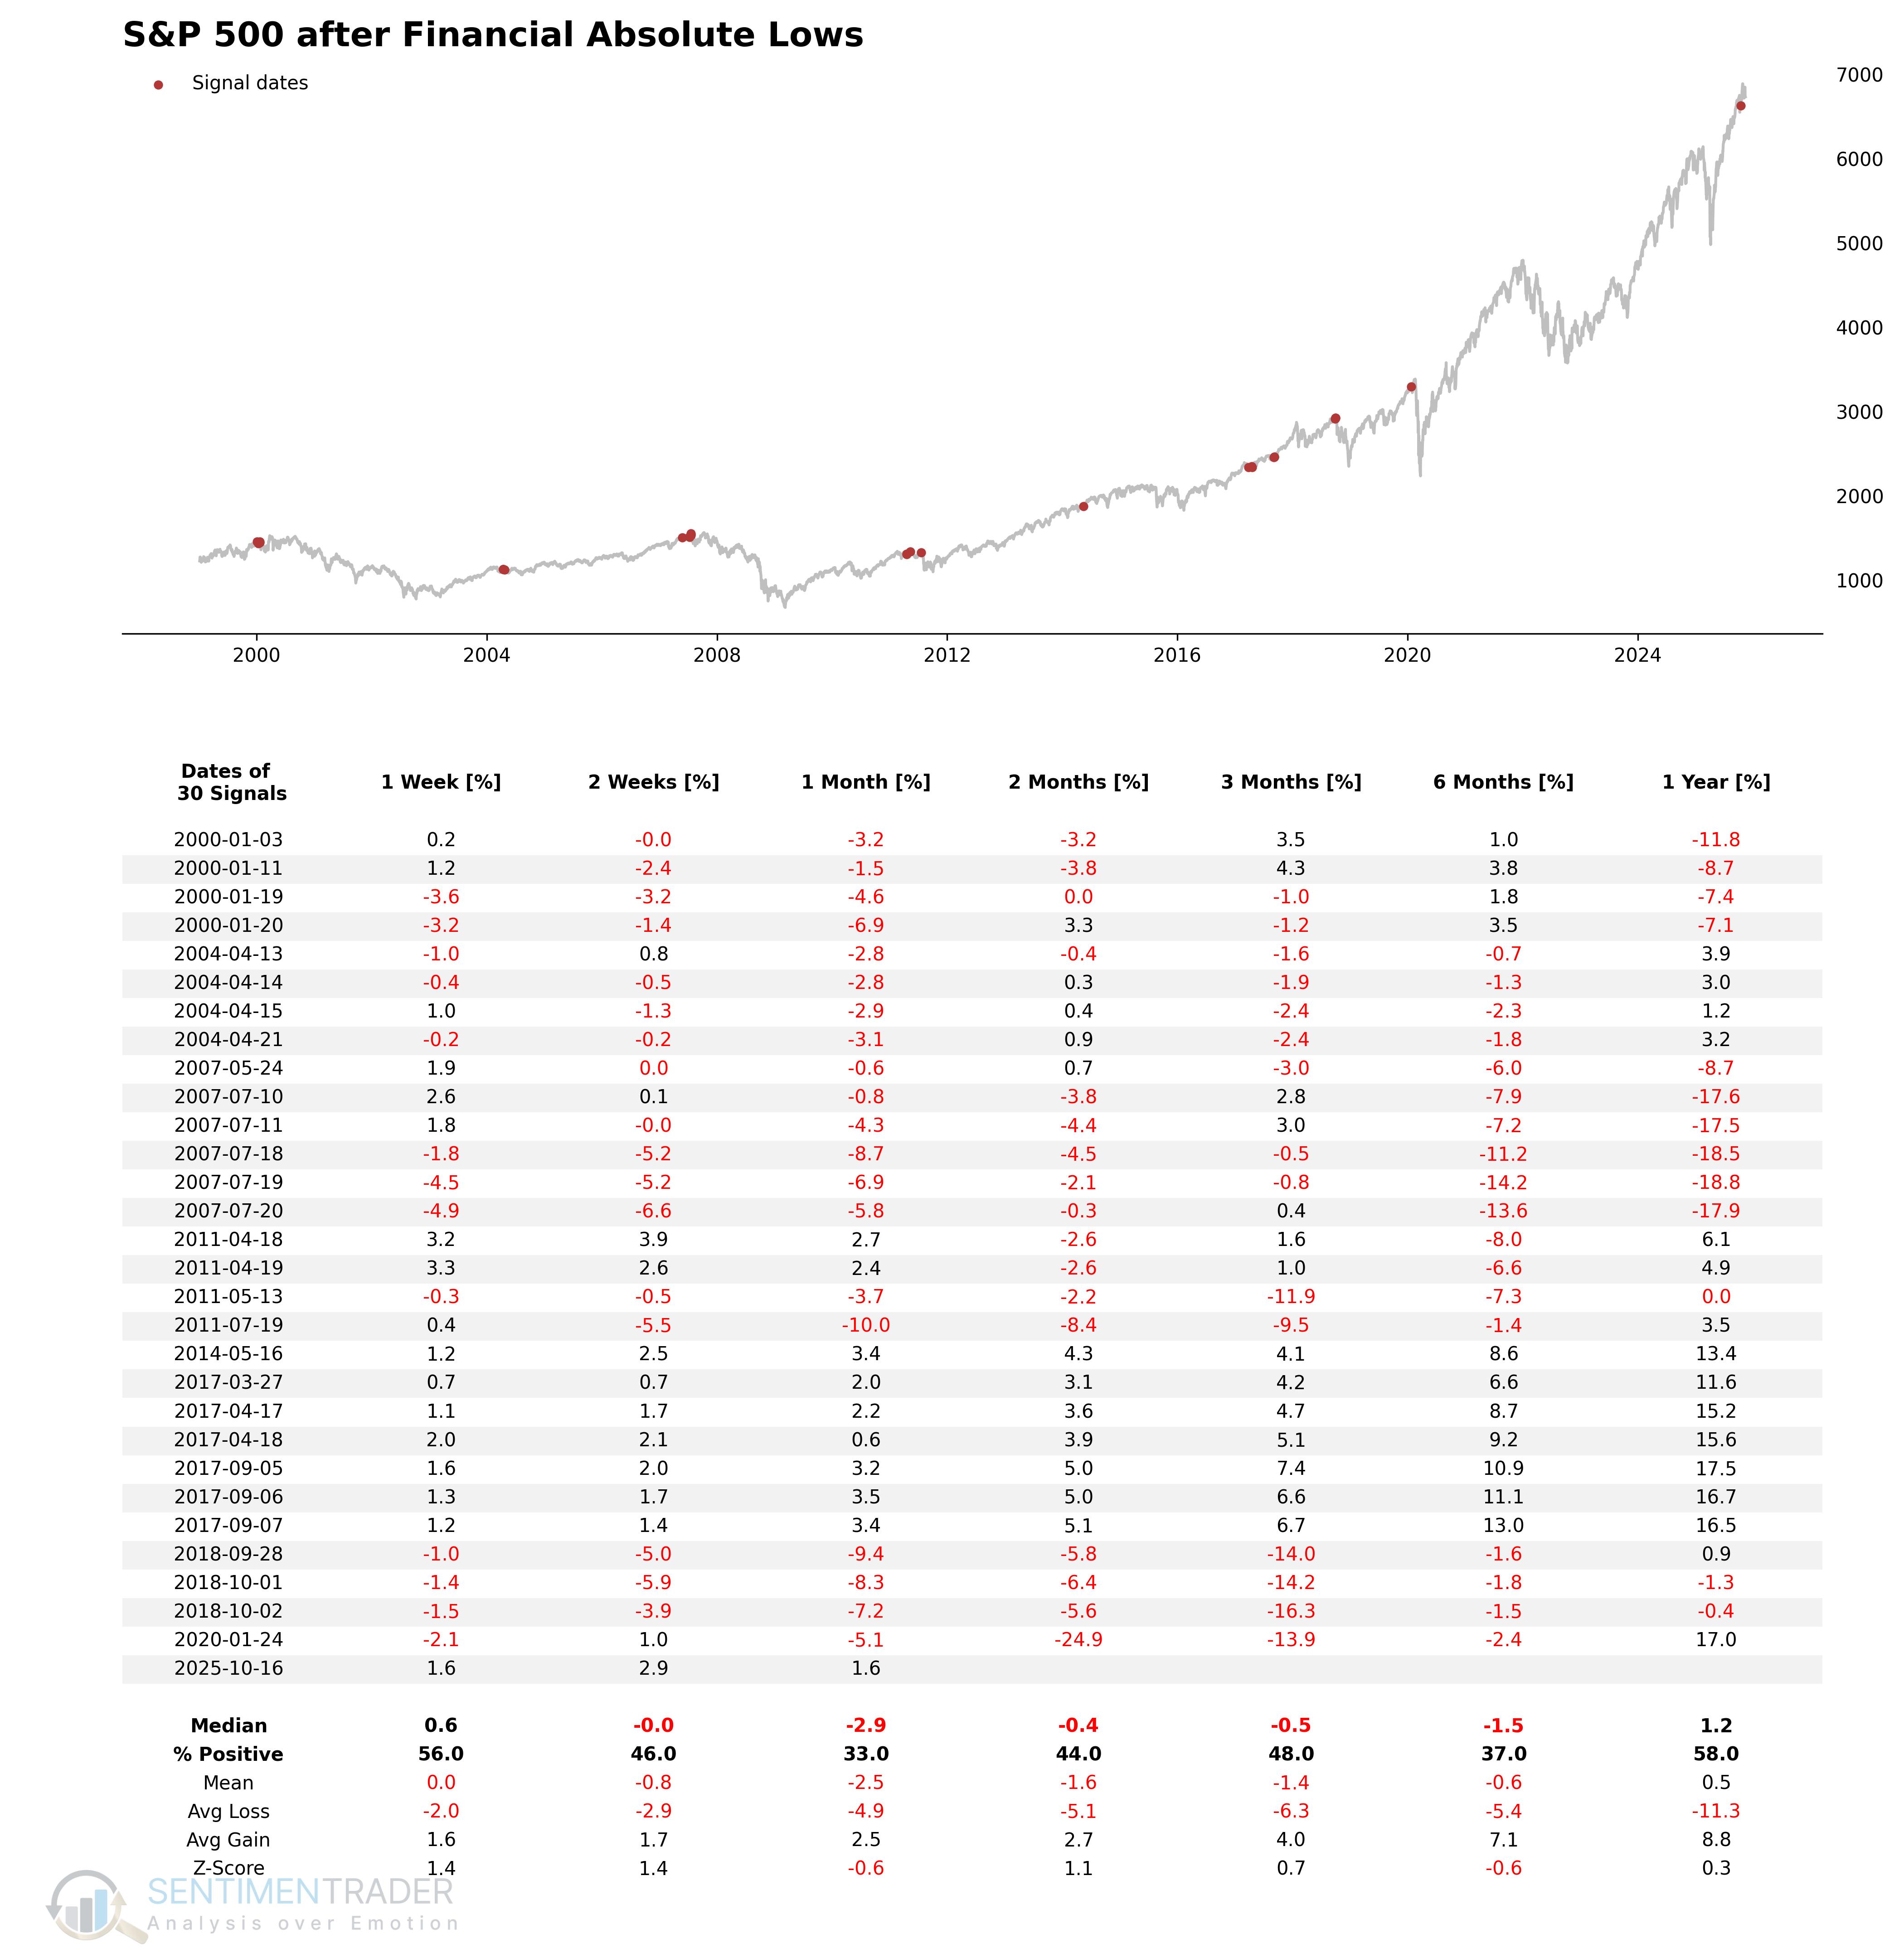
Signal Performance
As can be seen, performance has been weak across all time periods.
The Important Cyclical Groups Divergence Model combines Financials with several other economically sensitive groups. The premise is that a healthy economy and bull market should see a favorable trend in a composite of these important cyclical groups. This does not mean they must lead the market, but we do not want to see a significant divergence from the overall market uptrend.
Indicator Construction
This indicator measures the average percentage that each of the following groups is below its 252-day high: Autos, Transports, Homebuilders, Consumer Discretionary (Equal Wt), Financials (Equal Wt), Industrials (Equal Wt), and Small Caps. All groups are weighted equally.
Signal Criteria #1
- Condition 1 = The composite indicator crosses above -3% (i.e., a reset).
- Condition 2 = The 1-month linear regression trend of the composite is negative.
- Condition 3 = The 4-month linear regression trend of the composite is negative.
- Condition 4 = S&P 500 is <= 3.0% from its 252-day high.
- Condition 5 = The composite indicator crosses below -6%.
- If Conditions 1-5 are met, a risk-off signal is issued.
Signal Criteria #2
- Condition 1 = S&P 500 closes at a 252-day high.
- Condition 2 = The 2-month linear regression trend of the composite is negative.
- Condition 3 = The composite indicator is down >= -28%.
- If Conditions 1-3 are met, a risk-off signal is issued.
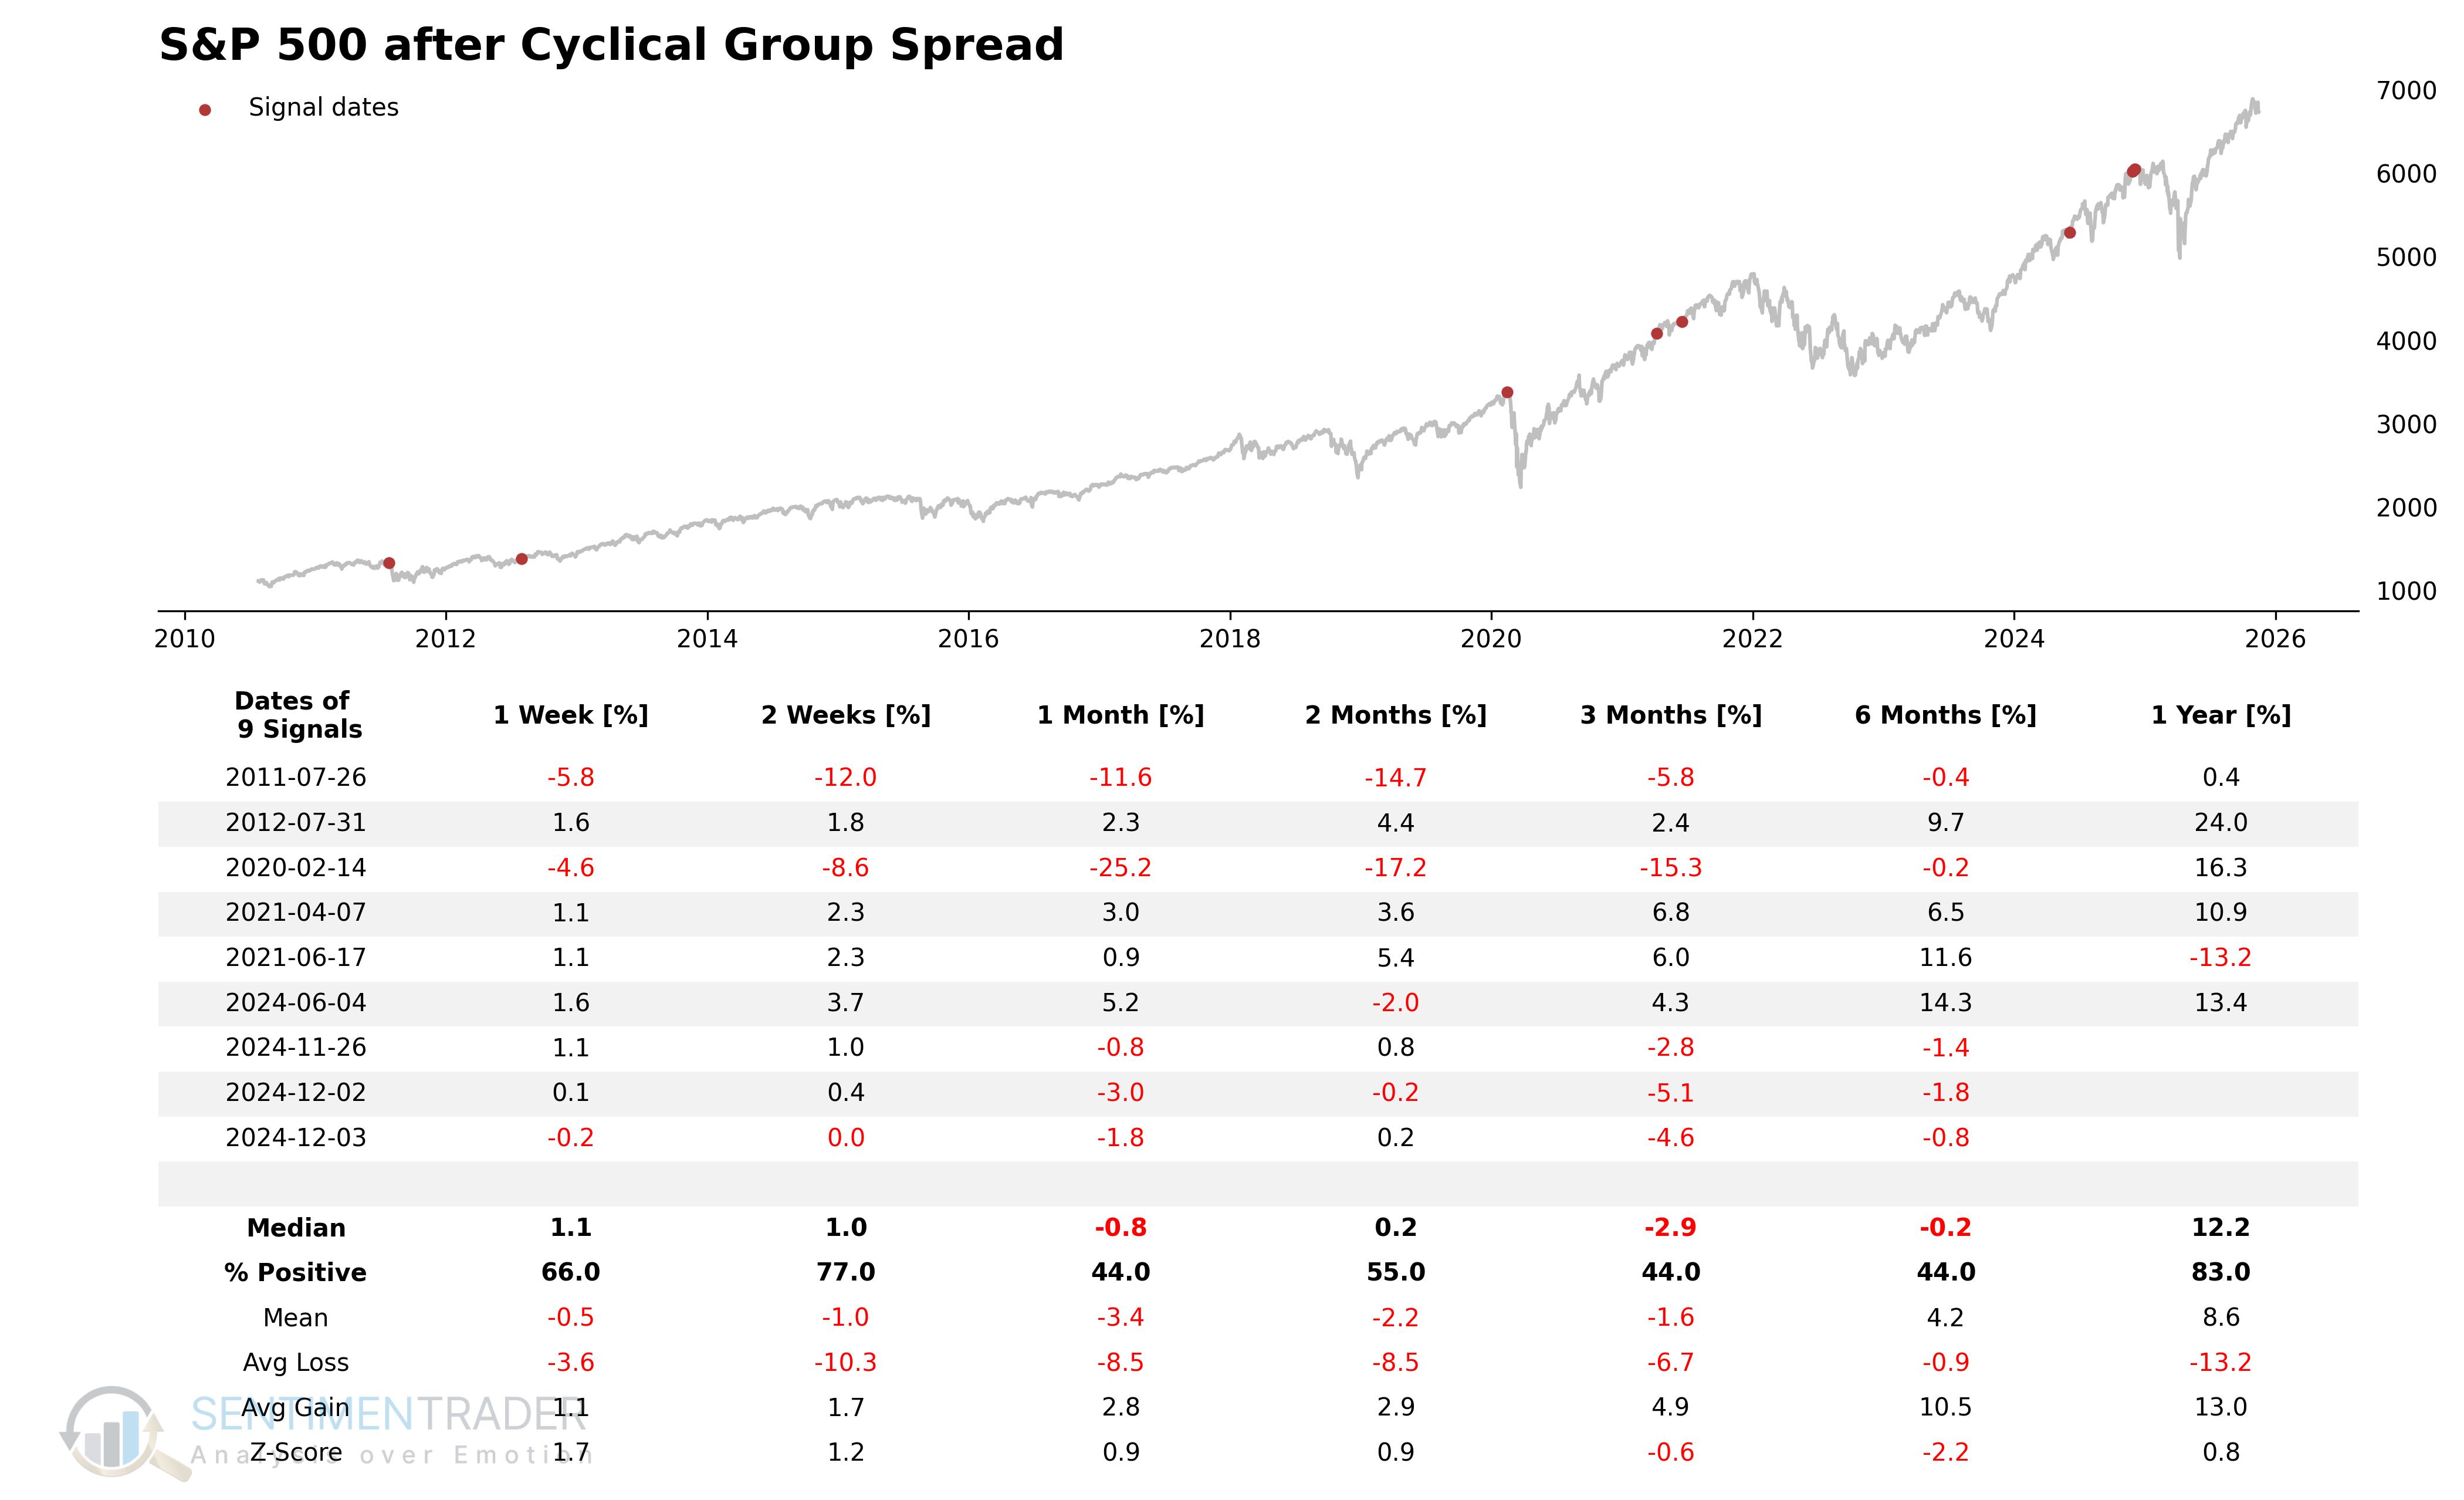
Current Day Chart
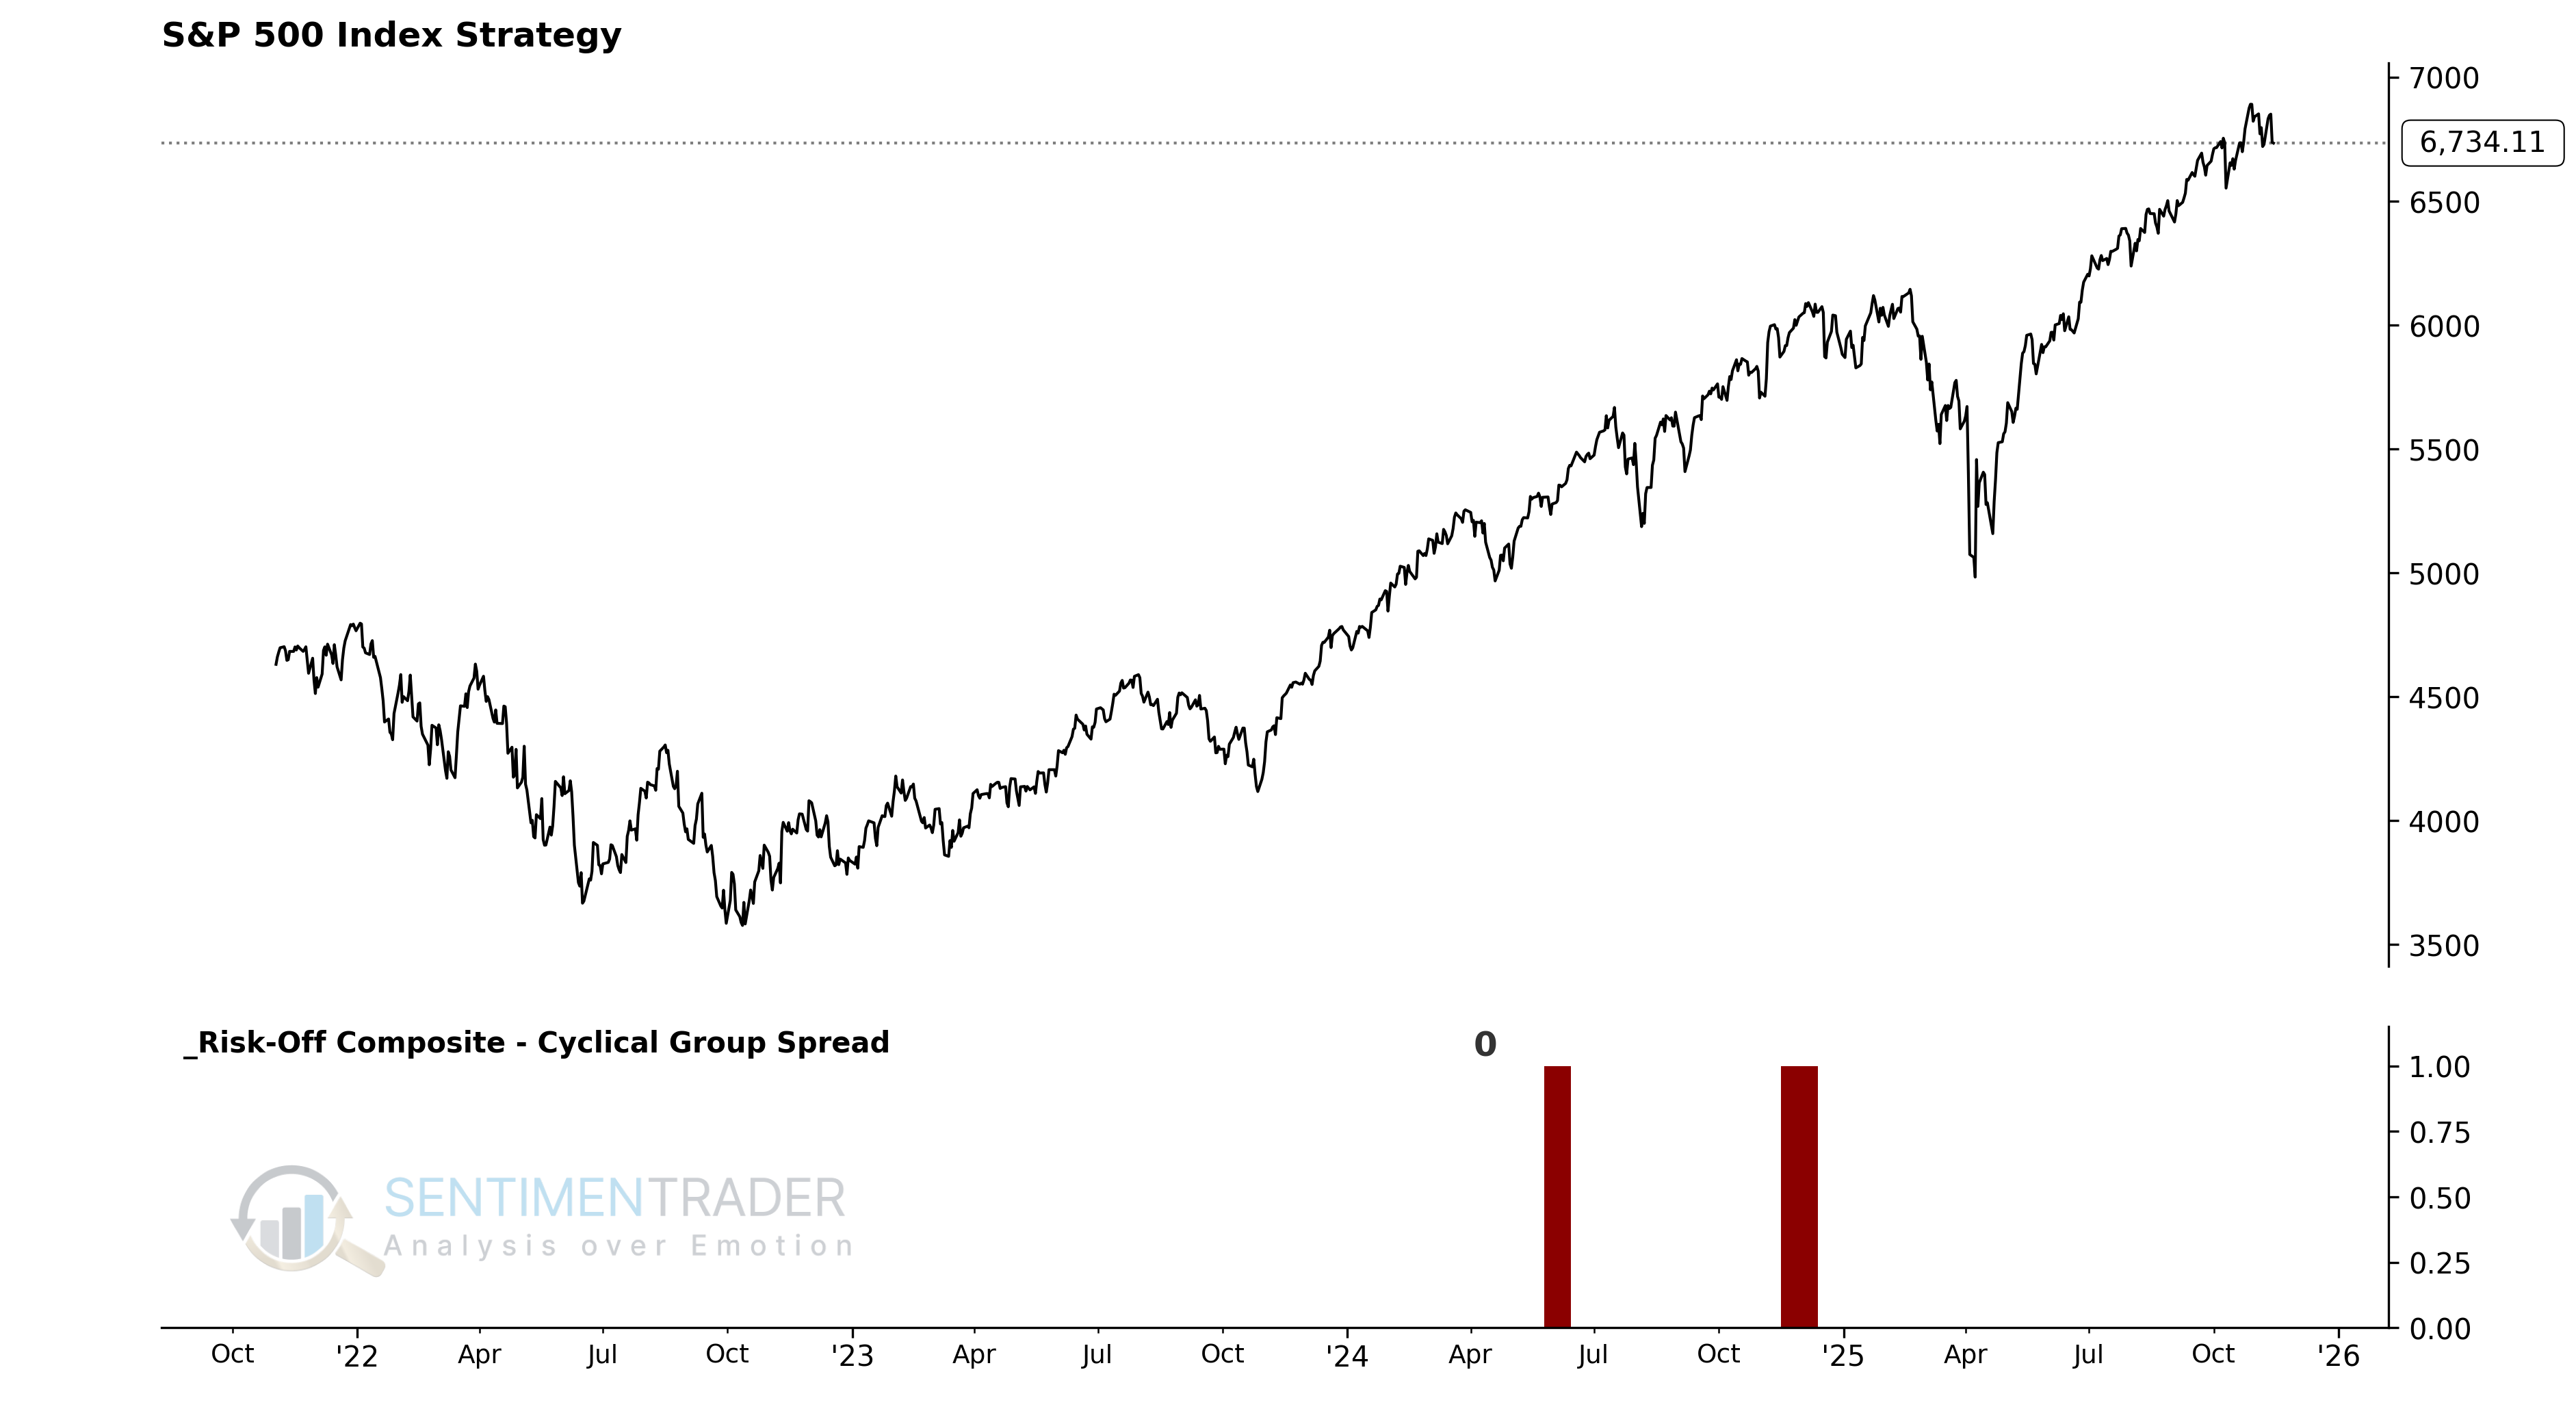
Signal Performance
As the table below shows, there are several unfavorable risk periods in the one to six-month time frame.
Bullish market sentiment is normally highly correlated with price, as investors believe the market will continue to head higher. Therefore, in most cases, bullish sentiment is a prerequisite for a potential trend change, acting as an early warning before most other indicators. It is essential to pay close attention when sentiment reverses from an extreme state.
Signal Criteria
- Condition 1 = The Sentiment Composite (AIM (Advisor and Investor Model), NAAIM, AAII Bears, AAII Bulls, and Equity Put Call Ratio) exceeds 89%.
- Condition 2 = The Composite then declines by 1.75% from its prior high (which was >89%).
- If Conditions 1 and 2 are met, a risk-off signal is issued.
Current Day Chart
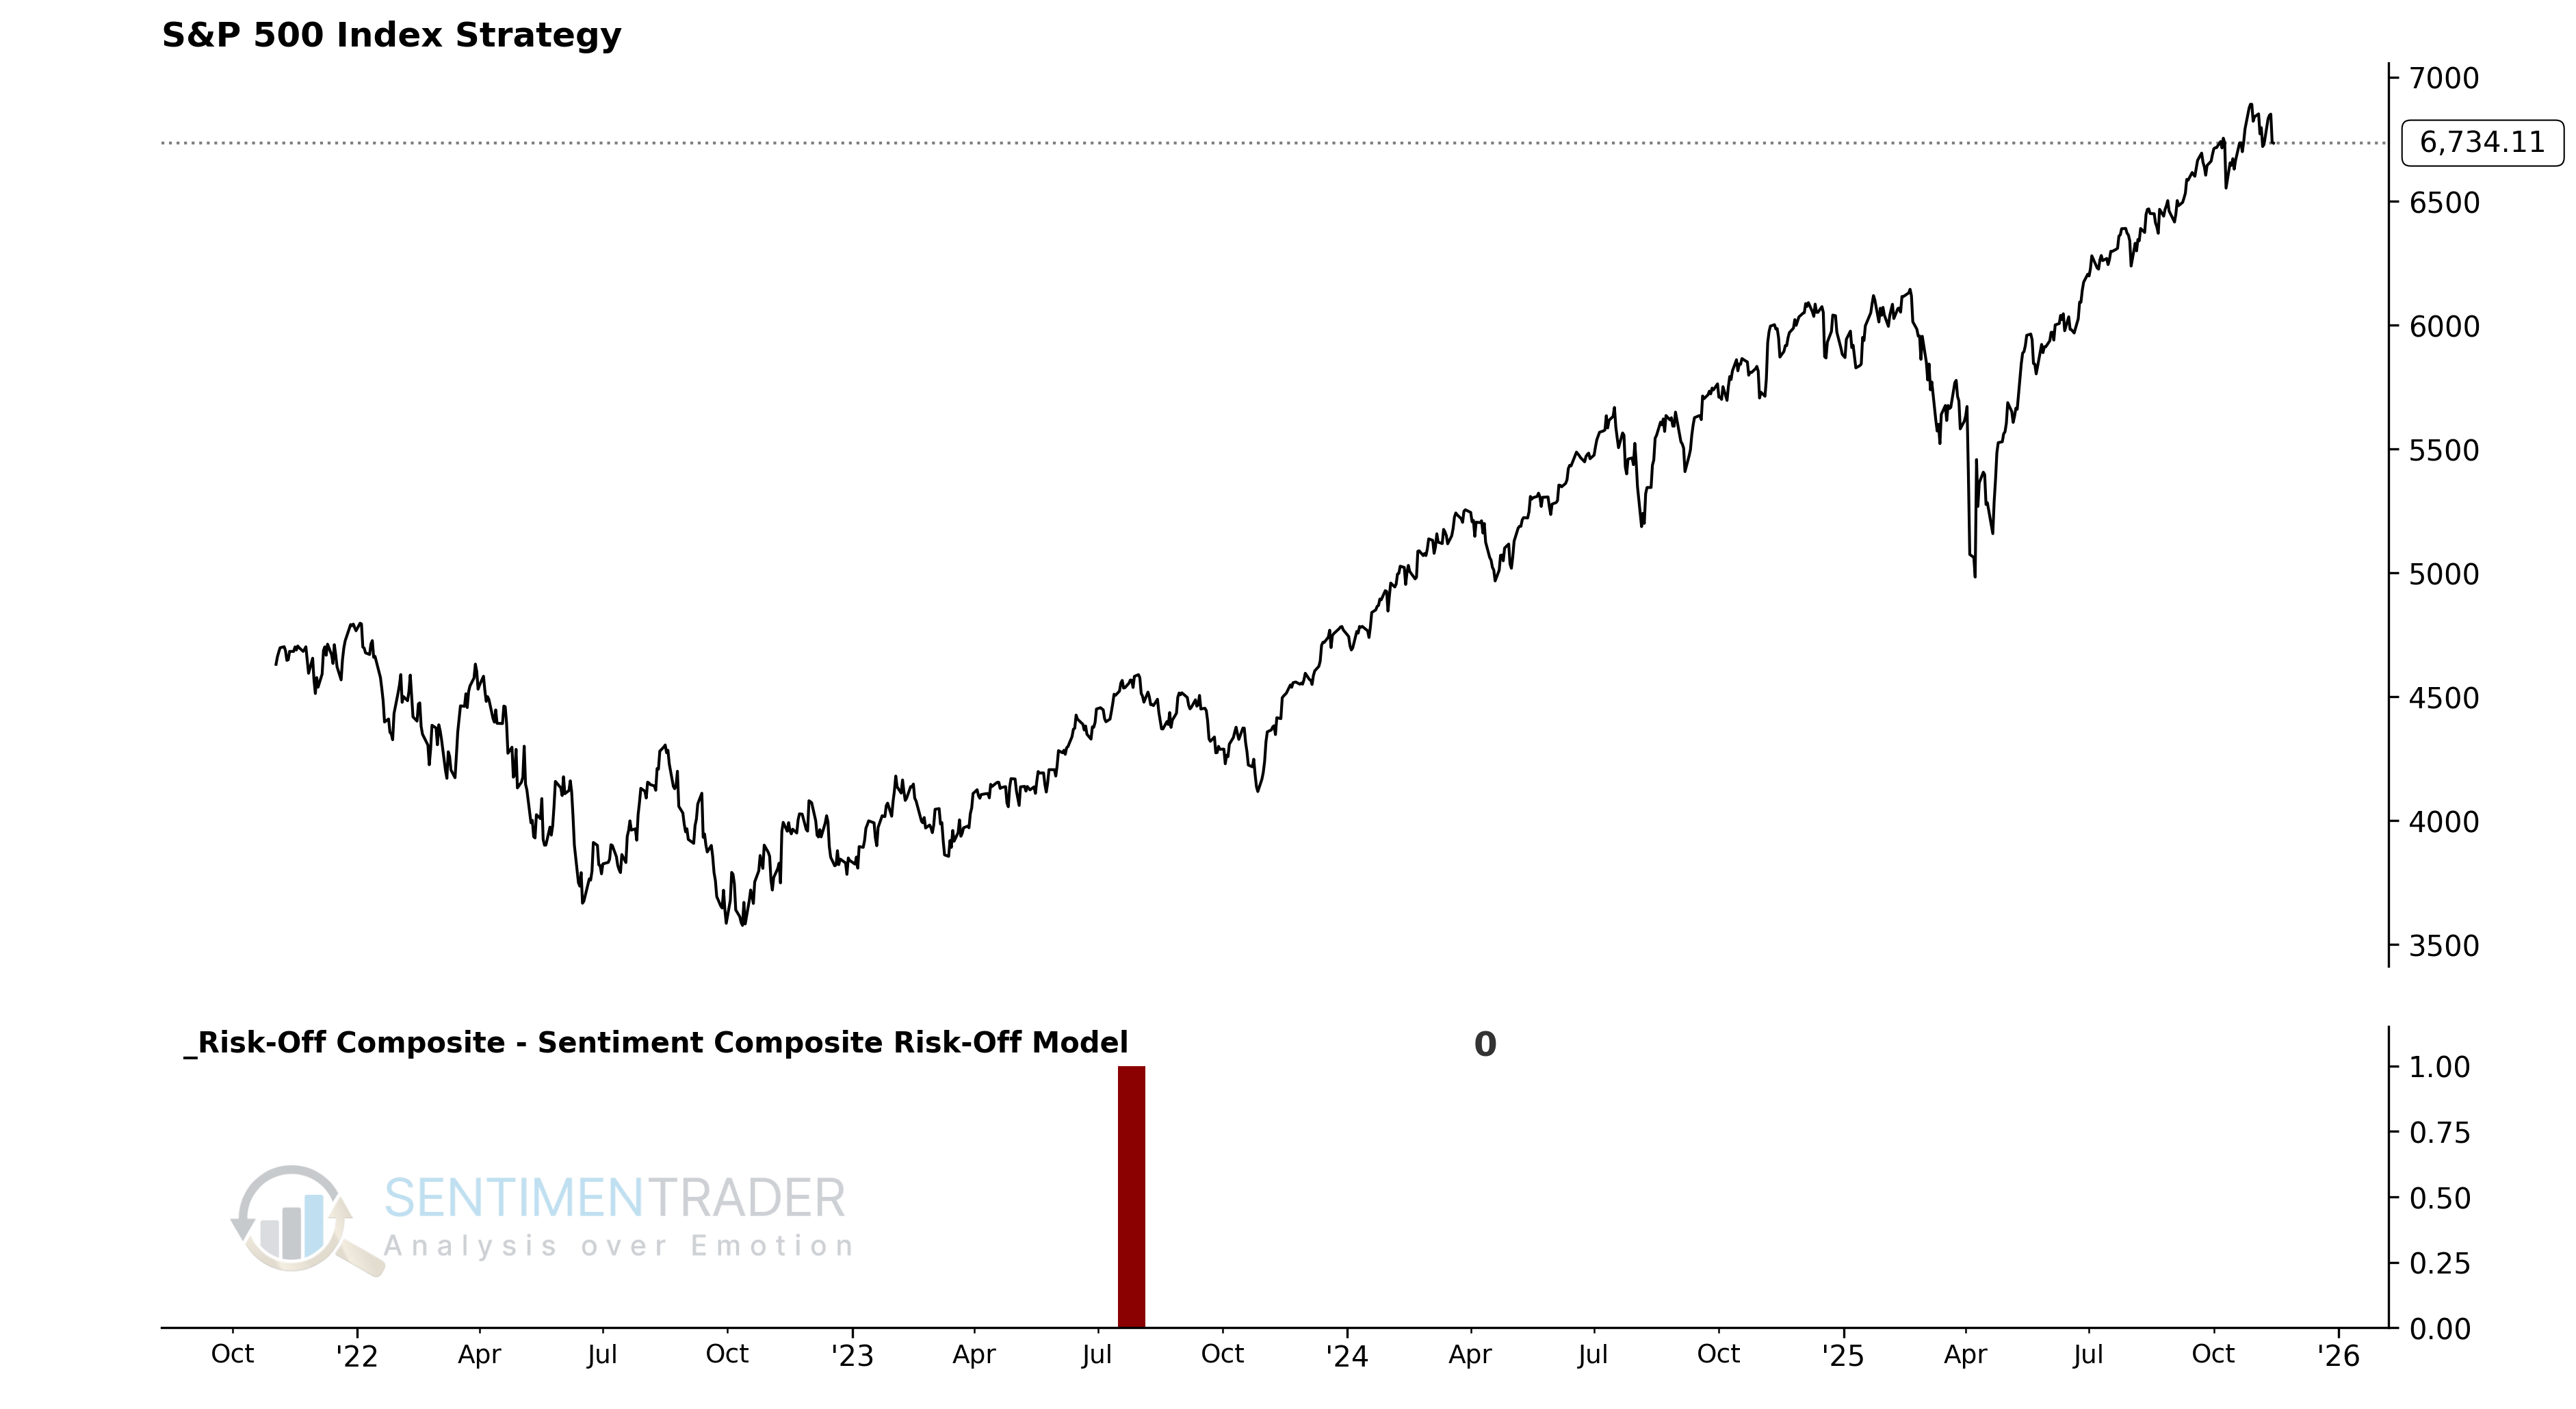
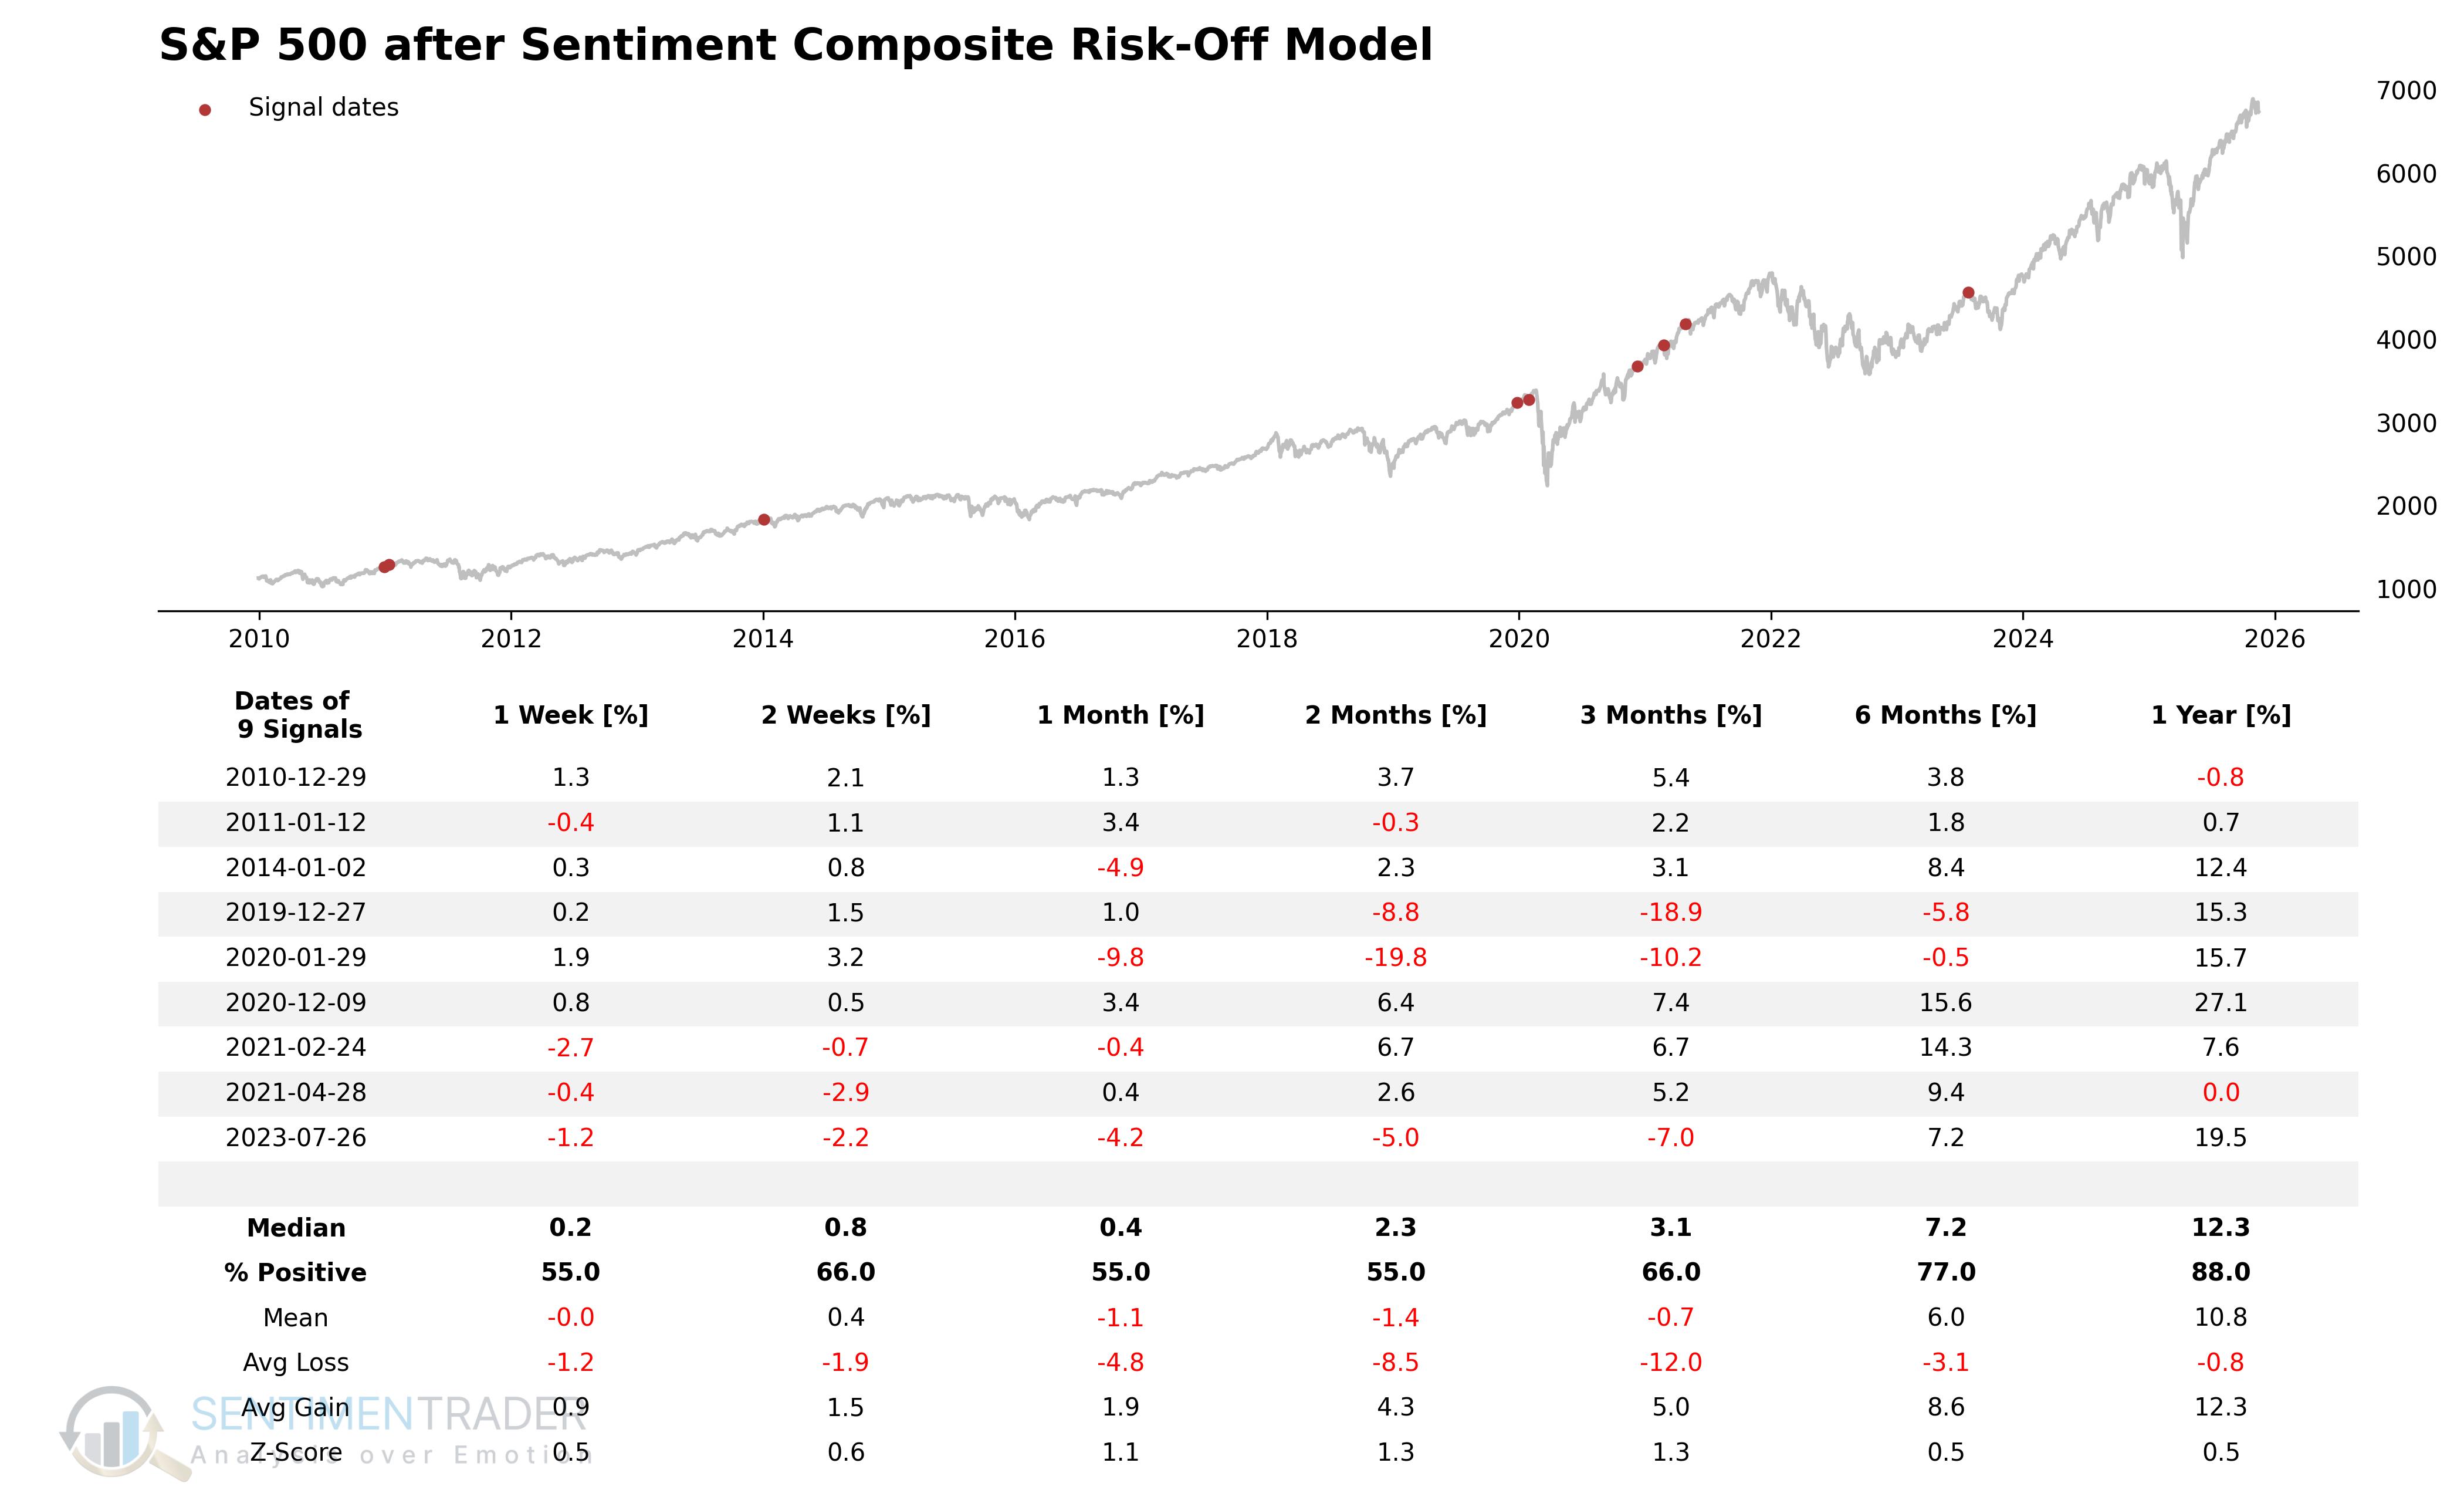
Signal Performance
The signal has shown weak performance in the 1 to 8-week time frame.
What the research tells us...
The TCTM Risk-Warning Model is a 'weight-of-the-evidence' tool designed to quantify underlying market fragility. This report has deconstructed six of the ten components that make up this composite model, focusing on S&P 500 internals, Financial sector weakness, cyclical divergences, and broad sentiment.
As the individual performance tables demonstrate, each component is designed to identify a specific, historically unfavorable condition. Indicators like the High-Low Logic Index, Financials Relative Strength, and Cyclical Group Spread are all tools to spot an unhealthy, fractured market. The historical data for these individual signals, which tend to precede periods of weak or subpar returns, illustrates the logic of the composite model: by combining these small, individual warnings, the TCTM Risk-Warning Model aims to build a comprehensive, data-driven case for when overall market risk is elevated.