
A Deep-Dive Into the Sentimentrader's New TCTM Risk-Warning Model - Part I

Key points
- This report introduces the new TCTM Risk-Warning Model, a key component of our broader Tactical Composite Trend Model.
- The model uses a weight-of-the-evidence approach, combining 10 algorithms designed to spot declining participation and excessive optimism.
- Historically, weak internal trends and high optimism often serve as early warning signs of a potential trend change.
- This report (Part I) deconstructs the logic and historical performance of the first four "risk-off" components.
The Risk-Warning Model Components
Identifying the primary market trend is one of the most critical tasks for any trader or investor. The Tactical Composite Trend Model (TCTM) is the culmination of decades of professional trading and financial market research, designed to aid in this process. The TCTM utilizes a weight-of-the-evidence approach, combining seven key time-tested components to identify major market turning points. This report will focus on one of those key components: the Sentimentrader's New TCTM (S-TCTM) Risk-Warning Model.
The Risk-Warning Model contains ten algorithms designed to identify historical instances of declining market participation and excessive optimism. Historically, weak internal trends and overly optimistic sentiment often act as early warning signals for a potential trend change. In this new TCTM Risk-Warning Model, we have adjusted and optimized these component algorithms, which we will introduce in the following sections.
Component Descriptions
- New 52-Week High-Low Ratio
- 52-Week Lows with Percent above 200-Day
- High-Low Logic NYSE with Spike
- Advance-Decline Line Divergence
- New Low Spike S&P 500
- High-Low Logic S&P 500 with Spike
- Financials Relative Strength
- Financials Absolute Lows
- Cyclical Sector Spreads
- Sentiment Composite
Risk-Warning Model Signal Criteria
- Condition 1 = Composite Signal Count >= 30%.
- Condition 2 = If Condition 1 is met, begin counting days from the true count.
- Condition 3 = If Days Since True Count <= 20, AND the 5-day Rate of Change for the S&P 500 is -1% or higher, a risk-off signal is issued.
- Condition 4 = The composite count resets below 20%. This reset filters out repetitive signals.
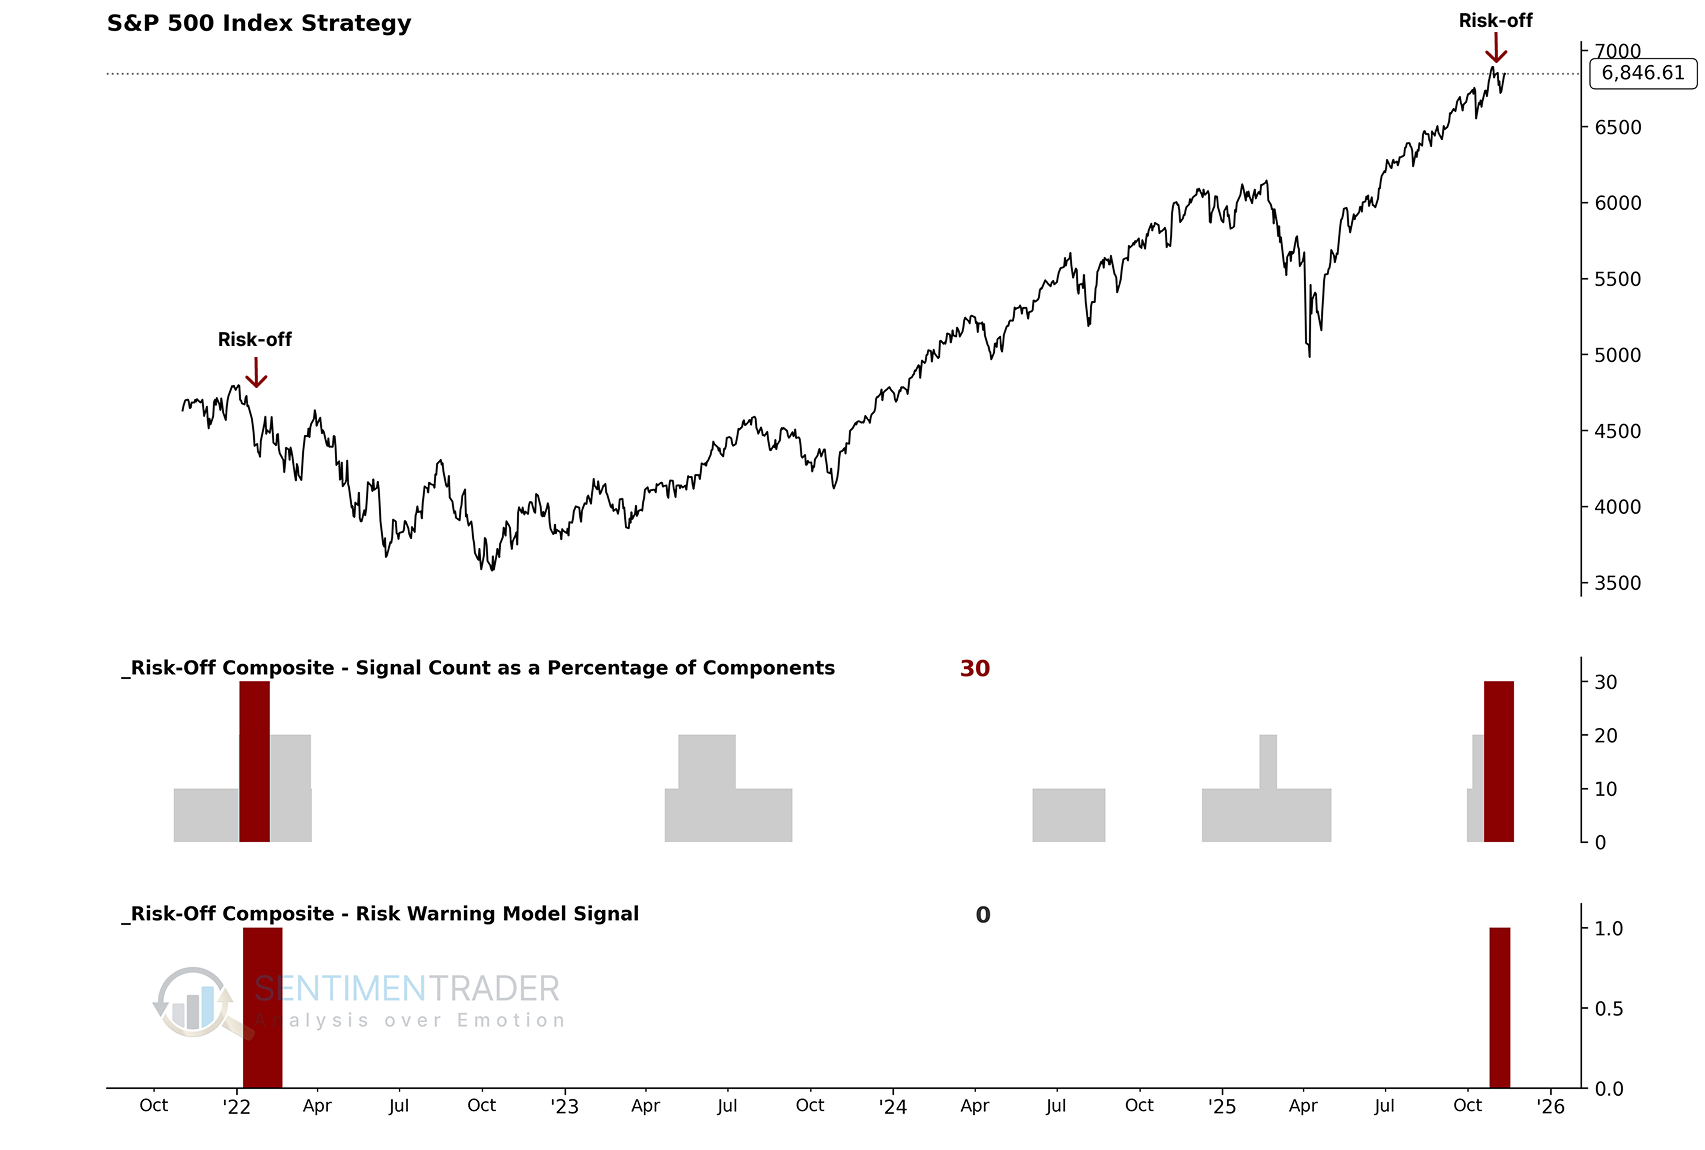
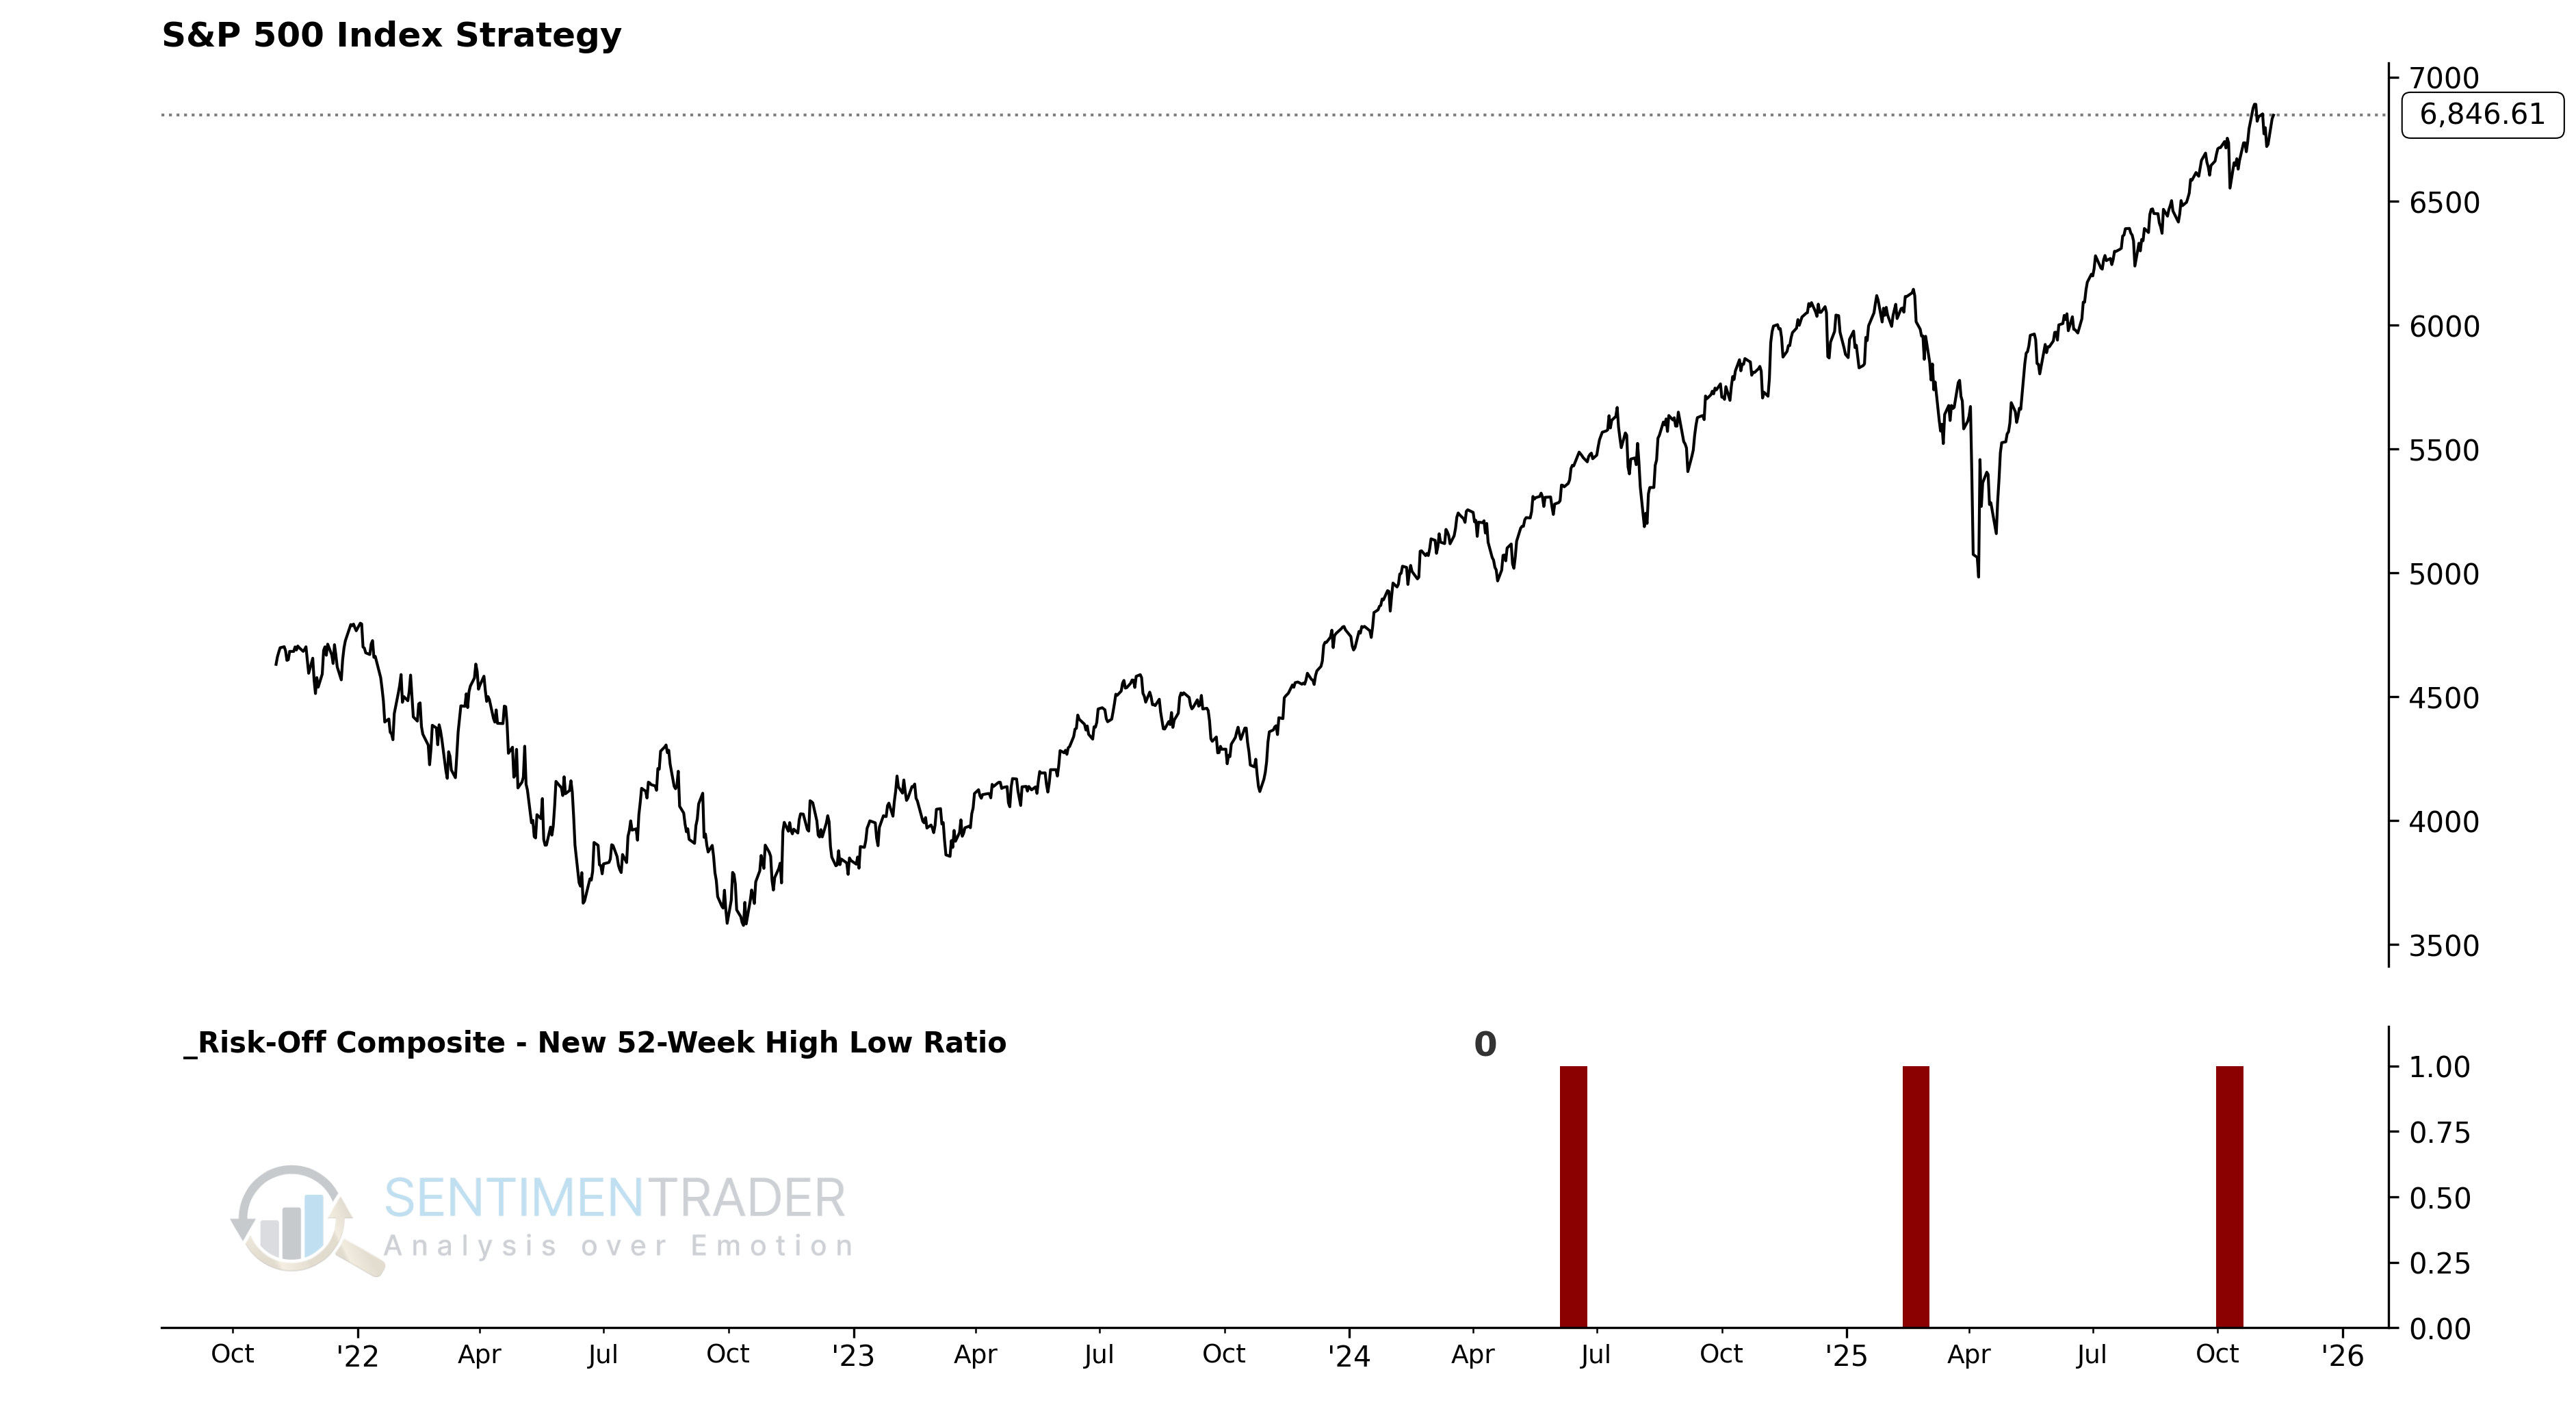
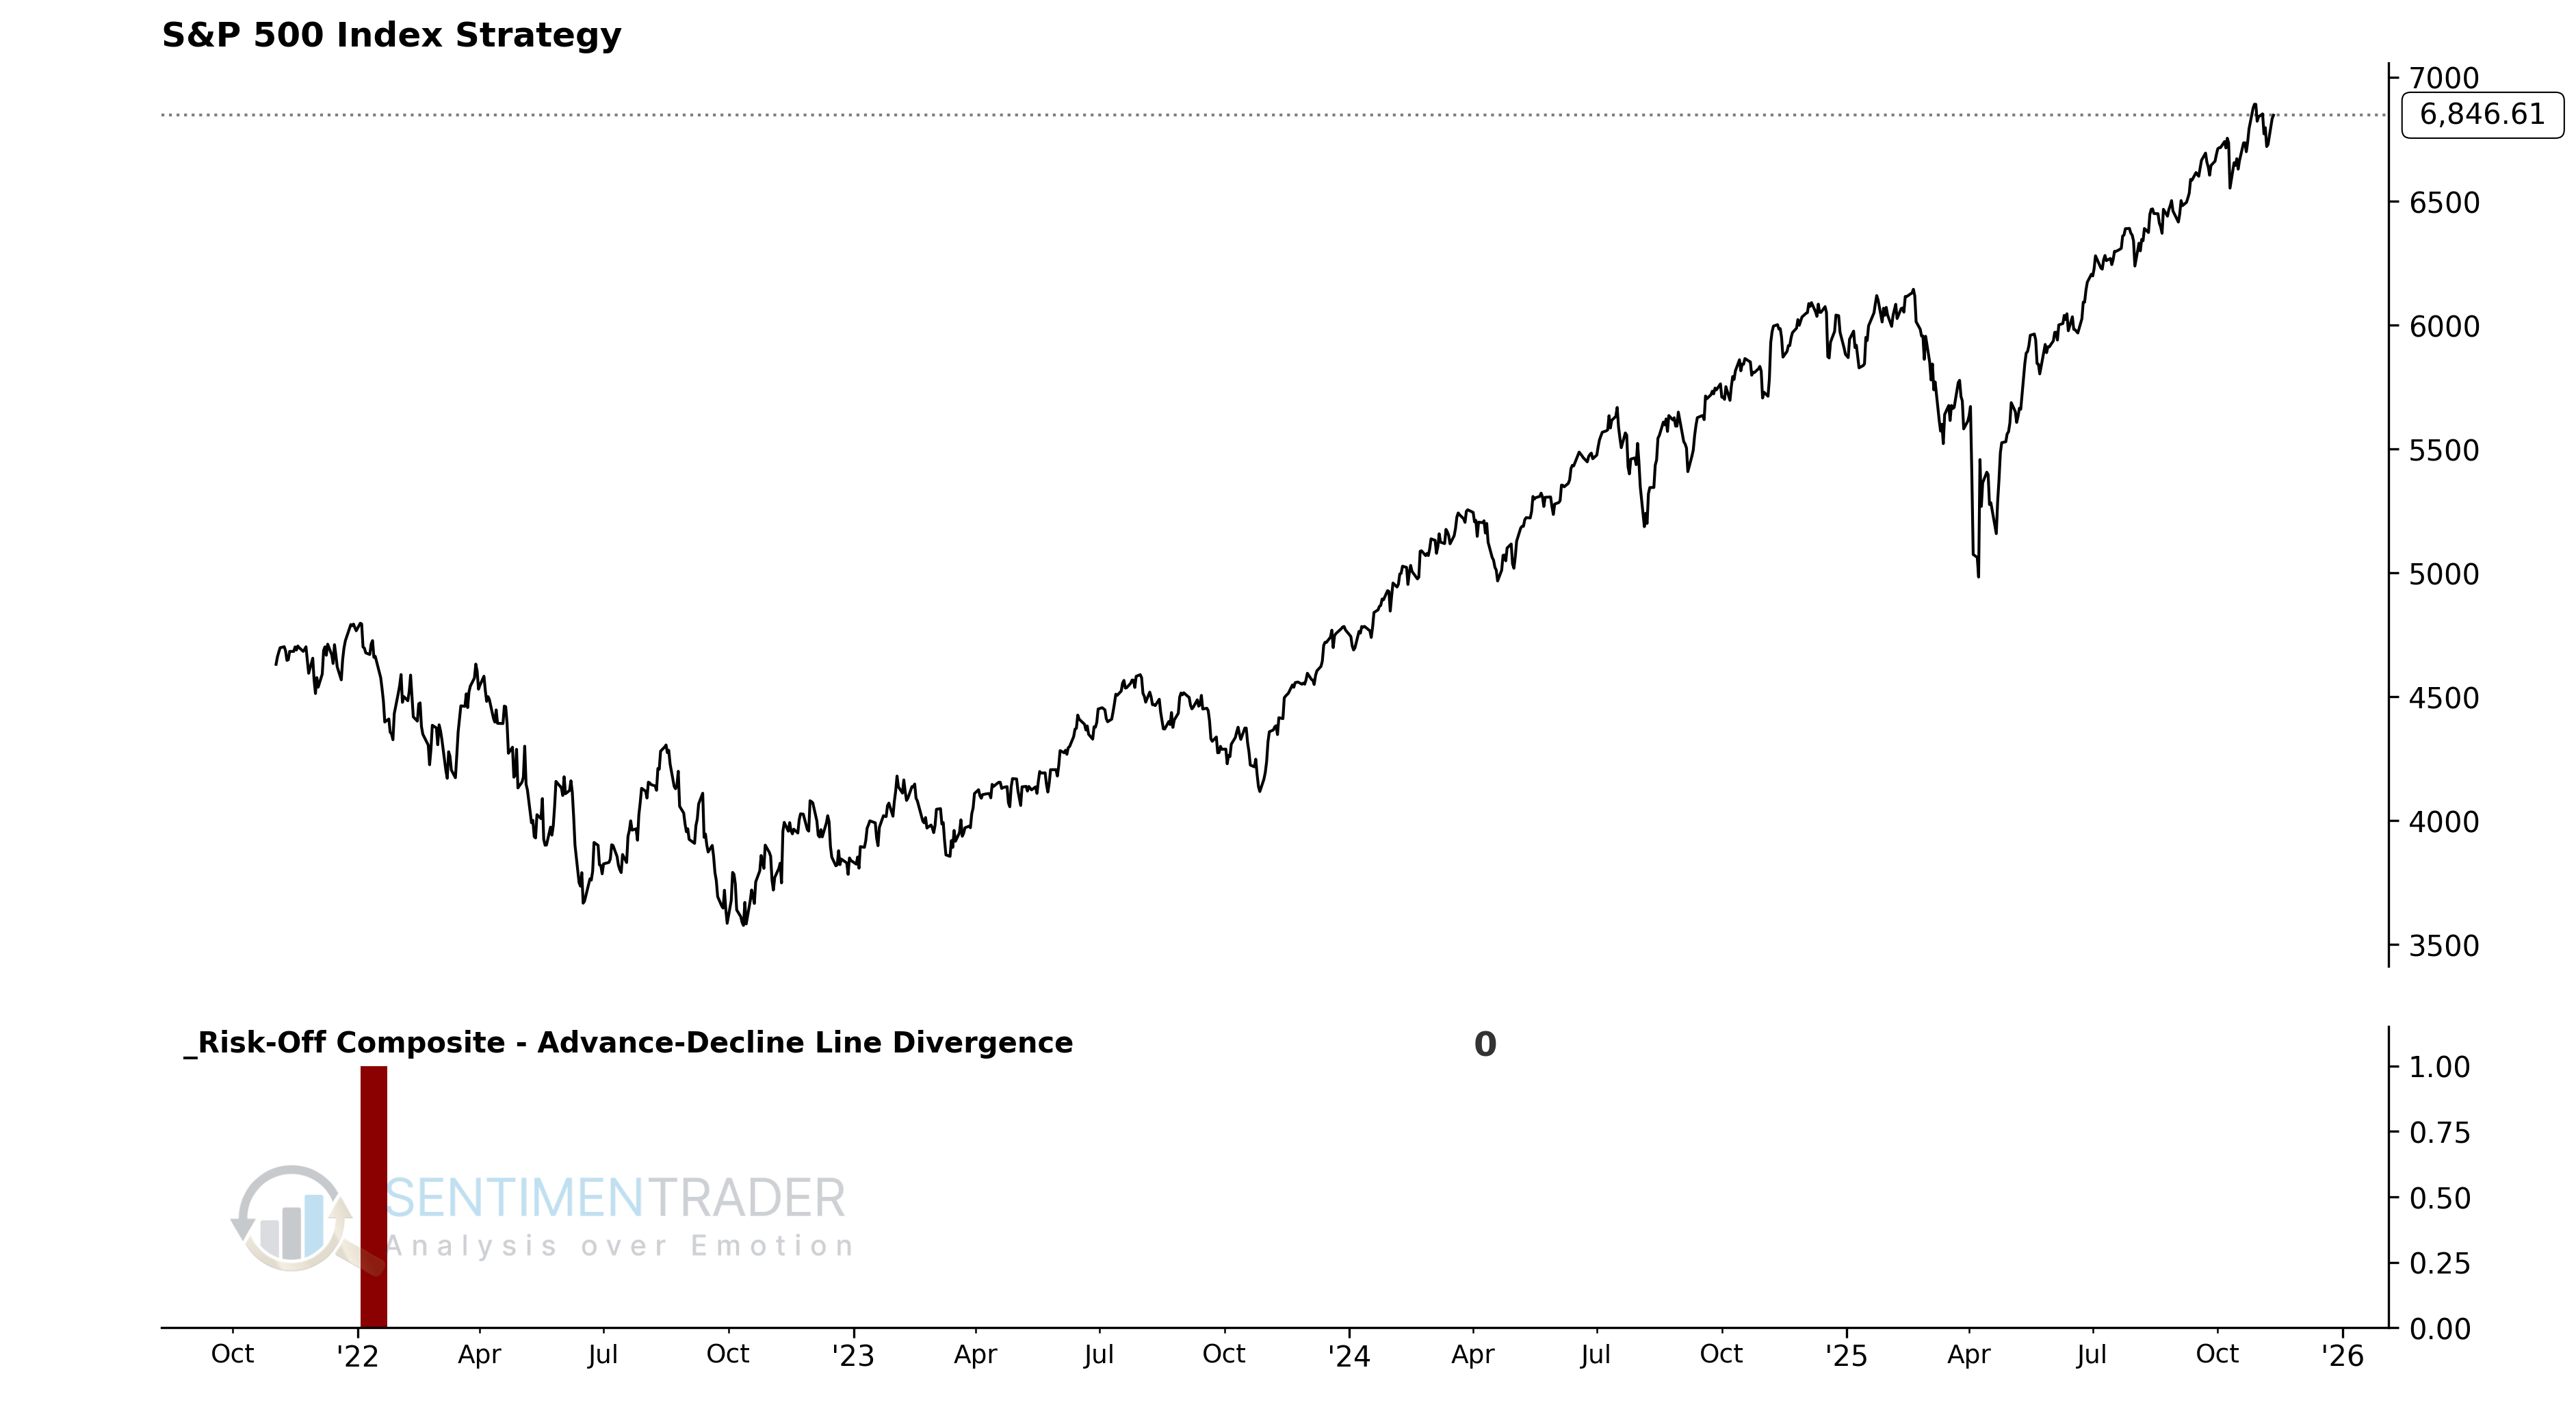
As the chart below illustrates, these individual components are combined into a single composite indicator-the Risk-Warning Model-which uses a 0 or 1 value to issue alerts. The most recent signal was issued on Nov 4, 2025. Currently, the model shows a reading of 0, indicating no warning signal is active.
Utilizing the S-TCTM Risk Warning Model
We can define the market environment as "favorable" or "unfavorable" based on the model's interpretation, without subjective interpretation. In other words:
- When the risk warning model goes from 0 to 1, the dominant trend is considered unfavorable for the stock.
With this framework, we can build a systematic trend-following strategy and see how this approach performs historically.
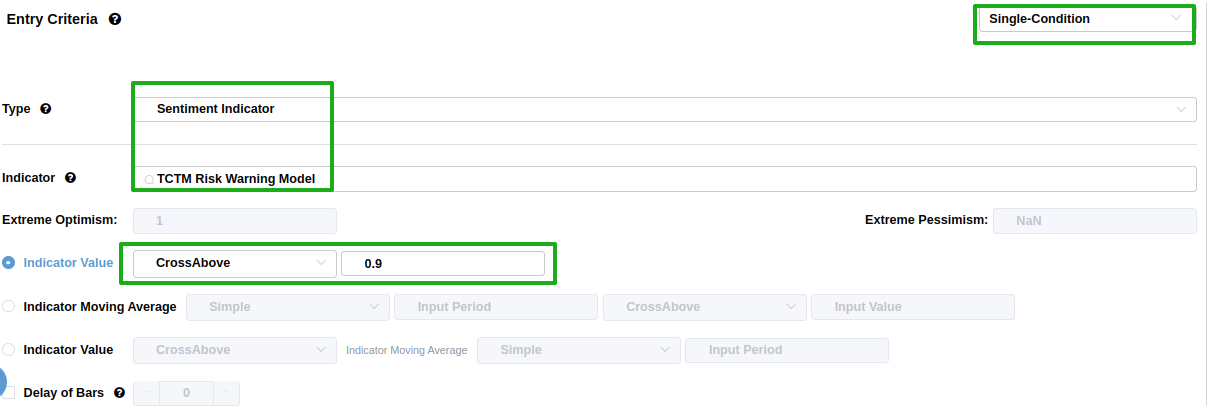
Using the BacktestEdge engine, we can set entry and exit criteria to track the model's signals. The setup process is very simple:
When the S-TCTM Risk Warning model goes from 0 to 1, i.e., we set the entry criteria and establish a long position when the trend is unfavorable. For related backtest, click here.
Exits we can skip without setting, as we are more interested in the performance of the signal after it is issued.
As shown in the figure, performance was weak over the 1-6 month timeframe. The mean return was entirely negative.
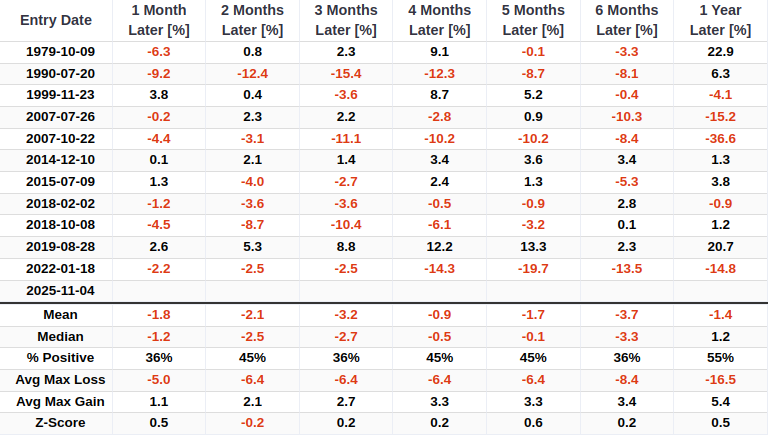
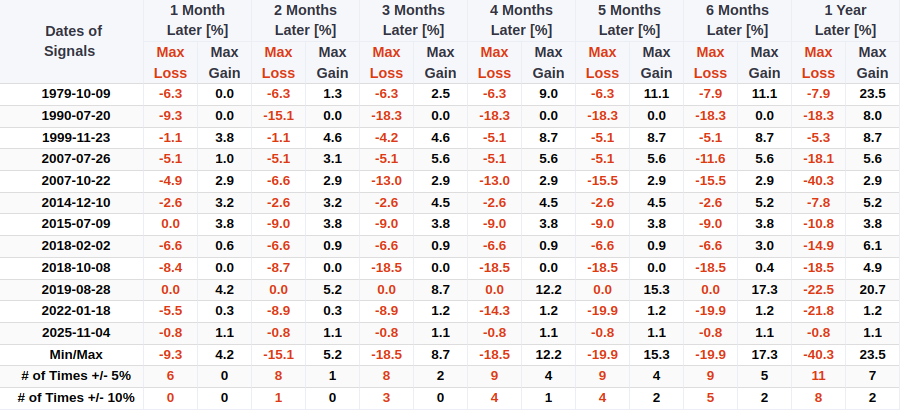
The absolute value of the maximum loss during each cycle far exceeds the maximum profit, with extreme losses significantly outpacing extreme gains. Moreover, risk continues to escalate throughout the holding period.
Component Deep Dive
New 52-Week High-Low Ratio
The New 52-Week High-Low Ratio model utilizes NYSE 52-week highs and lows to identify risk-off periods.
Signal Criteria
- Condition 1 = NYSE New Lows / New Highs Ratio >= 1.5.
- Condition 2 = S&P 500 is less than 2 days from a 252-day high.
- Condition 3 = The NYSE New Lows / New Highs Ratio crosses above 1.0.
- If Conditions 1-3 are met, a risk-off signal is issued.
Current Day Chart
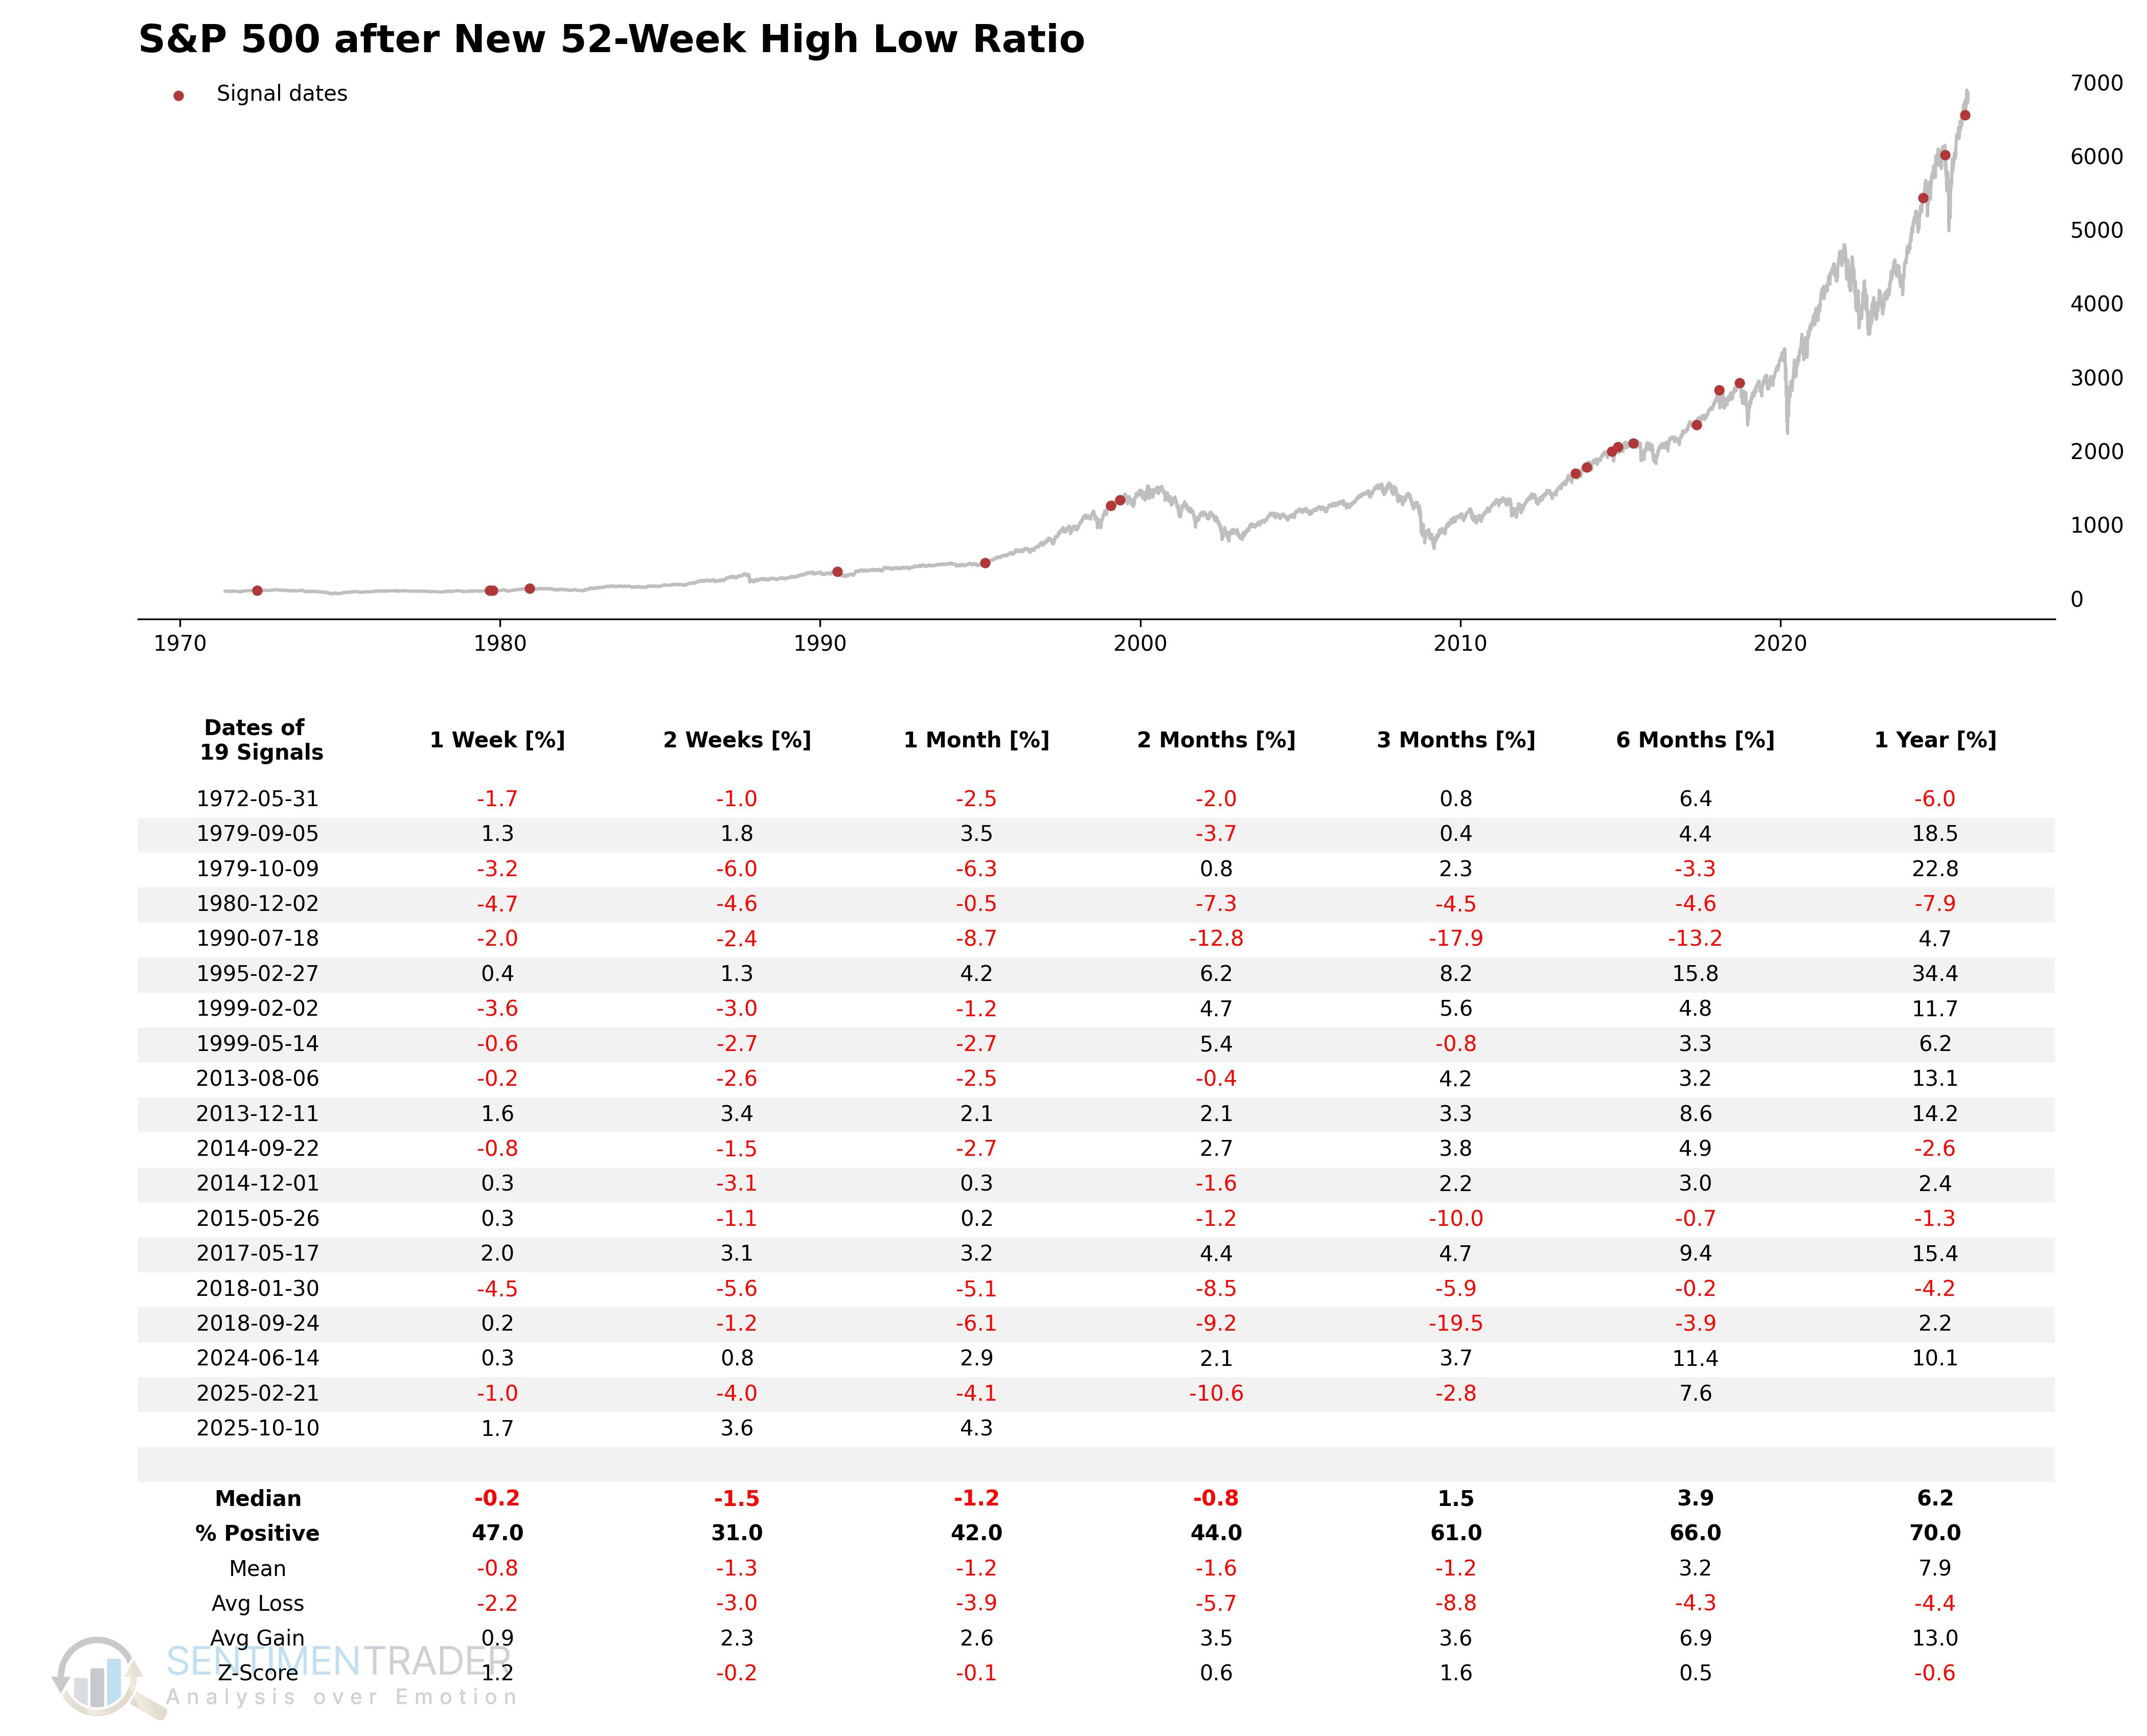
Signal Performance
As seen, performance across all time periods was subpar, with the win rate being particularly weak during the two-week period.
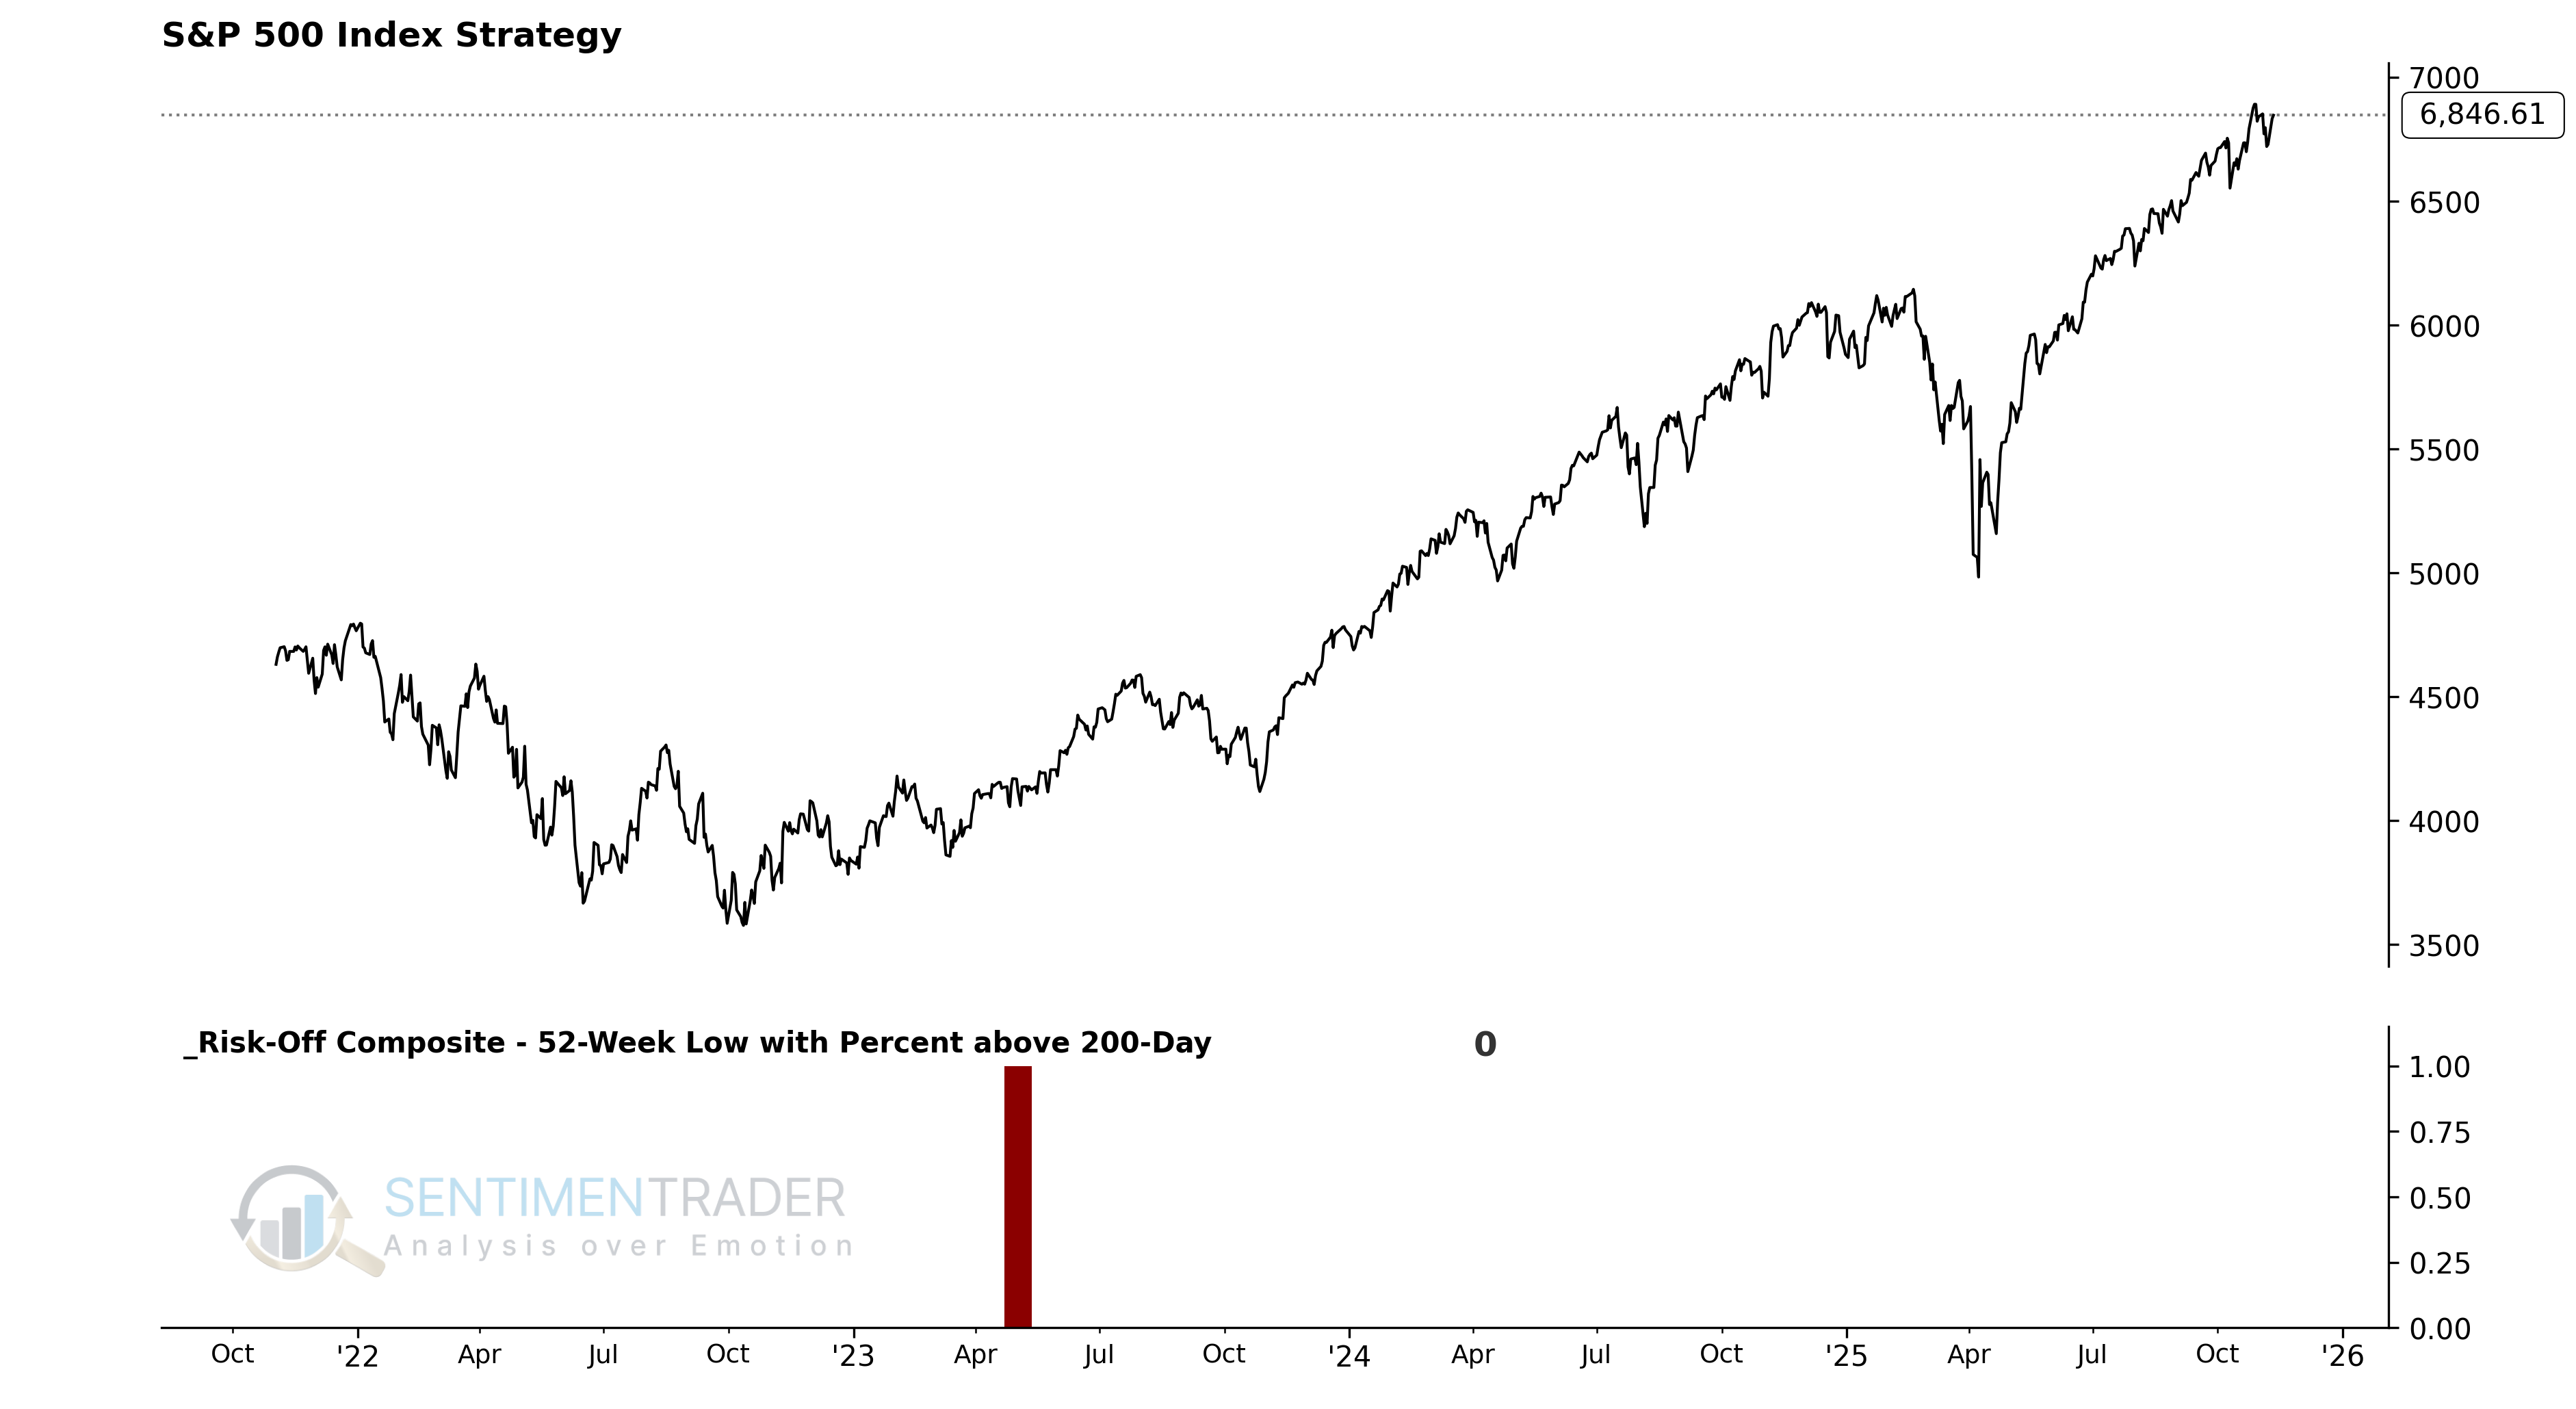
52-Week Lows with Percent above 200-Day
New lows are a critical time series during bull market advances. The model's effectiveness can be further enhanced by incorporating an additional time series with a slightly different cycle.
Signal Criteria
- Condition 1 = Percentage of New Highs (as a % of Highs + Lows) crosses below 21%.
- Condition 2 = Percentage of NYSE Common Stocks above 200-day MA <= 49.75%.
- Condition 3 = S&P 500 is <= 4.5% from its 252-day high.
- Condition 4 = A reset occurs when the percentage of new lows falls below 10%. This reset filters out repetitive signals.
- If Conditions 1-4 are met, a risk-off signal is issued.
Current Day Chart
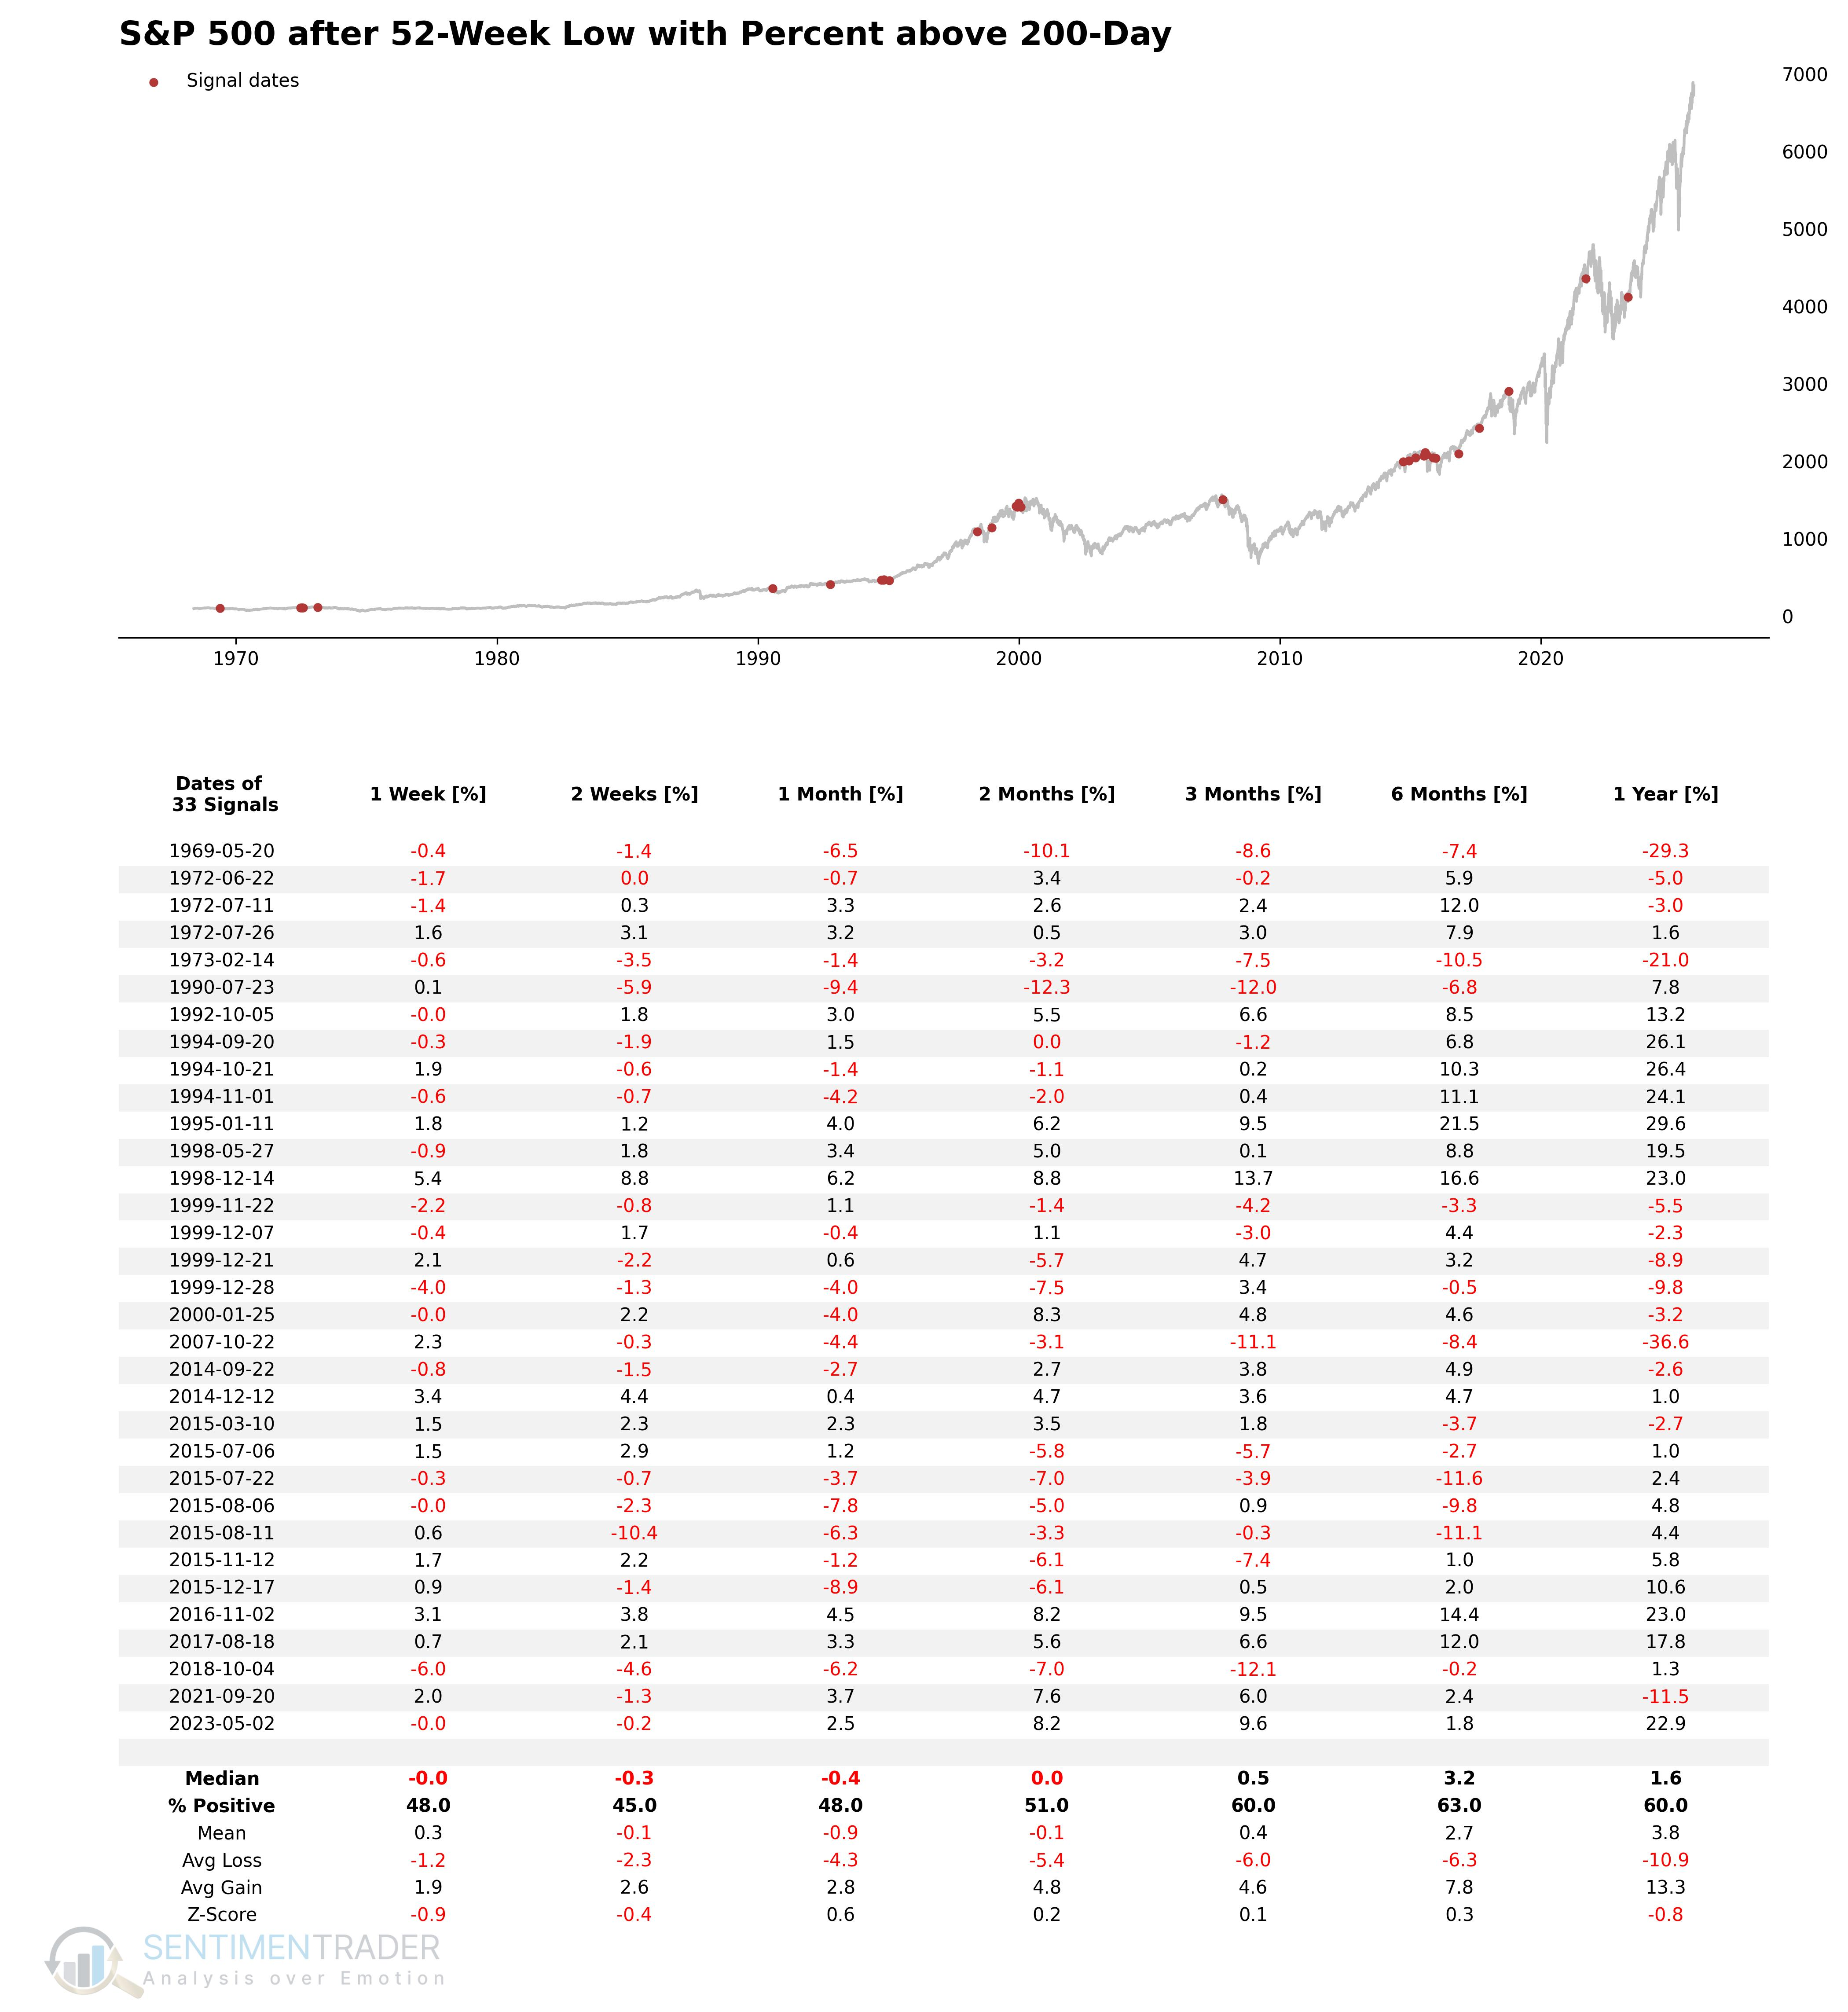
Signal Performance
Signal performance looks weak across several timeframes.
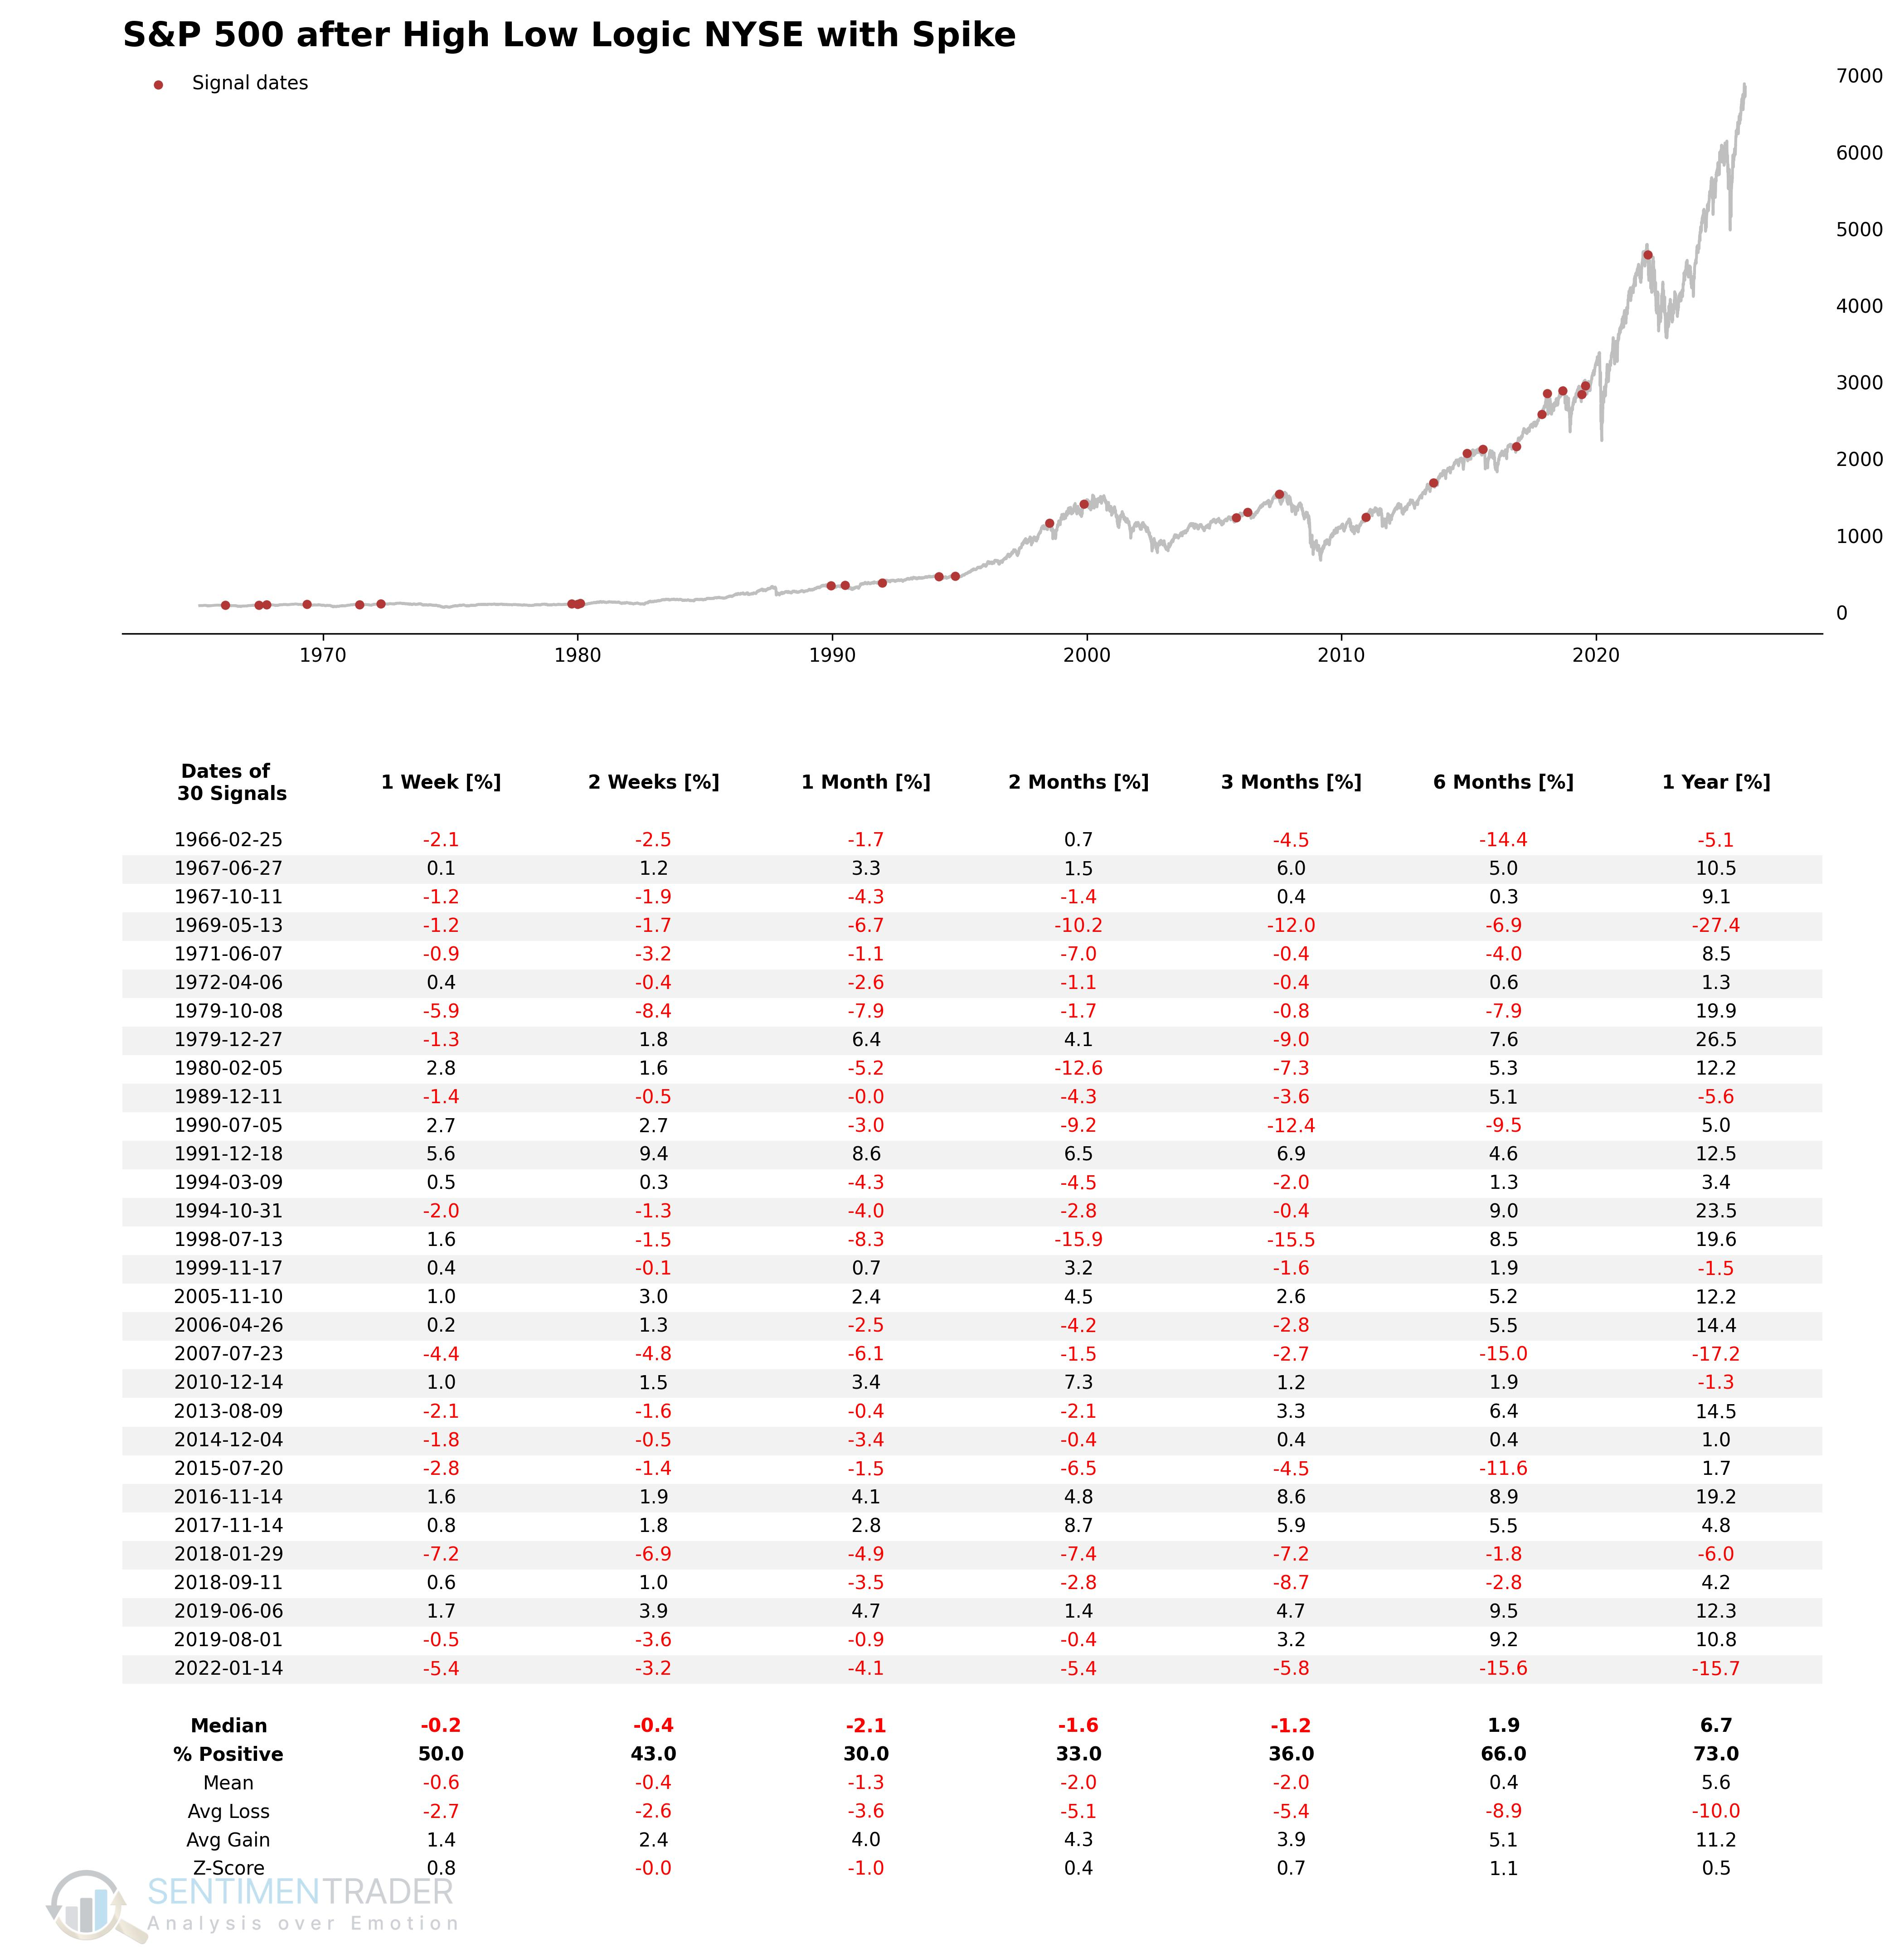
High-Low Logic NYSE with Spike
The High Low Logic Index, created by Norman Fosback, is a classic market breadth indicator designed to identify market environments where a large number of stocks are making 52-week highs and lows simultaneously. An excessive frequency of both new highs and new lows suggests unstable or fractured market participation. The version of the High Low Logic Index incorporates the following modifications: a 40-day exponential moving average is used instead of Fosback's original 50-day, and a spike in new lows functions as the final sell trigger.
Signal Criteria
- Condition 1 = High Low Logic Index >= 1.8%.
- Condition 2 = Percentage of NYSE Lows >= 3.5%.
- Condition 3 = S&P 500 is <= 3.75% from its 252-day high.
- Condition 4 = The High Low Logic Index resets below 1.5%. This reset filters out repetitive signals.
- If Conditions 1-4 are met, a risk-off signal is issued.
Current Day Chart

Signal Performance
As one can see, performance is weak across all timeframes.
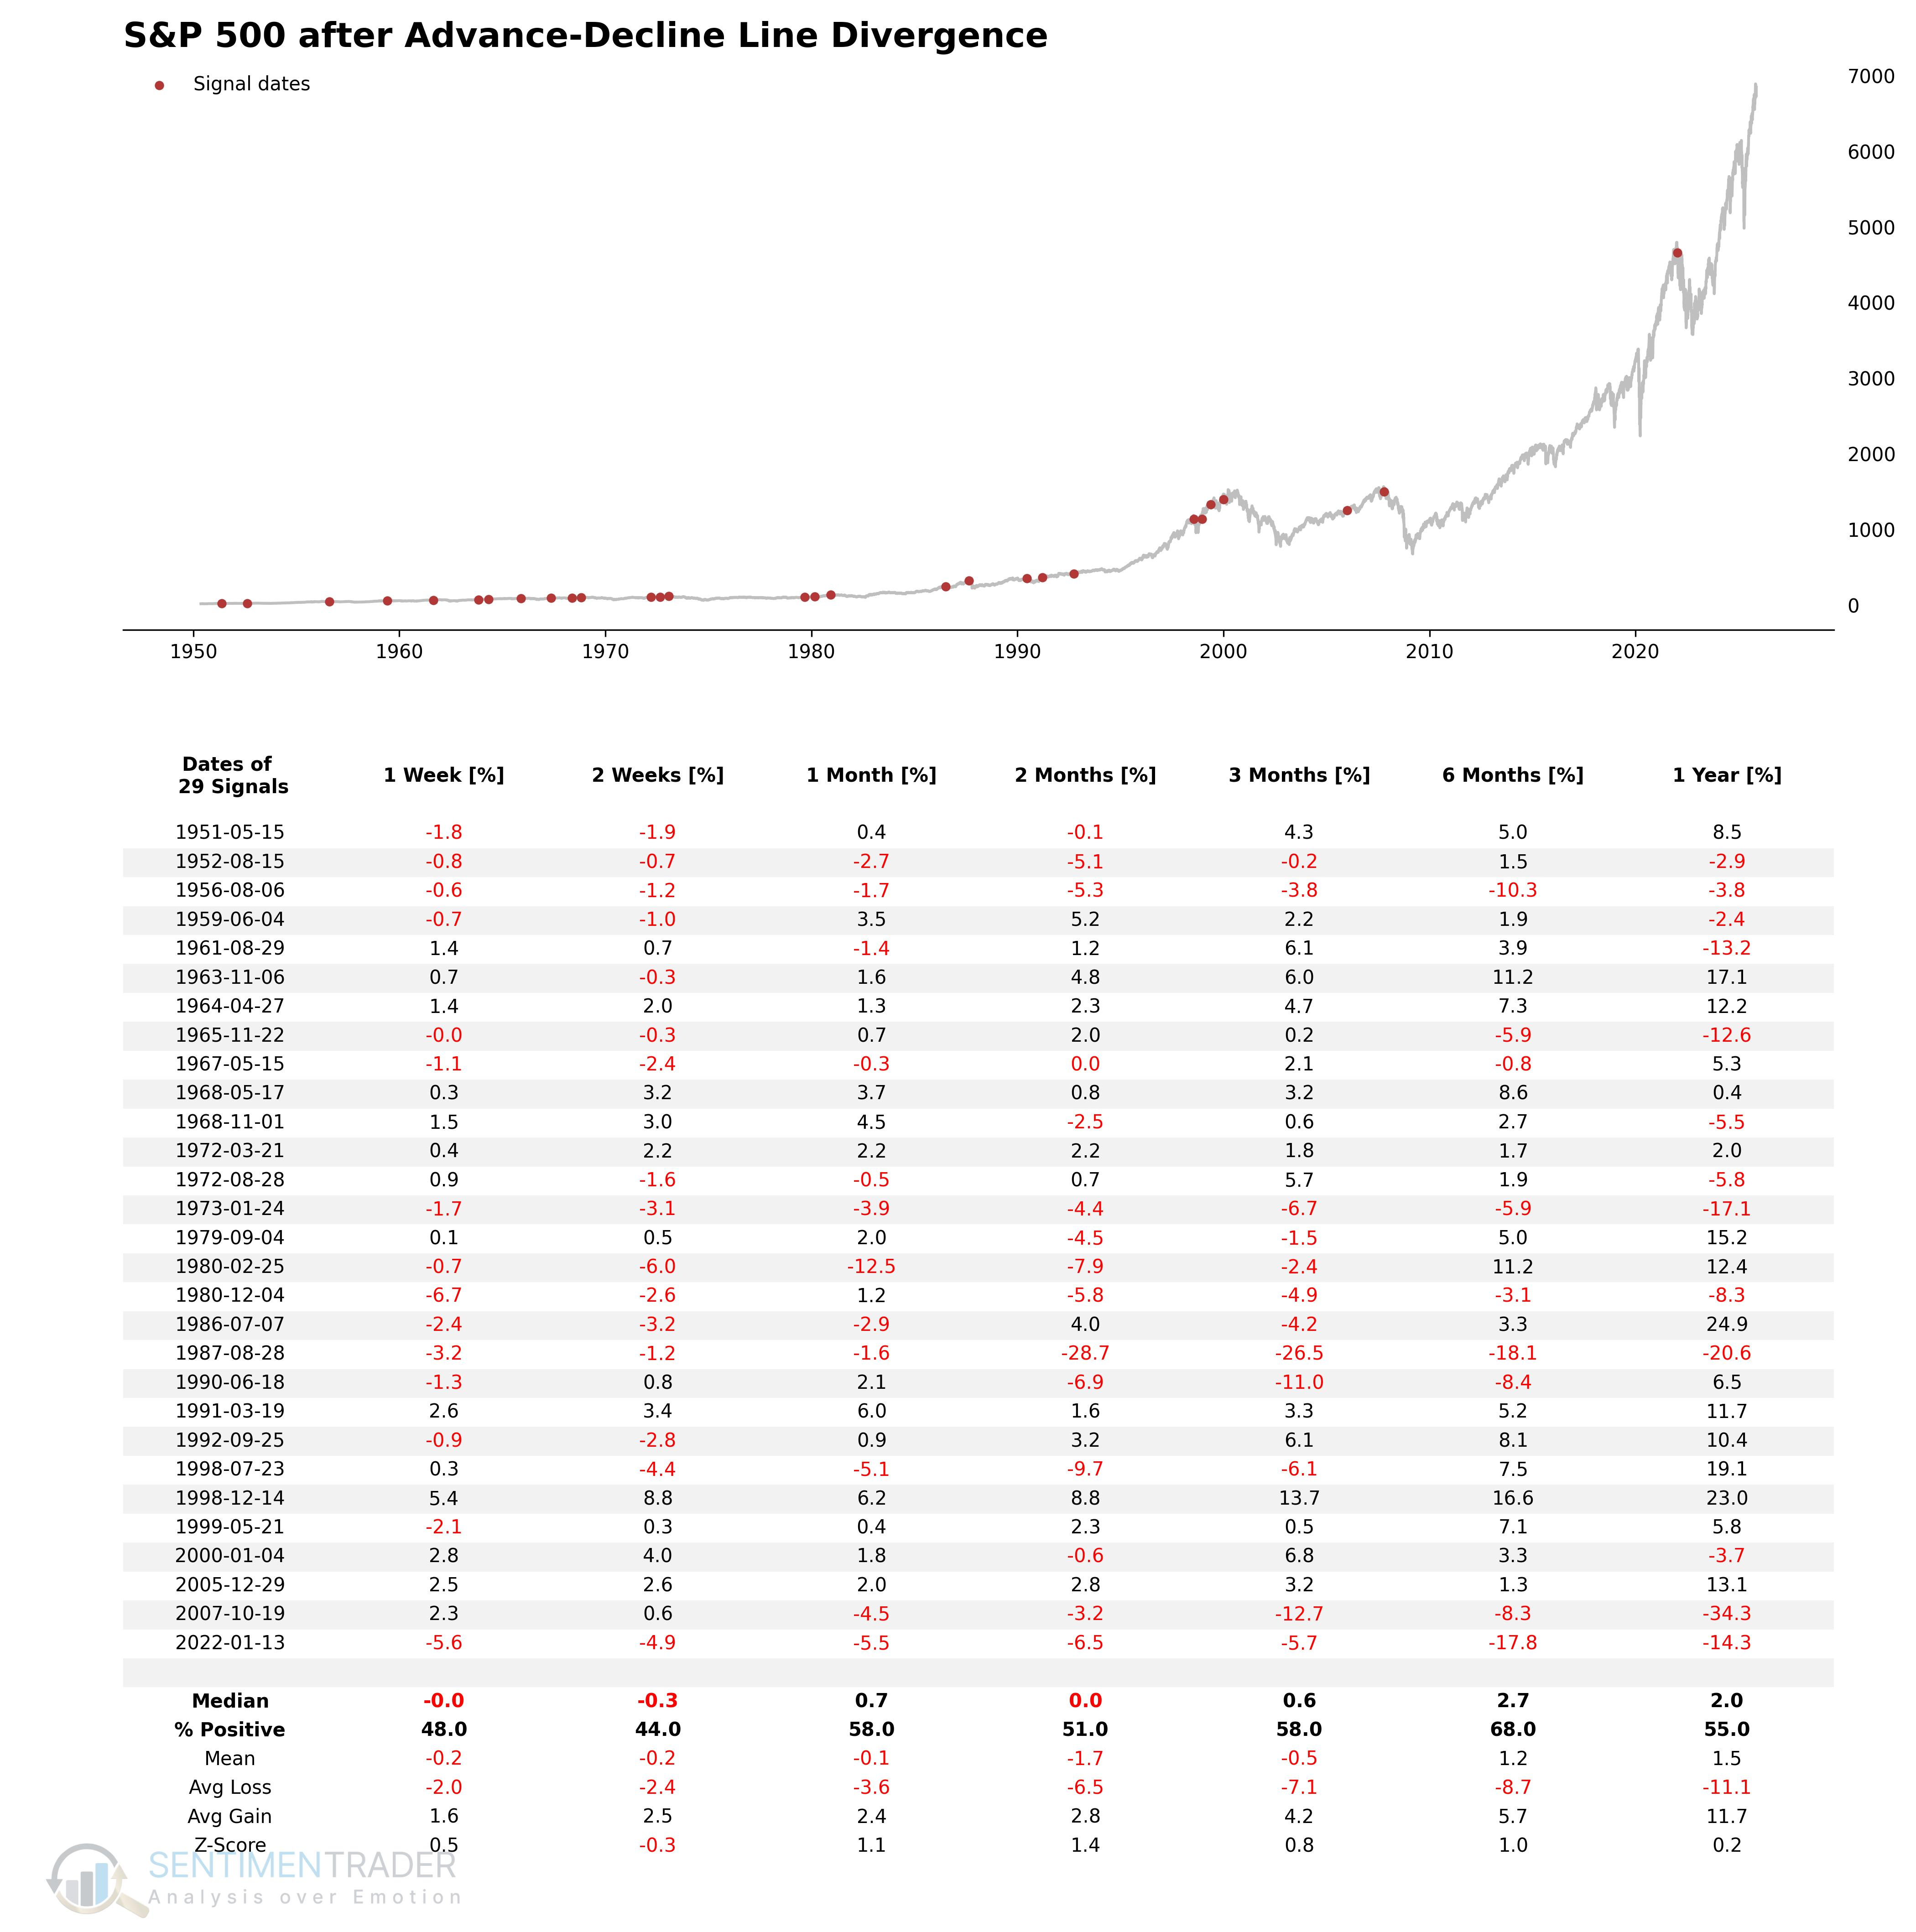
Advance-Decline Line Divergence
The cumulative Advance-Decline (A-D) line is a classic breadth indicator with one of the best records of identifying potential warnings before major market peaks. As the strategist Bob Farrell said, "Markets are strongest when they are broad and weakest when they narrow." This model uses NYSE stocks, as they provide a higher quality measure of breadth than the Nasdaq. I also prefer the NYSE because it includes non-common stocks, and these so-called "bond proxy" stocks can have a noteworthy influence on the A-D line's direction. While the model is straightforward, one key condition requires the A-D line to be below its 252-day high for at least 30 days before a signal can occur.
Signal Criteria
- Condition 1 = NYSE Advance/Decline Line Range Rank (252-day) <= 89.75%.
- Condition 2 = S&P 500 equals its 500-day high (closing price).
- Condition 3 = Days since A-D line 252-day high >= 30.
- Condition 4 = If Conditions 1-3 are met, begin counting days from the true count.
- Condition 5 = If Days Since True Count <= 10 AND the S&P 500 closes at a 15-day low, a risk-off signal is issued.
Current Day Chart
Signal Performance
Performance across all time periods has not been particularly strong.
In Part II, we will introduce the other components.
What the research tells us...
The S-TCTM Risk-Warning Model provides a 'weight-of-the-evidence' approach to identifying market fragility. Its purpose is to quantify the internal health of the market, spotting periods where broad participation is declining or sentiment is excessively optimistic, even as the headline index may appear strong.
In this report, we have deconstructed the first four of the ten components that make up this composite model. As the individual performance tables show, these components are designed to identify specific, historically unfavorable conditions. Indicators like the High-Low Logic Index, A-D Line Divergence, and new low expansions are all tools to spot an unhealthy, fractured market. The historical data for these individual signals preceding periods of weak or subpar returns illustrates the logic of the composite model: by combining these small, individual warnings, the S-TCTM Risk-Warning Model aims to build a comprehensive case for when overall market risk is elevated. In Part II, we will continue this deep dive into the remaining components.