Reports Library

Search our Library

Explore our vast report library, a resource packed with data-driven insights and expert market perspectives.
Thank you! Your submission has been received!
Oops! Something went wrong while submitting the form.
SentimentEdge report
Midterm election years bring a rally

Midterm election years bring a rally

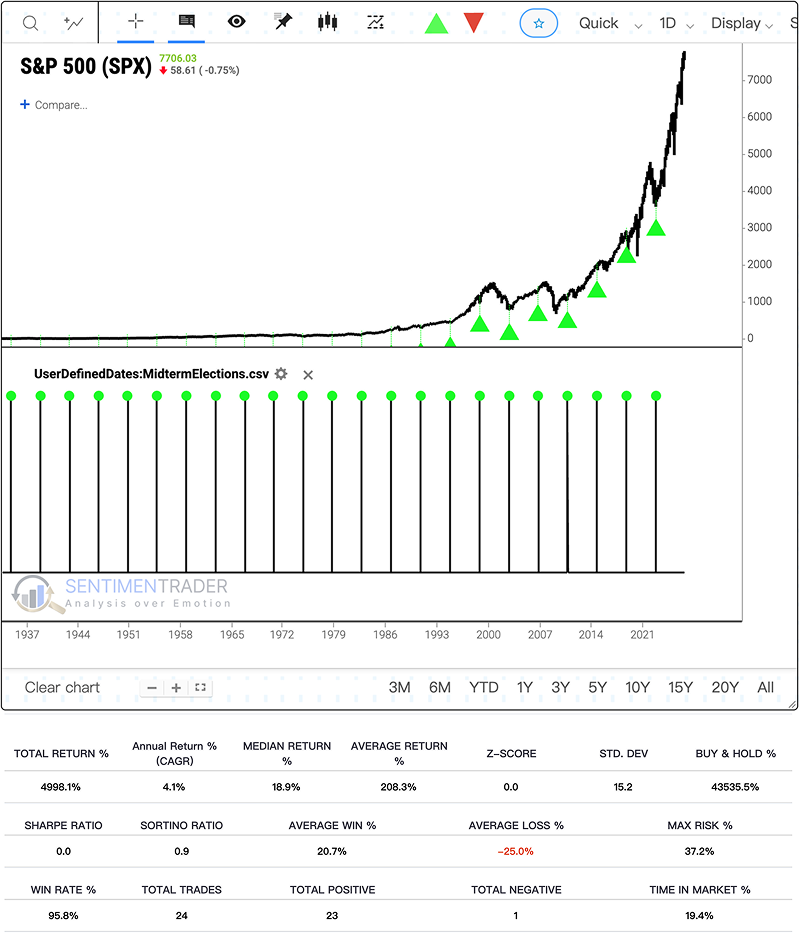
Midterm years have historically outperformed other presidential-cycle years after a late-September S&P 500 entry. The advantage appeared before election day and survived nearby entry dates, but 1930 and the deep 2018 drawdown show why a high win rate does not mean low risk.
2026-09-24 at 10:00:00 PDT
Read More
Kaeppel's Corner
11 Election Cycle months you should know about

11 Election Cycle months you should know about

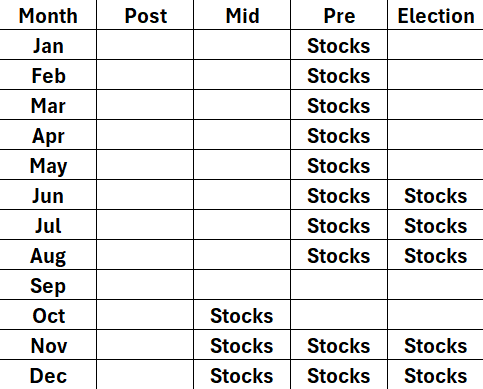
The stock market will soon enter the heart of the four-year election cycle. What does this imply for stock indexes and sectors? Details herein.
2026-09-24 at 08:00:00 PDT
Read More
ModelEdge report
Is it too late to join the Semis party?

Is it too late to join the Semis party?

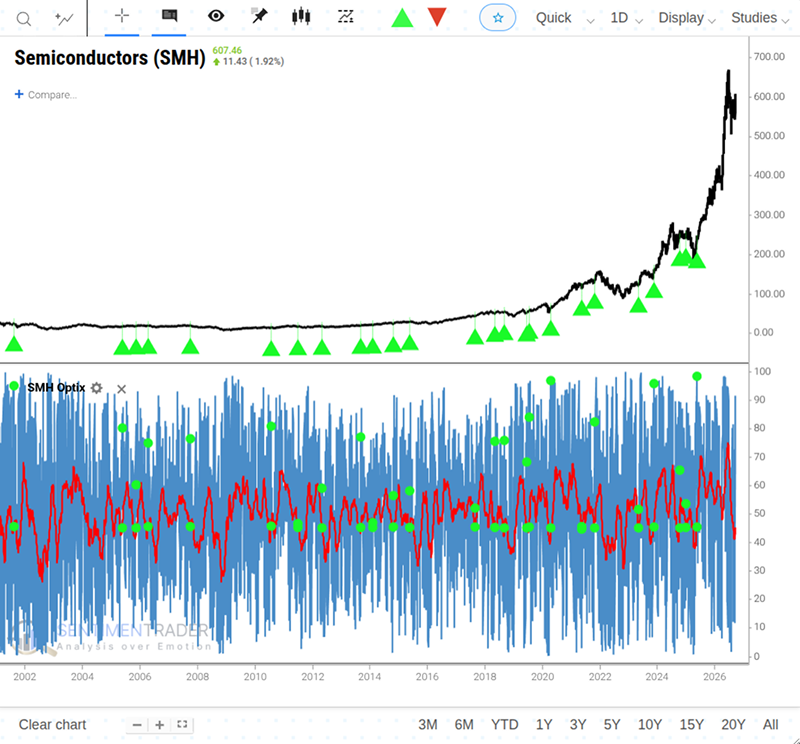
The VanEck Semiconductor ETF ($SMH) has rebounded strongly, with a bullish Optix signal boasting a 76% 1-week win rate. However, history shows waiting one month for price confirmation pushes the subsequent 1-month win rate to a massive 93%.
2026-09-23 at 10:00:00 PDT
Read More
Kaeppel's Corner
A favorable development in Smart Money versus Dumb Money

A favorable development in Smart Money versus Dumb Money

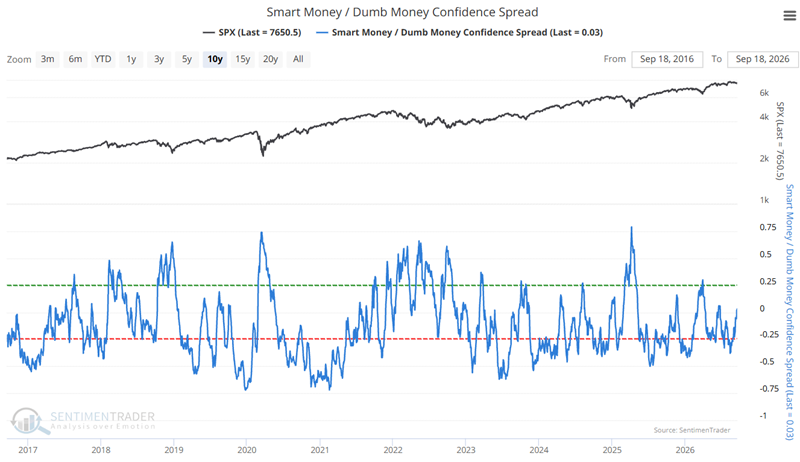
The Smart Money/Dumb Money Confidence Spread is an important sentiment indicator. In this note, we test a systematic approach in Backtest Engine 2.0 using a recently triggered entry signal with exit criteria added.
2026-09-22 at 10:30:00 PDT
Read More
SentimentEdge report
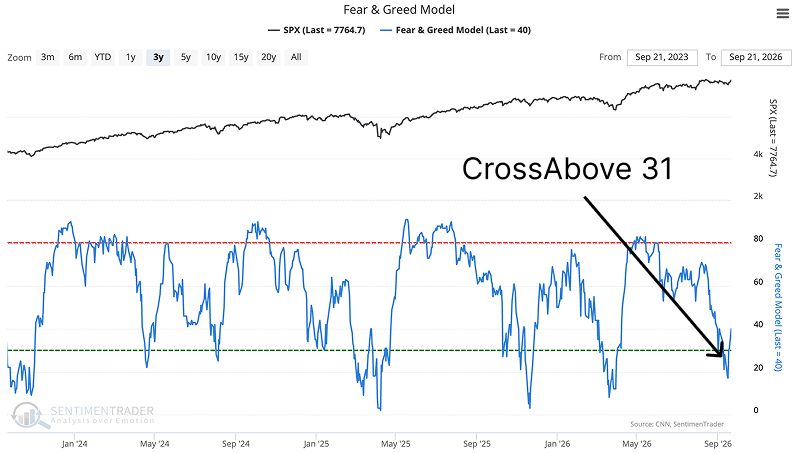
Fear is receding

Fear is receding

SentimenTrader's Fear & Greed Model recovered above 30 while the S&P 500's long-term trend stayed intact. Similar signals usually preceded gains but did not beat era-matched random dates; within the 20–30 band, direction mattered more than level.
2026-09-22 at 10:00:00 PDT
Read More
ModelEdge report
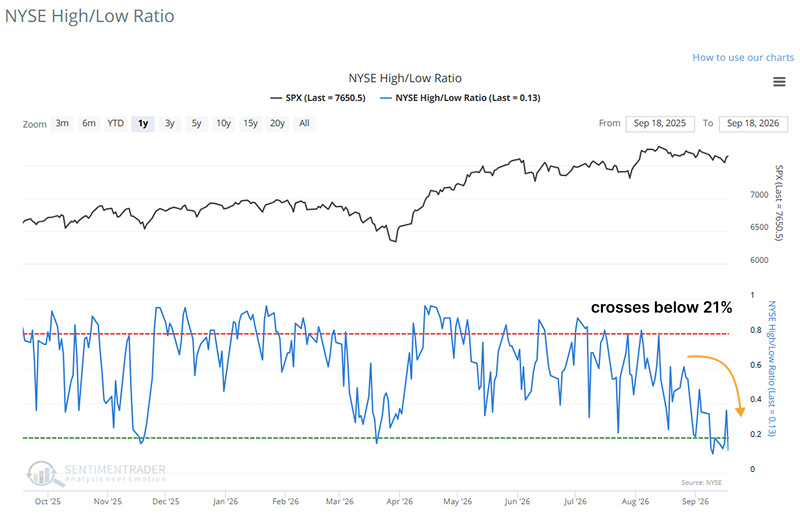
NYSE Percentage of New Lows and 200-Day Average Risk-Off Model triggers a risk-off signal

NYSE Percentage of New Lows and 200-Day Average Risk-Off Model triggers a risk-off signal

The NYSE Percentage of New Lows and 200-Day Average model has triggered a risk-off signal. With deteriorating internal breadth masked by the S&P 500 hovering near its highs, historical data warns of a high probability of a near-term correction.
2026-09-21 at 10:00:00 PDT
Read More
Kaeppel's Corner
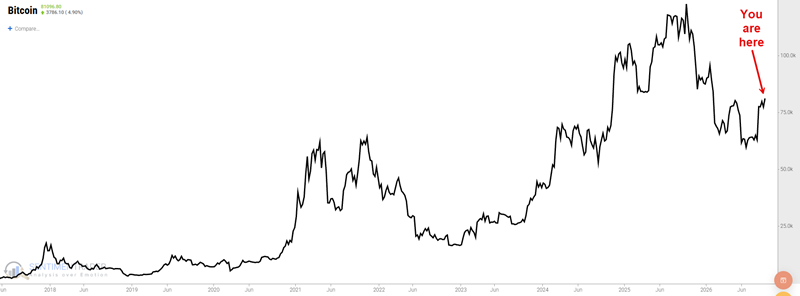
The Bitcoin bounce may have legs

The Bitcoin bounce may have legs

After another major drawdown, Bitcoin has rallied sharply. Does this rally have legs? A variety of indicators suggest a specific answer. Details herein.
2026-09-21 at 08:00:00 PDT
Read More
Weekend Reading
TradingEdge Weekly for Sep 18 - M2 model at +2 bullish signal, Market enters danger zone, Gold model turns favorable

TradingEdge Weekly for Sep 18 - M2 model at +2 bullish signal, Market enters danger zone, Gold model turns favorable

The Fed's first rate hike and an MEC reading in the "Danger Zone" warn of short-term equity drawdowns. Yet, powerful long-term models like the AAII Bull Ratio and Real M2 money supply are flashing historically bullish 12-month signals.
2026-09-18 at 15:00:00 PDT
Read More
SentimentEdge report
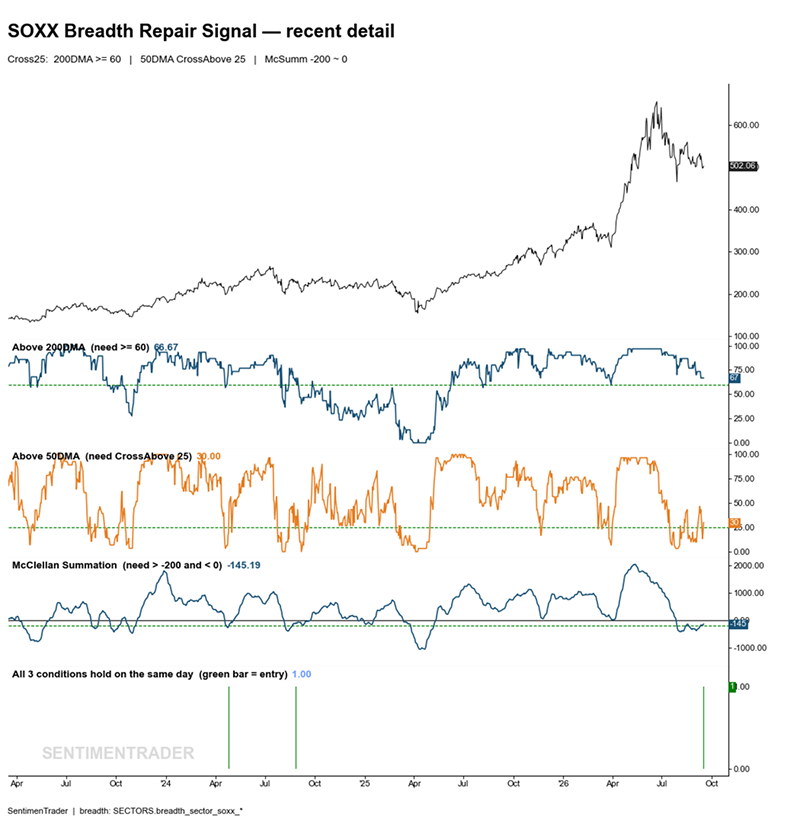
Semiconductor breadth is split inside and repairing overall

Semiconductor breadth is split inside and repairing overall

SOXX breadth is attempting to repair while long-term participation remains intact. Historical returns leaned positive but were uneven, as AI leadership stayed dispersed, cyclical chipmakers remained weak, and industry volatility normalized.
2026-09-17 at 10:00:00 PDT
Read More