
Weekly wrap - Breadth blast, easing uncertainty, better business sentiment

House view:
- Stocks:
- Short-term: Modestly bearish. It's showing no ill effects yet, and maybe this will be a failed signal. But a compressed VIX during this time of year consistently preceded weak returns, as did Julys with numerous new highs in the S&P 500 and Nasdaq Composite. Robust earnings have been met with a churning market, with multiple fades from emotional gaps up. This time frame covers 1 - 4 weeks.
- Intermediate-term: No view. Momentum is ebbing, but from extremely strong levels. Breadth has been increasingly suspect (especially on the Nasdaq) but that, too, follows a spate of excellent readings from April and May. Positive earnings haven't led to much sustained upside, and gap-up opens haven't seen much follow-through. Speculative trading activity is bumping against historical extremes and valuations by nearly any metric are at or near multi-decade ceilings. This is a tug-of-war that shows no clear edge. This time frame covers 1-5 months.
- Long-term: Bullish. The recovery from the April panic has been historic, and signs since then have supported a long-term bullish move, with primarily economically sensitive sectors leading. Long-term breadth measures have improved across sectors and world markets, which have consistently preceded positive 6-12 month returns in most equity indices. This time frame covers 6-12 months.
- Cyclical momentum tends to favor those sectors for average returns
- Defensive sectors also doing well, with momentum favoring high win rate but lower average return
- Very long-term (one year+) favors mean reversion to equal-weight, small-caps, and health care
- Bonds: Long-term cycles remain bearish. Historically, August has been one of the strongest seasonal months for TLT, but since the 2020 peak, it's been one of the weakest. That leads into September and October, which are traditionally weak. We haven't seen much among analysts' studies to suggest a change in trend.
- Commodities: Signs point to a probable secular bull market following multiple new highs. An effective commodity trend model is currently bullish. Gold (especially gold miners) and silver are extended and have a bad history of sustaining gains but gold continues to shake that off and hit new highs. Oil seasonality is especially weak for the next three months, and other factors like term structure suggest headwinds.
- Crypto: We follow several simple systems for bitcoin, which we consider the equivalent of the S&P 500 for crypto. Due to bitcoin's explosive growth over long periods, it's dangerous to equate neutral conditions with being bearish for some of these. However, if a system is "out," we consider it bearish for this summary.
- Triple 40: Bullish
- RSI Momentum: Bullish
- Trend and Relative Trend: Bullish
- PMI: Bearish
- M2 ROC: Bullish
Where we're at
Most investors have the most riding on equities. We feel that the most significant determinants of success for investors are whether to adjust their allocation to that asset class based on factors that have historically had a good record of preceding above- or below-random returns in the months ahead.
Those factors include the probability of looming recession, sentiment, price action, volatility, breadth, and the bond market. The chart below summarizes the main indicators and composite models we watch for those factors, and they're currently all in bullish regimes. While there are some compelling concerns, especially on shorter time frames, the overall gist is still solid. You may notice that valuations are not part of these factors - while long-term returns do tend to show a drag from high valuations, the relationship has been too inconsistent on time frames under one year.
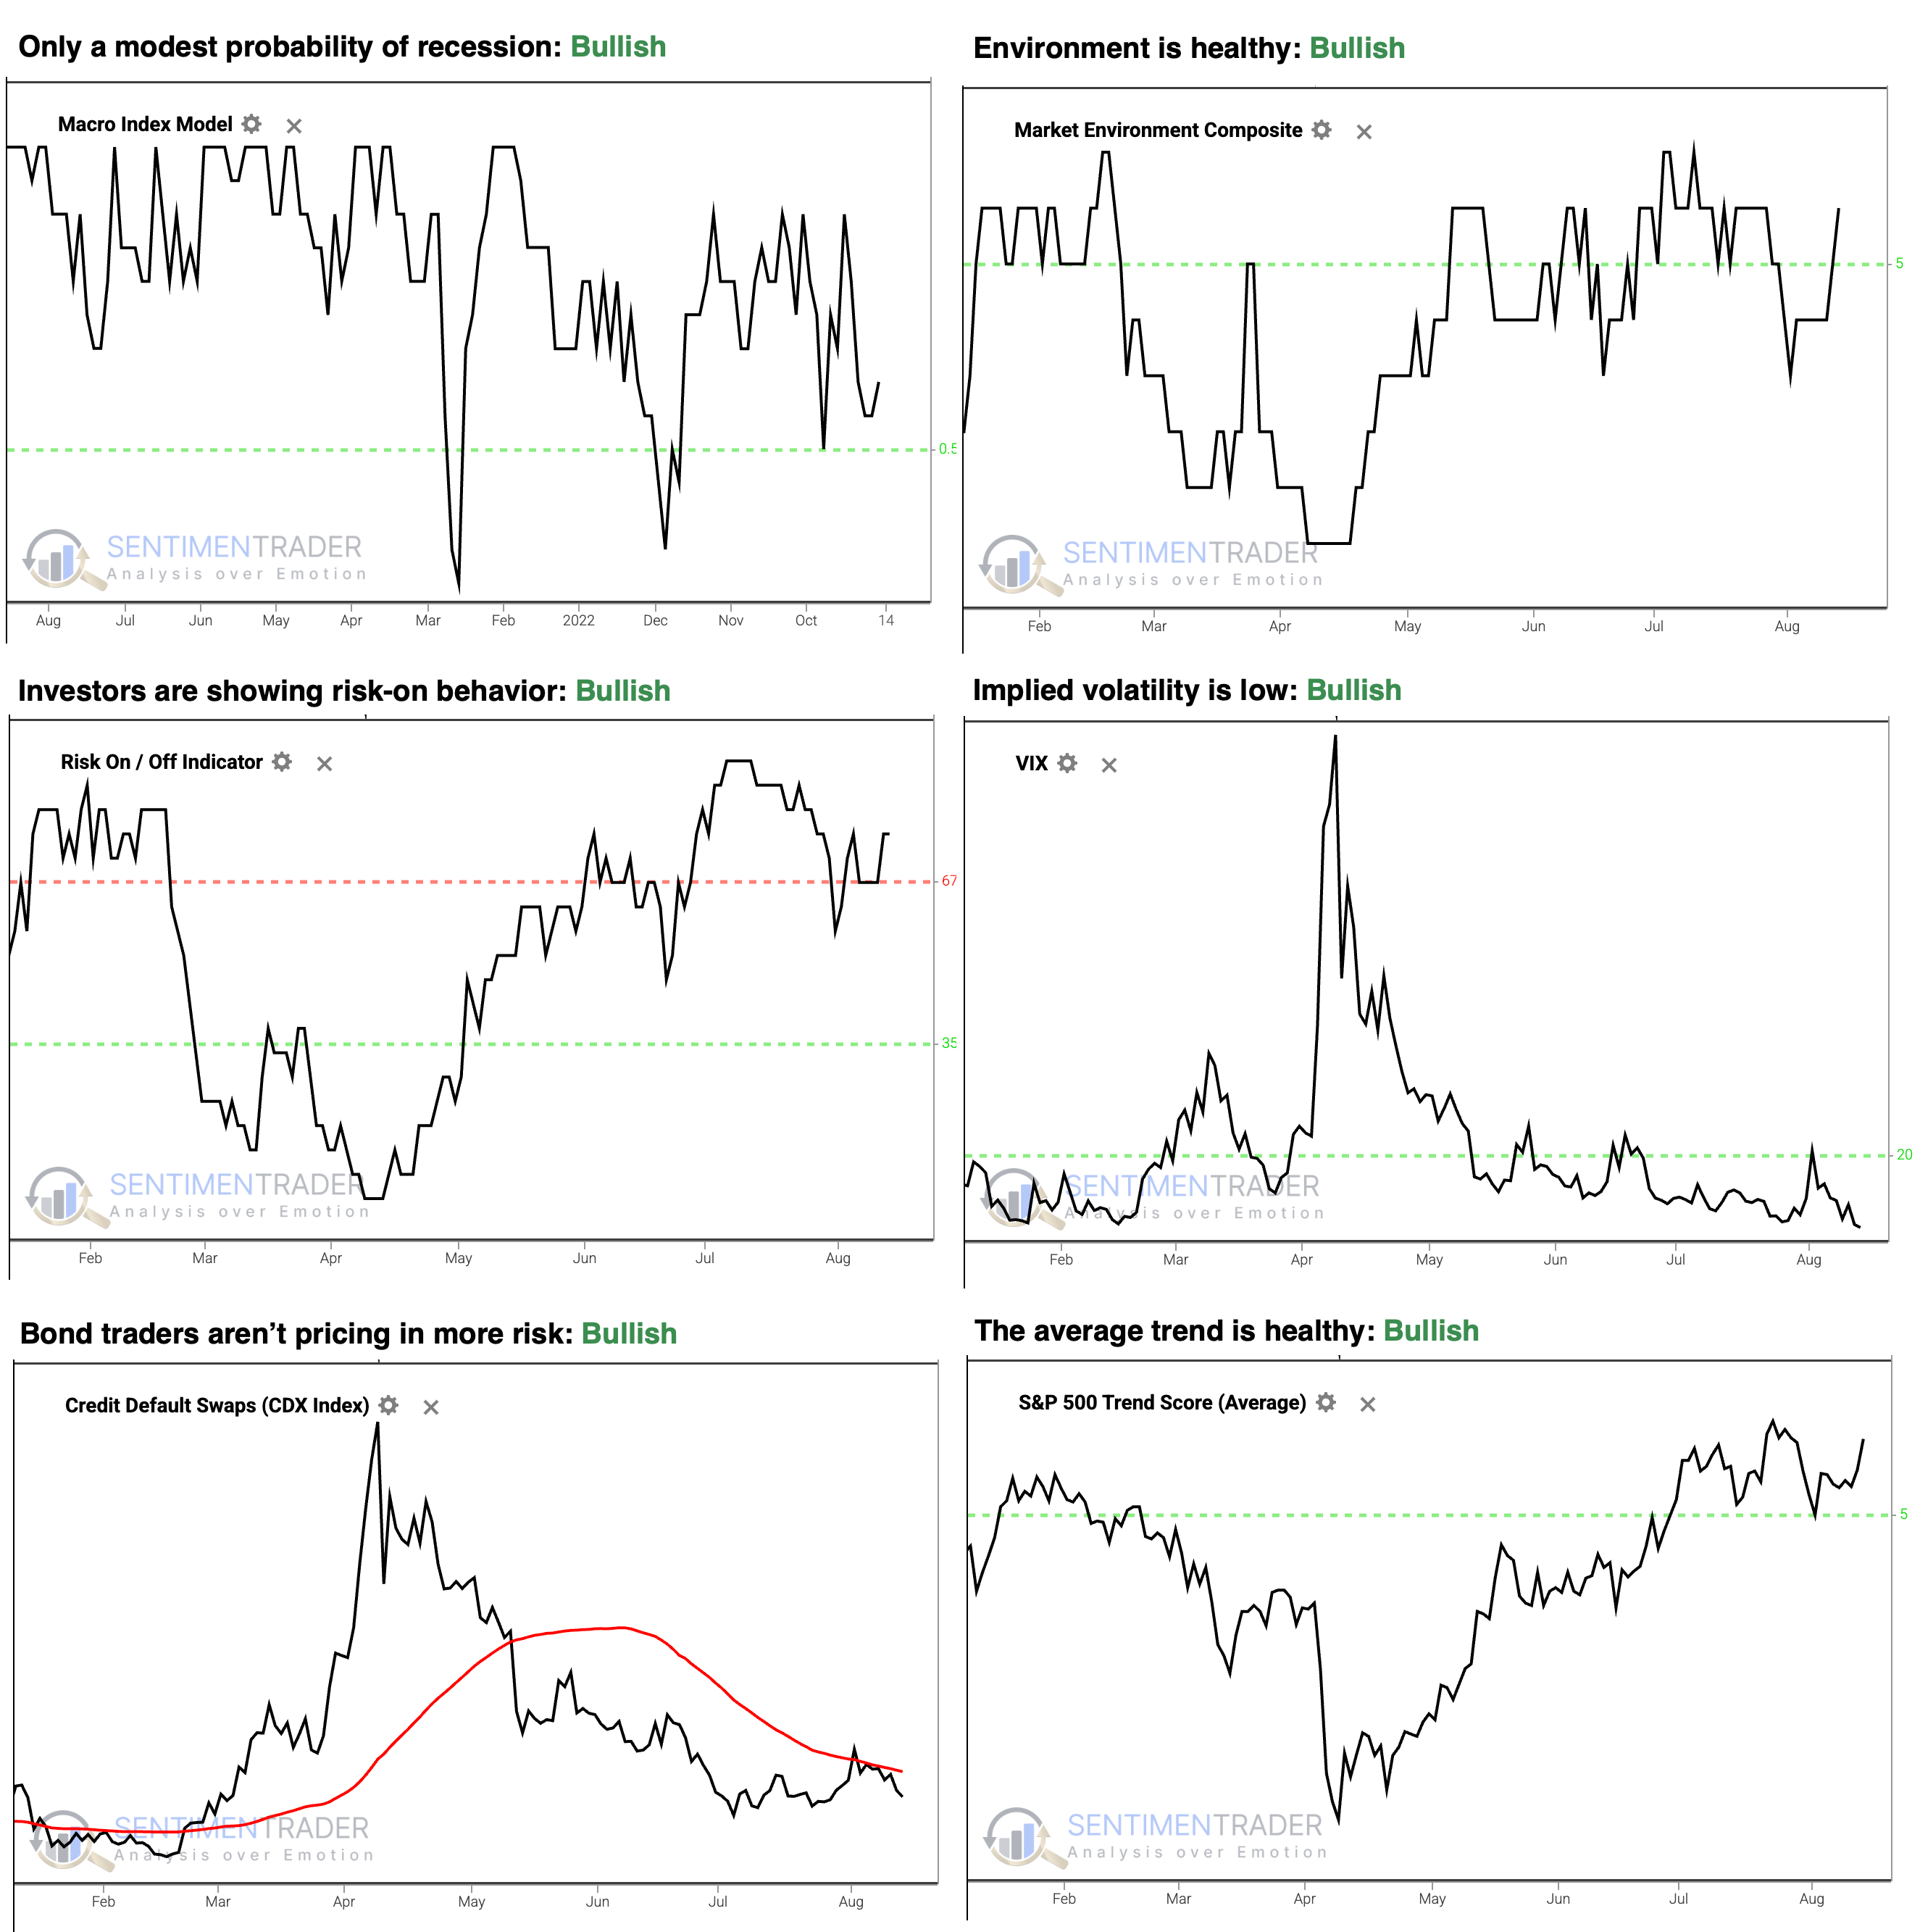
- The Macro Index Model is above the 50% threshold, which has been a vital level as outlined here.
- The Market Environment has been skittish since the April low, but is currently healthy. Future returns, especially for higher-beta indices, has been markedly better, with less risk, when the environment is healthy as outlined here.
- The Risk On / Off Indicator shows that investors are still in risk-on mode. This has been a good sign for future returns as outlined here.
- Implied volatility remains below 20, showing a calm environment. The S&P 500 has perfomed well when this is the case as outlined here.
- Credit default swap spreads are below their 50-day moving average, which drastically improves stock returns as outlined here.
- A composite of trend measures in SPY and the average S&P 500 stock remain above 5, which show healthy trend conditions.
Since April, the most compelling studies have had a strongly bullish bias on longer time frames. You can follow these through the Active Studies page. From time to time, when the analysts' studies provide an overwhelming message, it will override the charts above, but there has been no consensus in the studies to suggest overriding the bullish environment. The short-term is a bit iffy, but we don't see a strong bearish edge there, especially given the above.
Other major markets have been mostly rangebound for four months, and there is little among what we follow to suggest a compelling edge either way.
What we covered this week
Breadth blast
The S&P 500 leapt to fresh record territory on Tuesday. Market breadth was equally impressive, as NYSE advancers outpaced decliners by a 4-to-1 margin in two of the last seven sessions.
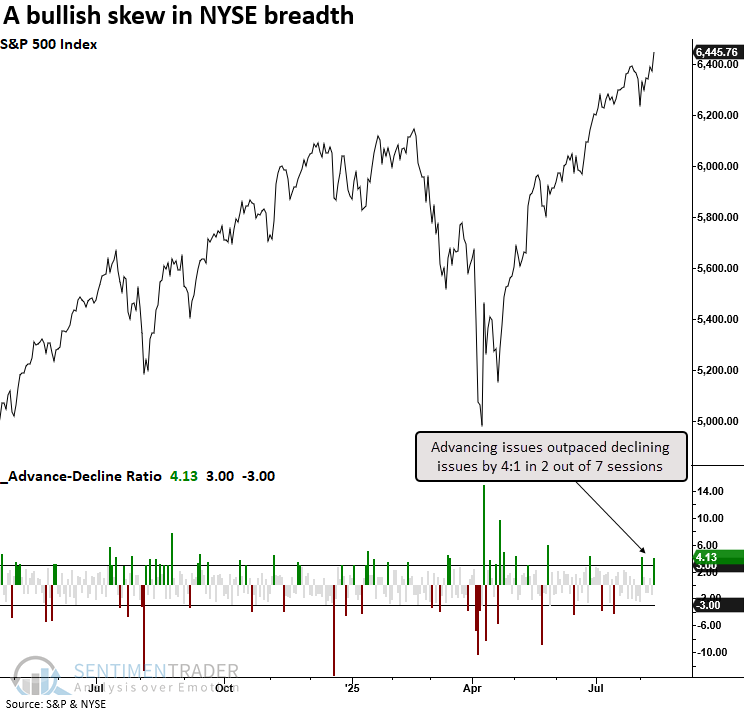
It's been a decent sign for a persistent rally when the NYSE advance-decline ratio surpassed 3-to-1 in two of seven trading sessions, and the S&P 500 capped it off with a record high. Similar instances saw the world's most benchmarked index display median returns that exceeded random outcomes in all but one time frame, and consistency that was favorable, but not overwhelming.
The Russell 2000 surged on Tuesday, resulting in an advance-decline ratio of 8:1, the best skew since April 23rd, when stocks were emerging from the liberation day meltdown. Out of the five instances when the ratio exceeded 5:1 in 2 out of 7 sessions, with the S&P 500 at a record high, the world's most benchmarked index, and the Russell 2000, were higher three months later every time.
Money and inflation fears
In the U.S., monetary policy revolves around the actions taken by the Fed to control the money supply and influence the economy. Whether monetary policy successfully achieves these goals is secondary. What really matters to the stock market is what the masses think about monetary policy.
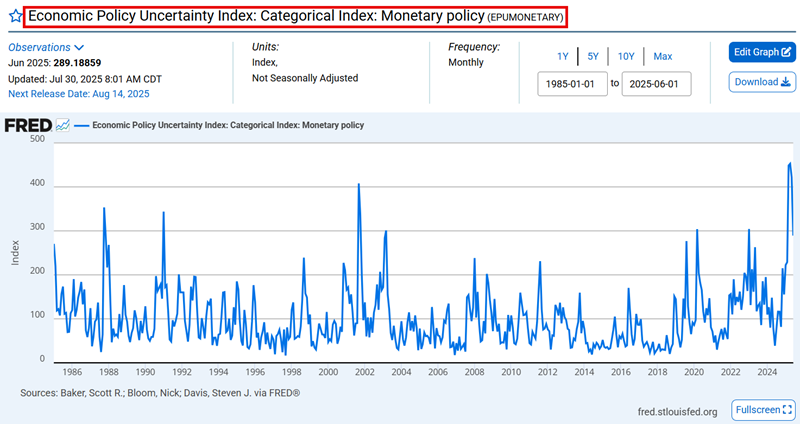
This index measures the degree of uncertainty among investors regarding monetary policy. The higher the index reading, the greater the uncertainty. Every month in which the index closed above 280, the S&P 500's one- and three-month returns were positive.
The market hates uncertainty, and few things create more uncertainty than rising inflation. Interestingly, while soaring inflation is negative for stocks, soaring fear regarding inflation is bullish. The Equity Market Volatility Tracker: Macroeconomic News and Outlook: Inflation index is another little-known data set based on news data that measures inflation-related fear. That also recently peaked, and previous signals were a good sign for stock returns.
Small business rebound
Small business owners are feeling better.
The latest survey by the National Federation of Independent Business (NFIB) shows that business owners are more optimistic than they usually are about future conditions. For the first time in several months, the survey popped above 100.
For the small-cap Russell 2000 index, a reading above 100 is not necessarily a great sign. The improved sentiment among small business owners is paradoxically a better sign for the best large-cap stocks. When the survey was above 100, the S&P 500 fared much better than the Russell 2000, with about twice as large an annualized return.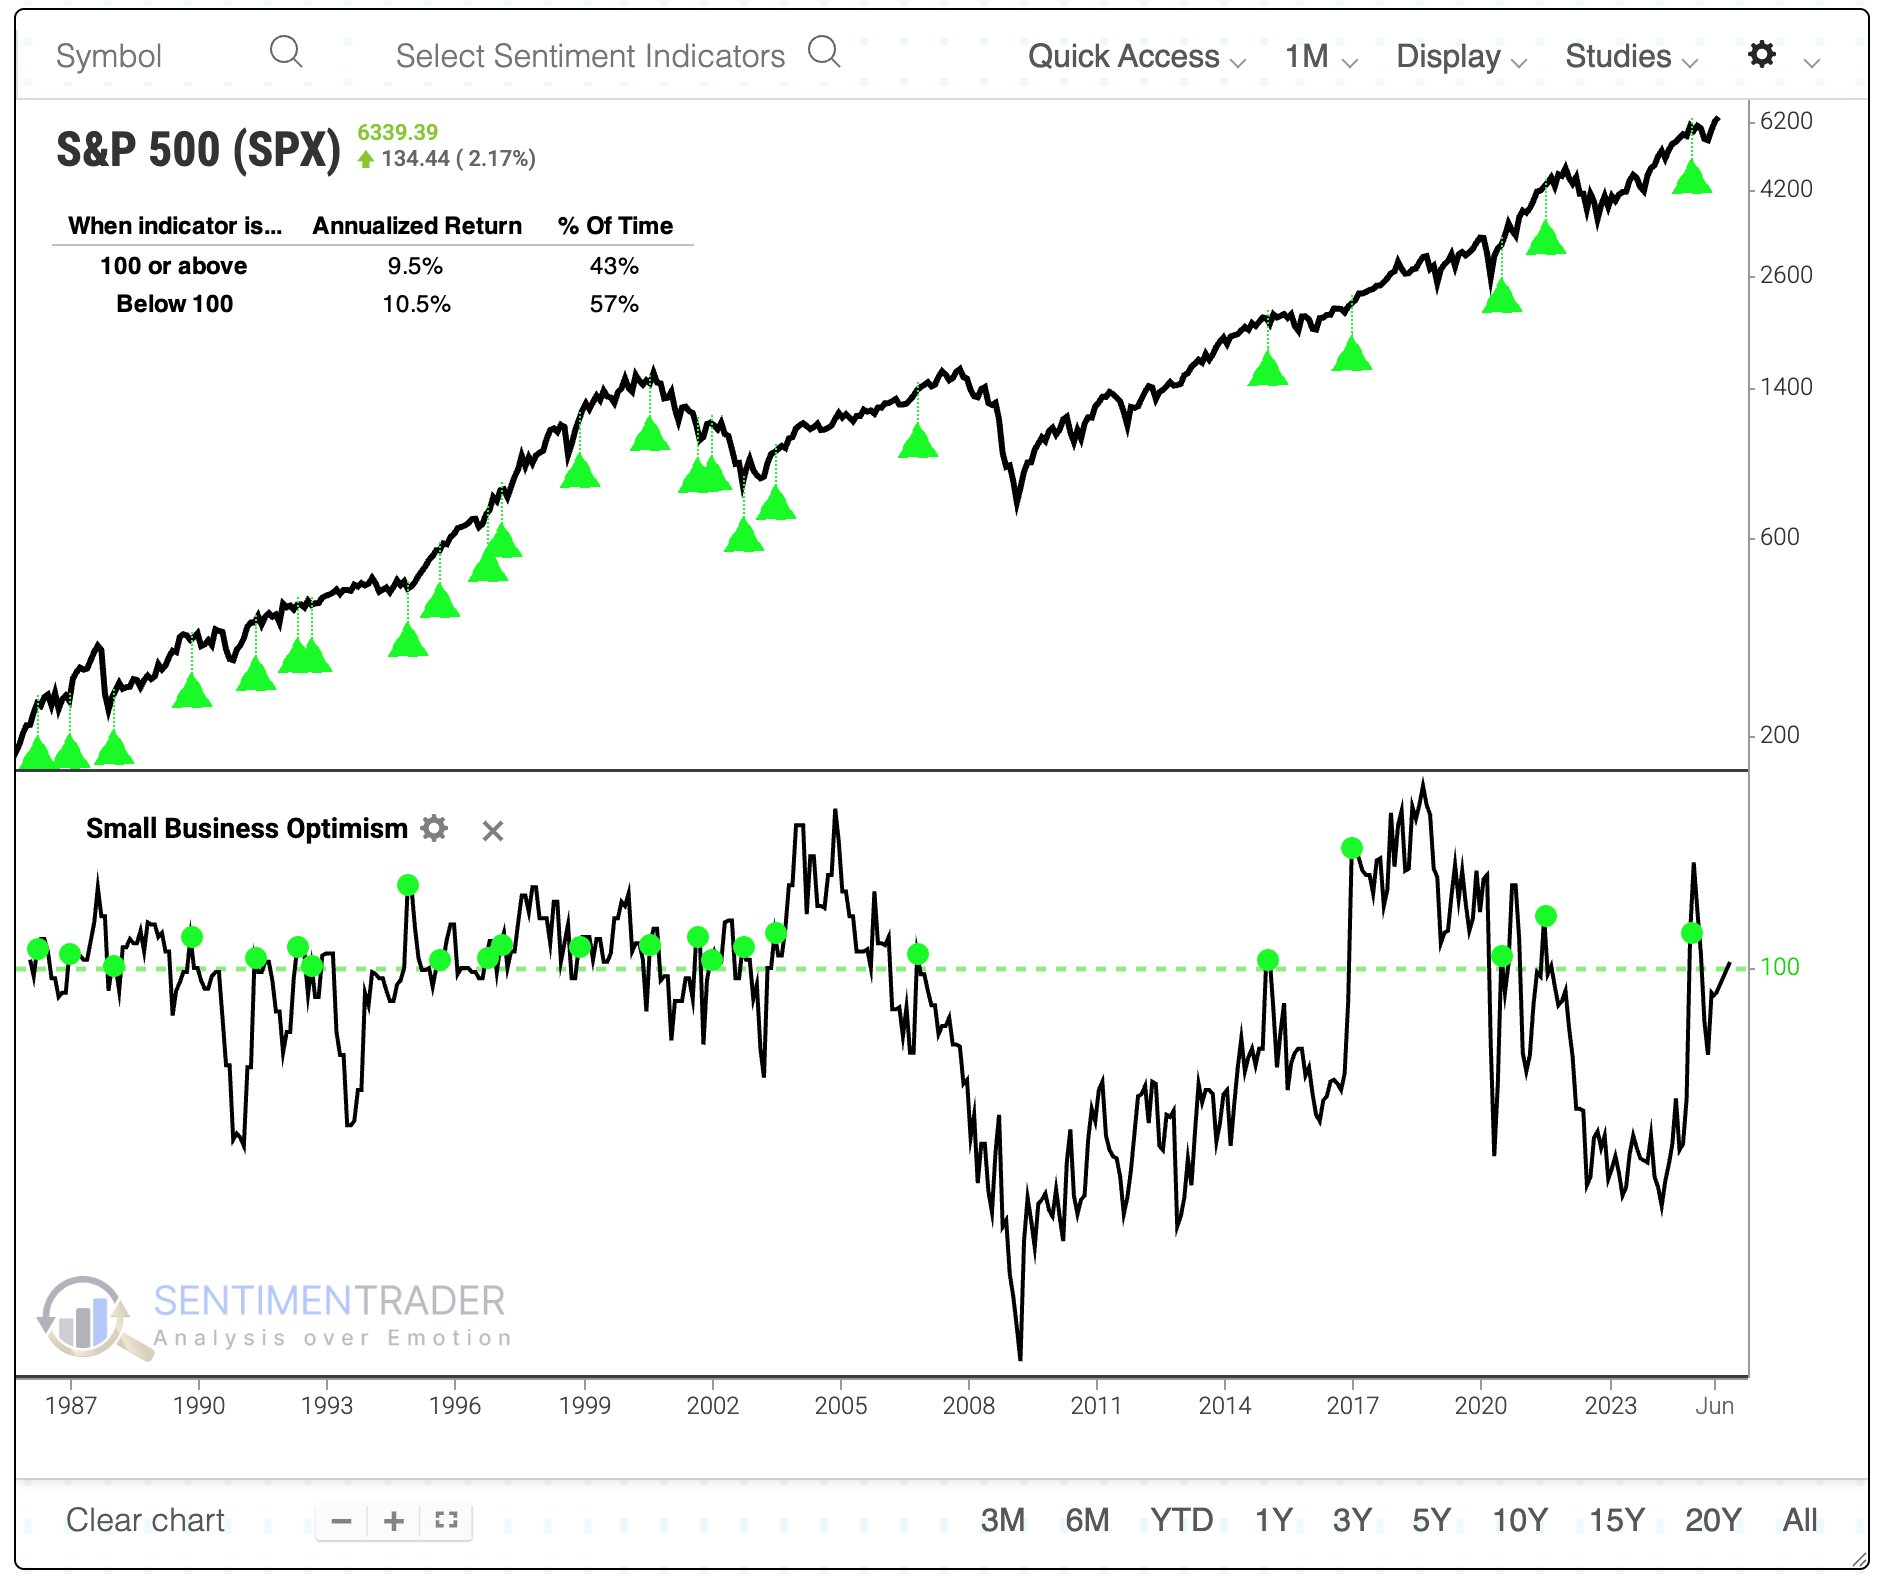
Over the next three months, the S&P rarely suffered a loss. The four times it did decline, the losses were small. Those losses were somewhat effective warning signs, however. Each time the three-month return was negative, so was the one-year return (the 2024 signal is TBD).
Tech continuation
Talk about a comeback.
The magnitude of the post-tariff tantrum rally in tech is not surprising, given how oversold XLK became during the February to April selloff. A continuation signal is a favorable signal that occurs after a price uptrend has already been established.
The XLK Component Correlation indicator tracks the degree to which stocks in the sector trade together. The signals below mark each date when the XLK Component Correlation indicator crossed above 0.75 for the first time in six months.
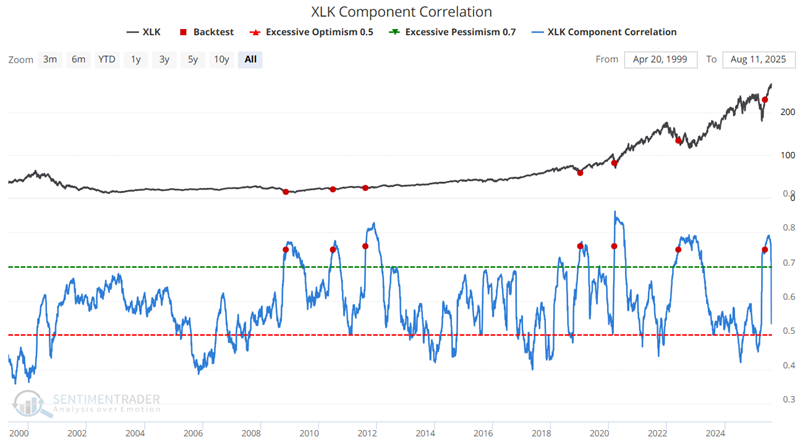
The most recent signal occurred on May 21st. XLK has been higher one year after all previous signals, with a median gain of 37%. XLK is 16% above its level on May 21st. More potentially good news can be found in the fact that technology sector corporate insiders are showing faith in the rally with their own money.
Weak participation in big tech
One short-term worry is that for the first time since its inception, the Nasdaq 100 (NDX) closed at a record high with less than 48% of its members trading above their 50-day moving average. Over the past 40 years, an average of 76% of the index members were above their 50-day average when the NDX reached a new high.
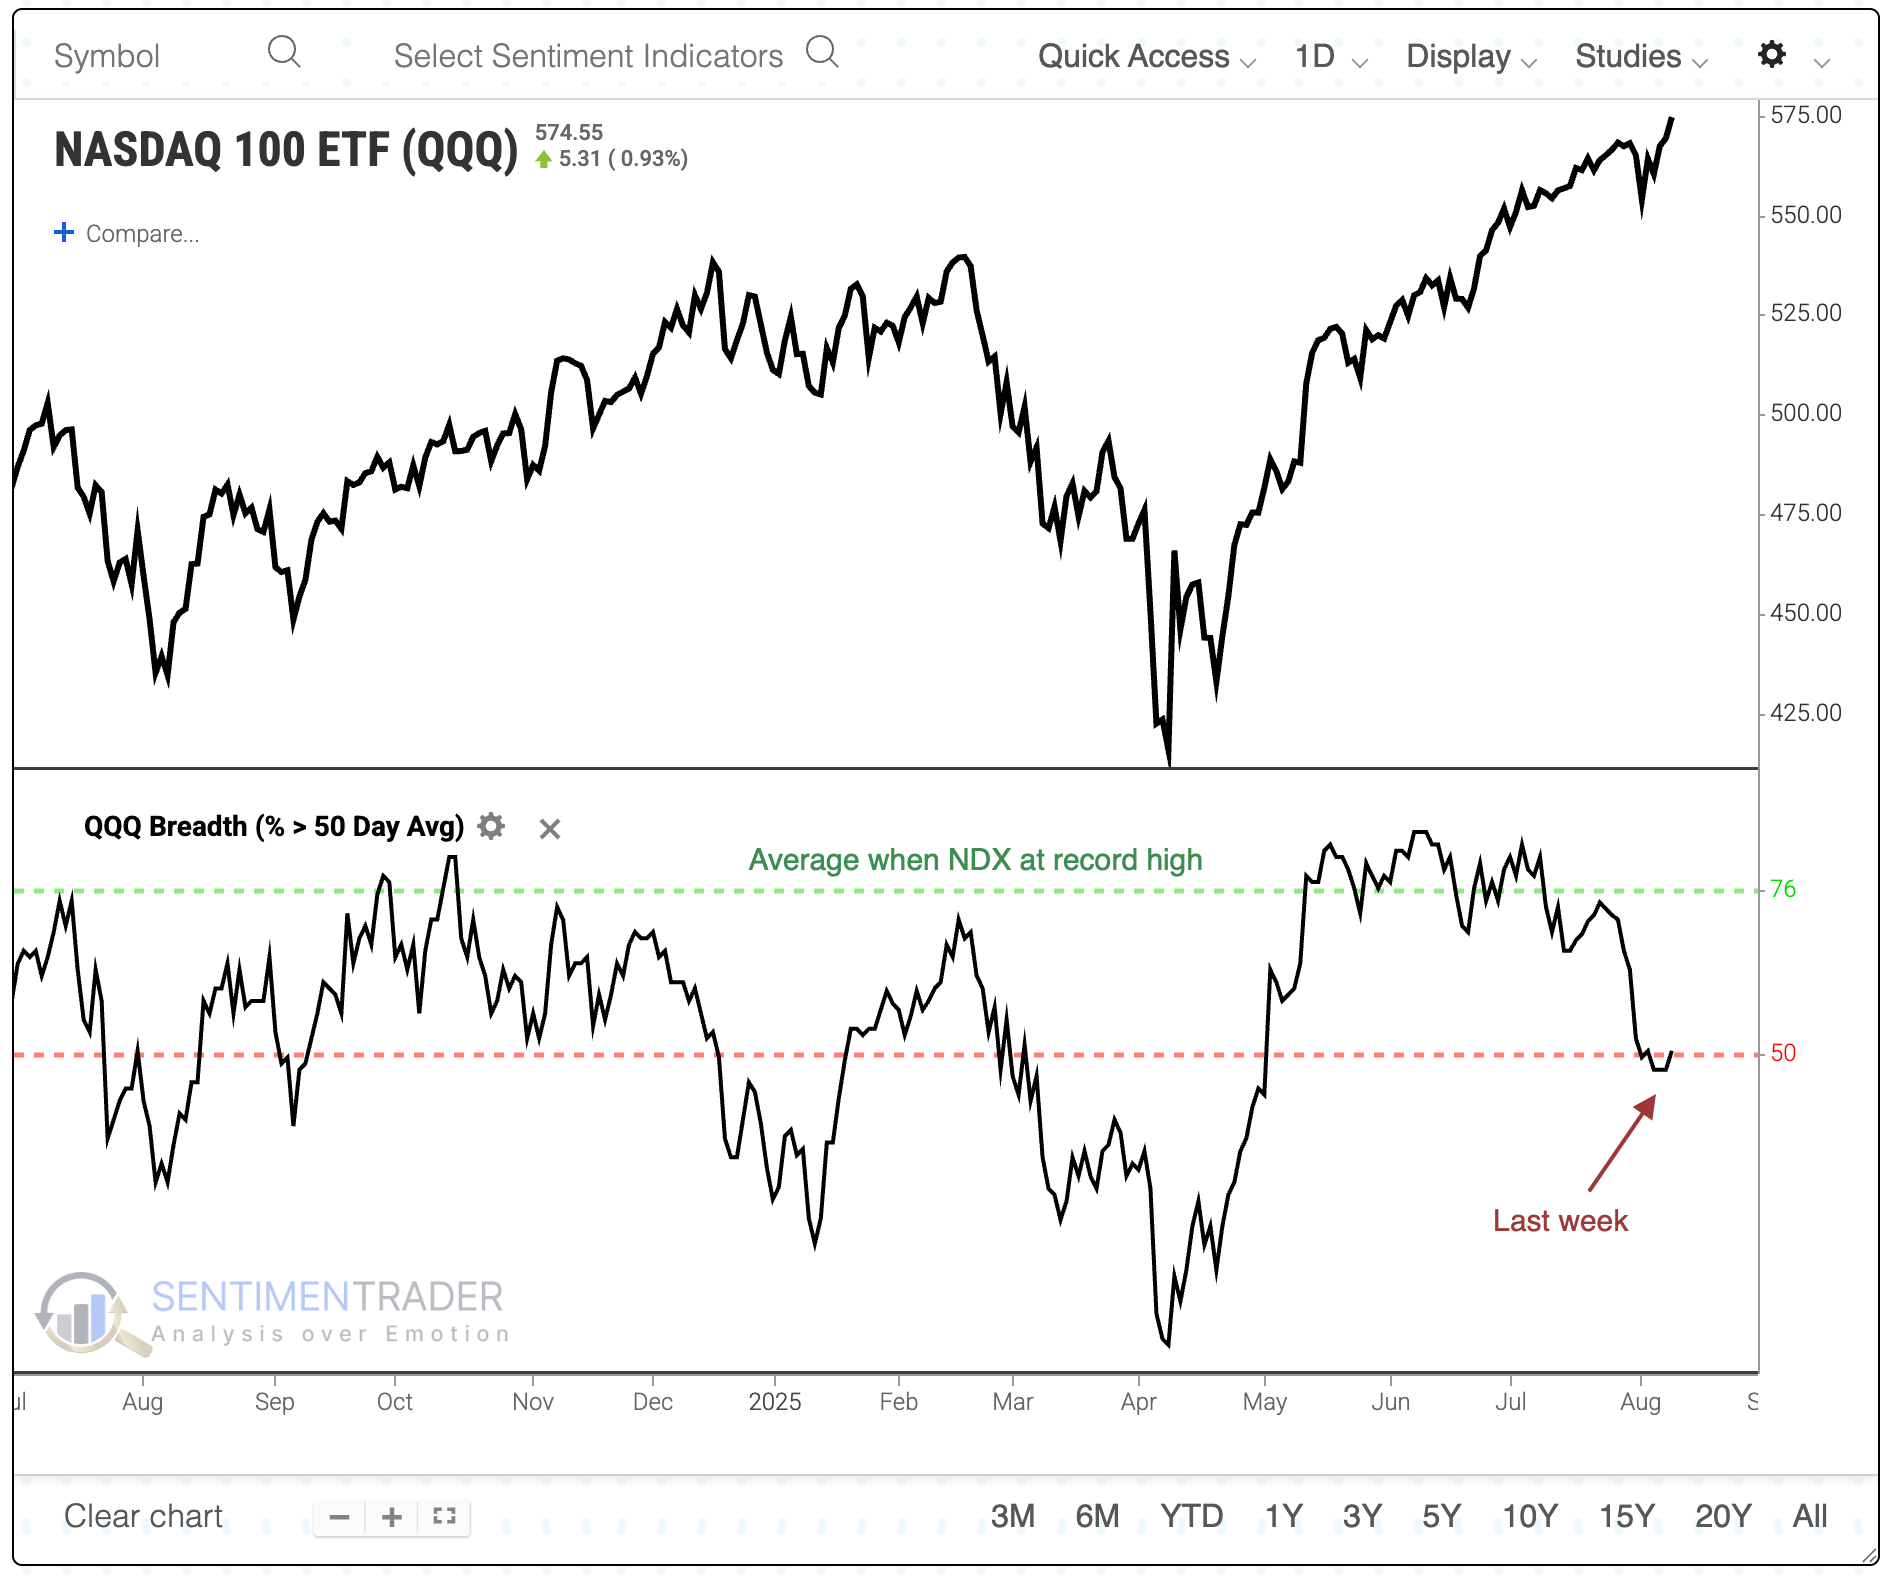
We have to relax the parameters with so few precedents upon which to rely. To balance a larger sample while trying to maintain the context of internally weak participation, we'll look for times when the NDX reached a record high with less than 60% of members above their 50-day average and the index's McClellan Oscillator was below zero.
These were not great signs for big tech stocks on a short-term basis.
Crude conundrum
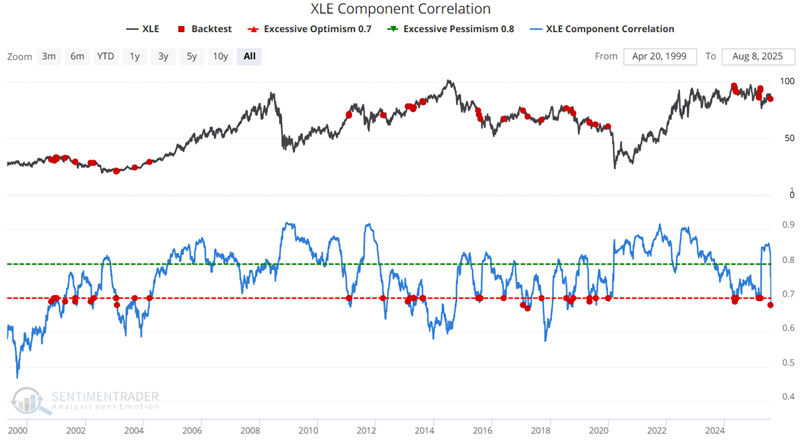
Crude has slid nearly 45% in the last three years. According to some short-term technical measures, crude is oversold and may be due for a bounce. There are some reasons to distrust those measures at the moment.
The XLE Component Correlation shows the degree to which the stocks in the S&P 500 energy sector are trading alike. When the indicator crosses below 0.70, it suggests complacency. The results indicate negative median returns for all timeframes within one year of the signal, and a win rate well below 50%.
The term structure of crude oil futures shows the relationship of the near-term futures contract to a further-out contract. If it is above 1, the near-term contract is priced higher than the further-out contract, called backwardation.
On June 6th, and again on July 30th, crude oil term structure crossed above the significant level of 1.05 for the first time in 21 days. The contract was higher only 16% of the time six months later.
Intraday Minutes
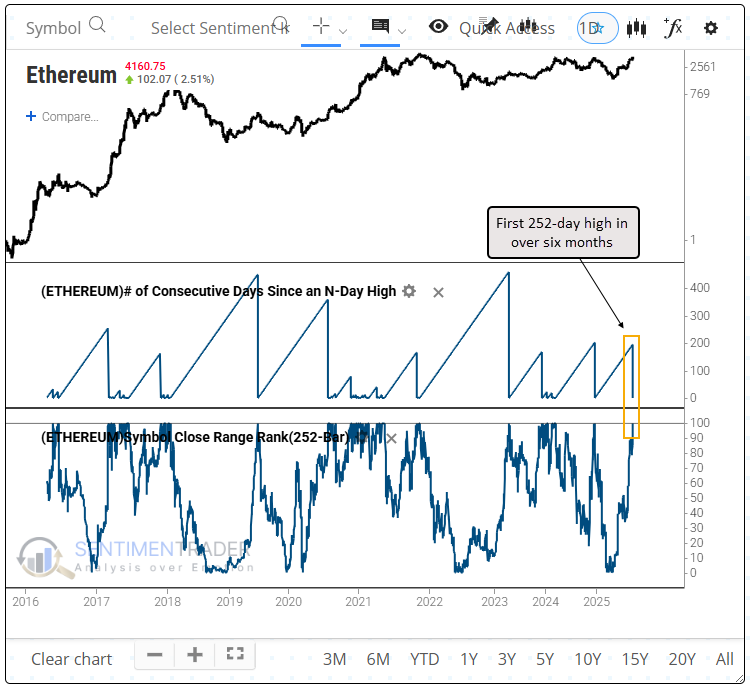
In the "unofficial" stream of intraday minutes, we looked at how ethereum made a new high.
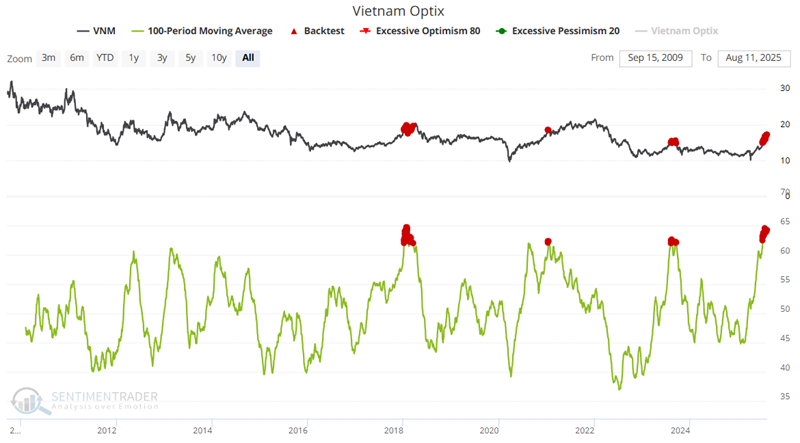
The Vietnam Optimism Index moved into extreme territory.
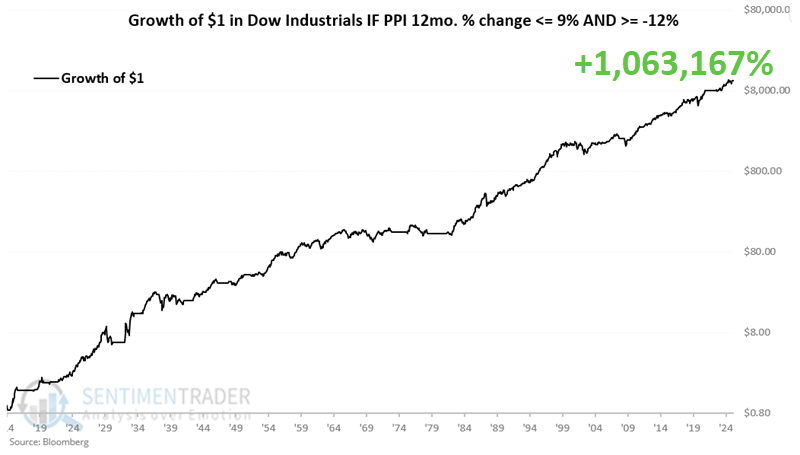
The "worrisome" PPI reading wasn't nearly above or below a threshold that has proven worrisome in the past.
We also noted that hedge fund exposure to stocks is rebounding and that many stocks on the Nikkei have hit new highs.
About TradingEdge Weekly...
The goal of TradingEdge Weekly is to summarize some of the research published to SentimenTrader over the past week. Sometimes there is a lot to digest, and this summary highlights the highest conviction or most compelling ideas we discussed. This is NOT the published research; rather, it pulls out some of the most relevant parts. It includes links to the published research for convenience, and if you don't subscribe to those products, it will present the options for access.